Article Text

Abstract
Introduction Adult smoking prevalence in Taiwan rapidly declined from 26.5% in 2005 to 20.0% in 2015. Nevertheless, future projections on smoking-attributable deaths and current per capita consumption do not paint an equally bright picture.
Methods We used SimSmoke, a tobacco control simulation model to assess the impact of tax increases and other policies by predicting past and projecting over future decades smoking rates and smoking-attributable mortality.
Results The model accurately depicts the decline in smoking prevalence observed in Taiwan from 2000 to 2015. Nonetheless, under the ‘status quo’ scenario, smoking-attributable mortality is projected to continue growing, peaking at 26 602 annual deaths in 2039 and cumulative deaths >1 million by 2044. By comparing projections with current policies with a counterfactual scenario based on the 2000 policy levels, SimSmoke estimates that tobacco control in Taiwan has been able to reduce smoking prevalence by 30% in 2015 with 450 000 fewer smoking-attributable deaths by 2060. Modified scenarios show that doubling the retail price of cigarettes and fully implementing the remaining MPOWER measures would avert approximately 45 000 lives by 2040 and 130 000 by 2060.
Conclusions Tobacco will be a leading cause of death in Taiwan for the coming decades, showing yet again the long-term consequences of smoking on public health. The MPOWER package, even if adopted at the highest level with a large tax increase, is unlikely to reduce smoking prevalence to the endgame goal of 5% in the next five decades.
- price
- WHO MPOWER
- endgame
- SimSmoke
This is an open access article distributed in accordance with the Creative Commons Attribution Non Commercial (CC BY-NC 4.0) license, which permits others to distribute, remix, adapt, build upon this work non-commercially, and license their derivative works on different terms, provided the original work is properly cited, appropriate credit is given, any changes made indicated, and the use is non-commercial. See: http://creativecommons.org/licenses/by-nc/4.0/.
Statistics from Altmetric.com
Introduction
In 1997, Taiwan established its first comprehensive policy package for tobacco control, the Tobacco Hazards Prevention Act (THPA), subsequently revised in 2009 to include pictorial health warnings, smoke-free worksites and restaurants and the banning of most tobacco advertising. In 2002, the Health and Welfare Surcharge on Tobacco Products (HWSTP) was introduced, and since then the tobacco levy has been periodically raised, the last hike being decreed in 2017. Retail cigarette prices have consequently increased, but smoking is still relatively cheap, with excise taxes currently constituting <60% of the total price. The HWSTP has been used for cessation programmes and promotional campaigns, while the available budget for tobacco control has increased from over US$30 million in 20031 to over US$50 million since 2009 onwards,2 making Taiwan’s expenditures per capita (~US$2.2) one of the highest in the world.3 4 As a result, the smoking rate fell from 30% in 20005 to 20% in 2015.6
Even though Taiwan has had some success in reducing tobacco use, smoking is still the largest cause of premature death.7 Per capita cigarette consumption has decreased only slightly in the last decade and remains one of the highest in Asia.8 Moreover, the rate of decline is slowing recently, making it unlikely for Taiwan to reach its overall goal to reduce smoking prevalence among adults to 10% by 2020.9
Using simulation modelling, we first conducted a retrospective analysis aimed at evaluating the consequences of the measures adopted starting from 2000, including the crucial 2009 THPA amendment. We then considered two future scenarios, one in which the current tobacco control legislation remains unchanged, and another hypothesising full implementation of the MPOWER10 package. The computational tool employed in this study is SimSmoke,11 12 a well-established computational model that has been successfully tested and used in >20 countries, including, among others, Brazil,13 China,14 Italy,15 Korea16 and Thailand.17 An early version of SimSmoke had been applied in Taiwan in 2005 to predict the effect of the tax hike introduced in 2002,18 when the country entered the World Trade Organisation.
Methods
SimSmoke overview
SimSmoke is composed of three modules: population, smoking and policy, all working at discrete (yearly) simulation steps. Beginning from a baseline year (the starting point), the population module applies fertility and mortality rates to estimate the demographics trend over time, by age and gender. The smoking module uses age-specific and gender-specific rates for smoking, cessation and relapse, to subsequently divide the population into current, never and former smokers by years of cessation, and finally to provide, for each year, the smoking prevalence by age and gender. The processes simulated by these two modules are assumed Markovian of the first order, which means that the transition from 1 year to the next depends only on the present state of the variable. The policy module adjusts initiation and cessation rates, based on the level of implementation and enforcement of seven types of tobacco control policies, derived from the MPOWER package: taxation of tobacco products, clean air laws, mass media campaigns, advertising bans, health warnings, youth access enforcement and cessation treatment. Yearly attributable mortality is computed by age, gender and smoking status applying the corresponding relative risks. Further details are available elsewhere.11–18
Input data
The year chosen as the baseline for the simulation was 2000, while the length of the tracking period, that is the time interval defined by the user for inputting the historical policy data, which are needed to ‘ground’ the model’s projections, was set to 17 years (2000–2016).
Population module
Taiwan’s demographic data (mid-year population in 2000) and fertility rates (yearly values from 2000 to 2016) were retrieved from the Department of Household Registration website.19 Fertility rates, originally aggregated by 5-year age groups, were assumed constant for single ages belonging to the same group. Mortality rates were acquired from the population database of the Department of Household Registration,20 and for each age and gender, the mean value calculated over the 2000–2016 period, was used.
Smoking module
Prevalence data for the baseline year were obtained from the Taiwan Social Change Survey (TSCS) conducted in 20005 and focused on adults older than 21 years. Data relative to the 12–20 age range were from a previous study,21 based on the Taiwan National Health Interview Survey (TNHIS). Adults’ data were first aggregated in equally-width age groups and the corresponding frequencies of smokers were calculated. Age-specific values were then obtained by assigning the group value to the mid-point age, and subsequently linearly interpolating between the mid-point values.
Since neither TSCS nor TNHIS provide any information about the number of years since quitting, the percentage of former smokers by age, gender and time since cessation was estimated combining the rates included in the GBD Smoking Prevalence Database,22 with the aforementioned population and mortality data. Using those estimates, the yearly cessation rate was computed as the ratio between individuals who quit within the current year and smokers in the previous year.
Finally, due to lack of data for Taiwan, the US relapse rates23–25 were used as a starting base for a calibration procedure aimed at optimising the choice of gender-specific smoking rates. Specifically, we progressively modified relapse rates for first year since quitting and for between 1 and 2 years since quitting by gender, until the correspondence between simulated and real smoking rates was maximised. Further details on model performance assessment are available in the ’Simulations' section.
Smoker versus non-smoker relative risks for men and women older than 35 years of age were from a Taiwan-based study.26 The values in that study were much lower than those observed in the USA, at least partially due to different smoking behaviour.26 Due to lack of detailed local data for ex-smokers by years since quitting, we applied the default decreasing coefficients found in US studies in the 90s.25 27
Policy module
We inputted Policy Module data for each year from 2000 to 2016, based on the Tobacco Control Reports annually released by the Health Promotion Administration (HPA),28 and on information provided by scholars and antismoking non-governmental organisations. All parameters were further verified by five public health experts in Taiwan.
The annual average retail price per pack was retrieved from a market survey conducted by HPA using the WHO’s average price definition, and then adjusted for inflation by entering the consumer price index, yearly estimated by the Directorate-General of Budget, Accounting and Statistics.29 For the demand elasticity for cigarettes, we adopted the age-specific values applied in the earlier Taiwan SimSmoke.18
Taiwan was considered to have a moderate-to-strong smoke-free legislation. Smoking has been banned in all workplaces and in most public spaces since 2009, except for working environments with fewer than three occupants, pubs, bars and nightclubs that open from 21:00 hours for adults. Due to some known discrepancies between urban and rural areas, the enforcement level was set to 6 out of 10 from 2000 to 2008 and to 8 out of 10 from 2009 to 2016.
Taiwan was categorised to be at the highest level in terms of tobacco control campaigns since 2009, due to the presence of a national agency (HPA), expenditures over US$2 per capita, campaigns that often incorporate quit-lines and a national cessation programme. Before 2009, mass media campaigns were considered low funded from 2000 to 2005 and moderately funded from 2006 to 2008.
The amendment of the THPA in 2009 had extended the marketing ban to include every form of direct advertising on all kinds of media; however, indirect marketing strategies such as brand stretching (products other than cigarettes marked with cigarette brand name) or sponsorship of events are still allowed.
Health warnings were minimal in Taiwan until 2009, including only text messages without any pictorial images. Starting in 2009, health warnings must cover 35% of both sides of the cigarette pack, which corresponds to the second-highest category of the MPOWER four-level scale (‘a warning that covers at least 30% of the principal display area of the pack').30
In terms of youth access enforcement, self-service and vending machines are banned over the entire country, and a well-enforced restriction on selling cigarettes to minors has been in place since 2009. Furthermore, community involvement has reached a good, although not optimal, level after the THPA amendment, being assigned a score of 50 out of 100 before 2009 and 70 out of 100 after 2009. Merchant awareness has evolved similarly, with an improvement in recent years that brought its level to 80 in 2014, and 90 in 2016.
Taiwan has provided a subsidised cessation since 2002 and the first quit-line in Asia since 2003. The programme continues to extend to more health facilities, including pharmacies, dental clinics and community health centres, and offered the highest subsidies in 2012. Nicotine replacement therapy is inexpensive (around 200 New Taiwan Dollar, NTD), but is only provided at no cost to very low-income individuals.
Brief interventions that involve advice and assistance in cessation by healthcare providers are implemented by a small proportion of designated clinics, compared with the level that the entire health professionals’ body could achieve.
Policy levels are summarised in online supplementary appendix A, all the data sources used in our simulations are listed in online supplementary appendix B and a list of key assumptions and limitations is provided in online supplementary appendix C.
Supplementary file 1
Simulations
Model performance, that is, the agreement between observed and simulated data, was assessed by comparing the smoking rate provided by TSCS in 2000,5 2005,31 201032 and 2015,6 and the corresponding Taiwan SimSmoke output. In accordance with a recent study,33 the following indicators, uncorrelated and belonging to different evaluation metrics’ categories, were computed: squared bias (SB),34 root mean squared relative error (RMSRE),35 coefficient of determination (CD)36 and modified modelling efficiency (EF1).37
The overall net impact of the interventions implemented from 2000 in Taiwan was estimated by first setting in each year all policies to their 2000 levels (‘counterfactual’ scenario) and then calculating the difference between the corresponding output and the output obtained with all policies currently in place (‘status quo’ scenario).
Future smoking rates and smoking-attributable deaths (SADs) were also simulated under two scenarios, assuming full implementation of the MPOWER package starting from 2018 with a retail cigarette price increase from 100 NTD to 200 NTD per pack (‘Full200’ scenario), and from 100 NTD to 300 NTD per pack (‘Full300’ scenario), respectively. Full200 and Full300 included total smoke-free air laws, a complete ban on direct and indirect advertising, well-funded mass media campaigns, strong pictorial warnings, comprehensive smoking cessation services and strict youth access policies. Note that for all future projections, the parameterisation for year 2017 was set equal to the status quo scenario, incorporating the last tax hike of 20 NTD in effect from June 2017. The main features of the four future scenarios are summarised in table 1.
Policy levels and retail price of cigarettes for the four scenarios
Results
Model performance evaluation
Taiwan SimSmoke simulates satisfactorily the smoking prevalence among men and in total over the period 2000–2015 (figure 1), as also shown by the performance assessment in table 2. The difference between observed and predicted values is quite small, in terms of both average error (SB=9.61E-06 among men and 6.28E-05 overall) and relative error (RMSRE=4.12% among men and 4.11% overall). Moreover, the model is able to explain most of the total variance in the observed data (CD close to 1), and describes the behaviour of the observed data better than the average of the observations (EF1 positive and close to 1). The women’s trend is considerably underestimated (figure 1). However, due to the small number of smokers among women in Taiwan, this result has little impact on the overall predictive power of the model and on its reliability.
Performance evaluation of Taiwan SimSmoke in terms of smoking rate by gender group, over the 2000–2015 period

Smoking prevalence among adults (aged 18+ years) in Taiwan over the 2000–2015 period: comparison between simulated (Taiwan SimSmoke) and measured (Taiwan Social Change Survey (TSCS)) data by gender.
Impact of policies implemented since 2000
Under current tobacco control policies (status quo scenario), mainly stipulated by the 2009 laws and incorporating the 2017 tax increase, the smoking rate among all adults is projected to decline in absolute terms by 3.3% (14.8% in relative terms) from 22.2% in 2010 to 18.9% in 2020, by 4.8% (21.5% in relative terms) in 2030, by 7.6% (34.3% in relative terms) in 2050 and by 8.3% (37.4% in relative terms) in 2060. By gender, the reductions projected during the same years are: 0.4% (9.8%), 0.6% (13.3%), 0.9% (21.3%) and 1.1% (25.3%) for women; 6.9% (18.4%), 10.2% (27.2%), 15.3% (40.7%) and 16.6% (44.0%) for men (table 3). The smoking rate is projected to reach approximately 15% by 2046 and 14% by 2057, exhibiting a slow but constant decrease. Starting from the percentage of never smokers among men in 2010 (41.3%), the relative decrease is expected to range between −4.2% in 2020 and −50.8% in 2060, as a consequence of a stable percentage of projected former smokers over time (21.0% in 2010, 23.8% in 2020, 24.0% in 2030, 22.6% in 2040, 19.9% in 2050 and 16.6% in 2060). However, the same relative decrease among women is between −0.5 and −2.4%, due to former smoker rates below 1%.
Smoking rate by gender, as simulated by Taiwan SimSmoke
The counterfactual scenario produces a much slower decline in smoking prevalence (table 3). Estimated as a decreasing trend independent of any policy intervention, it is used for calculating the net contribution of the 2009 amendment and of the other measures adopted starting from 2000. Thus, computing the difference between counterfactual and status quo and then dividing it by the 2000 smoking rate, we can estimate that the relative decrease in smoking prevalence attributable to tobacco control policies actually implemented in Taiwan was 26.7% in 2010 and 29.6% in 2015, while would be 40.4% in 2030, 45.6% in 2050 and 48.0% in 2060.
Under the status quo scenario, the predicted annual number of SADs in 2017 was 19 594 for men and 2245 for women. Attributable mortality among men is projected to keep increasing until 2038 (22 992 yearly deaths), and to drop again below 19 000 by 2055. With respect to the yearly SADs estimated in 2010 (18 440), the relative increase is expected to be 5.6% by 2020, 17.1% by 2030 and 24.3% by 2040. On the other hand, with policy levels unchanged since 2000, annual yearly SADs are >30 000 from 2033 to 2057, are a maximum in 2042 (32 906) and never fall below 22 000 (figure 2). Focusing on women, the annual smoking attributable mortality exhibits its peak much later (3878 deaths in 2056), with virtually no decrease until 2057. Moreover, from 2010 to 2041 SADs are projected to double, from 1834 to 3681. As before, the counterfactual scenario follows a similar trend as the status quo, but with much higher values (figure 3).
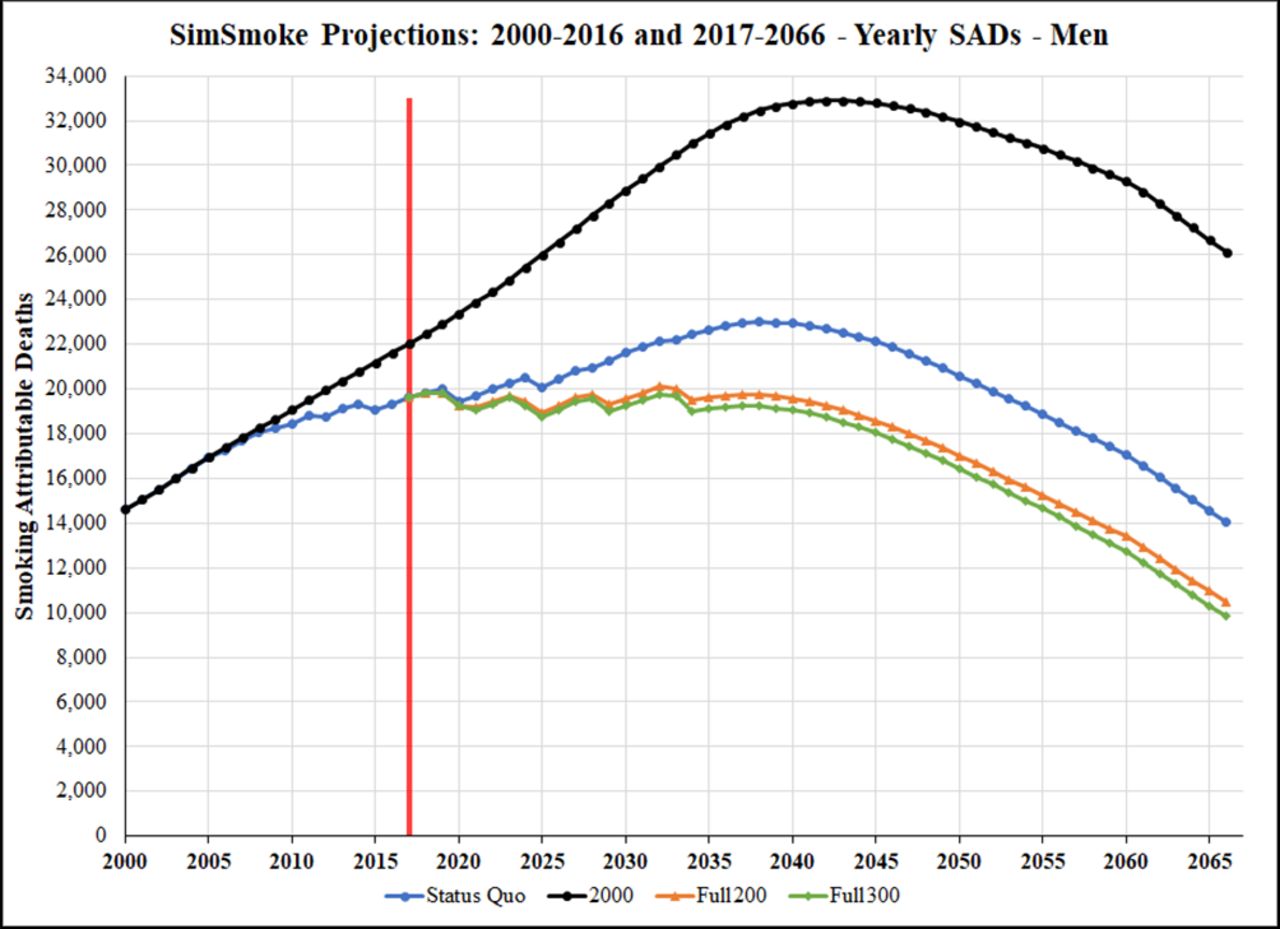
Taiwan SimSmoke projections 2000–2016 and 2017–2066: yearly smoking-attributable deaths (SADs) among men.

Taiwan SimSmoke projections 2000–2016 and 2017–2066: yearly smoking-attributable deaths (SADs) among women.
Tobacco control interventions implemented since 2000 are estimated to have averted >9000 lives by 2015, as SimSmoke predicts 306 867 SADs cumulated from 2000 to 2015 under the status quo scenario and 316 085 under the counterfactual scenario. With respect to the future projections, the differences between the two scenarios are 24 967 by 2020, 89 145 by 2030, 188 359 by 2040, 311 451 by 2050 and 451 824 by 2060 (table 4).
Cumulative SADs (from 2000) by gender, as simulated by Taiwan SimSmoke
Potential impact of future policies
Turning to potential increase of future policies, the simulation under the Full200 scenario projects that the smoking prevalence should drop below 10% by 2054, with 14.7% among men and 2.4% among women. The second alternative (Full300 scenario) is more effective, projecting the total smoking rate to be <10% by 2047 and the men smoking rate <15% by 2045.
Under both optimal scenarios, the number of yearly SADs among men never exceeds 20 100, displays a fluctuating trend between 2015 and 2035 and then constantly declines starting in 2038. Among women, yearly SADs always fall below 3500 and start decreasing in 2055. Focusing on the cumulative values, table 4 shows that fully implementing the MPOWER package and doubling the retail price of cigarettes (Full200), would allow to save >13 000 lives by 2030, >45 000 by 2040, >85 000 by 2050 and almost 130 000 by 2060. Further increasing cigarette prices to 300 NTD (Full300), Taiwan would avert >15 000 deaths by 2030, >53 000 by 2040, >100 000 by 2050 and >150 000 by 2060.
Discussion
The goal of the present research was to simulate and analyse past smoking rates and SADs in Taiwan and to predict future trends, exploiting the short-term and long-term projections provided by SimSmoke, a dynamic simulation model developed for estimating the potential impact of tobacco control policies on smoking prevalence and attributable mortality. Based on our simulations, Taiwan’s smoking rate decreased by almost 29% among men in 16 years, due to the measures implemented from 2000 to 2015. Moreover, hypothesising the MPOWER package fully implemented and the price of cigarettes doubled in 2018, we project a potential reduction of 39.6% in 20 years (from 22.2% in 2010 to 13.4% in 2030), and of 47.6% in 30 years (from 22.2% in 2010 to 11.6% in 2040), as displayed in table 3.
While the immediate impact of tobacco control policies on smoking rate is substantial, the effect on the number of SADs in the short term is expected to be limited, because of the burden of past smoking prevalence. Taiwan SimSmoke estimates that, if current policies continue, the cumulative (from 2000) number of SADs will reach 1 000 000 in 2044, that is, in only 26 years from now. On the other hand, even an immediate implementation of the MPOWER package at the highest level would cumulatively save only about 60 000 (Full200) and 70 000 (Full300) lives by the same year.
The WHO MPOWER policies are effective and comprehensive tobacco control measures focused on reducing demand, which, if adopted at the highest level, would achieve the global tobacco control target of 30% relative reduction by 2020, ahead of the timeline. However, even with a full implementation, the Taiwan simulations project that the smoking rate trend eventually flattens and does not reach the endgame target of 5% in the next 50 years. However, results from the counterfactual scenario in table 4 show a large increase in lives saved by the current policies in comparison with remaining at 2000 policies, and the deaths further averted under the two optimal scenarios. The relative difference between SADs projected under the status quo scenario and SADs projected under the counterfactual scenario is 20.7% in 2040, 26.7% in 2050 and 32.5% in 2060. On the other hand, the relative differences between status quo and Full200 are projected as 5.1% in 2040, 7.4% in 2050 and 9.3% in 2060, while under Full300 the relative differences are 5.9%, 8.6% and 10.8%.
Taiwan SimSmoke outcomes are generally consistent with previous studies based on the same modelling tool. In particular, comparing the Taiwan results with other countries that implemented strong policies, yields comparable results. The relative decline in male smoking rates to the policies introduced between 2000 and 2015 (28.8%) is similar to the reduction estimated in Thailand (25% from 1991 to 2006),17 South Korea (17% from 1995 to 2006)16 and Brazil (50% from the longer period of 1989–2008 and with larger price increases).13 In addition, other SimSmoke projections also indicate that implementing complete MPOWER measures still yields smoking rates substantially above 5%.14 15
Tobacco control experience in Taiwan, as quantified by SimSmoke simulations, indicates that there is a need to rethink the current approach. While there have been major gains, at the same time, more can be done. Policymakers should integrate traditional measures with innovative methods including tobacco endgame proposals in response to the constant evolution of new products and strategies by the tobacco industry. Moreover, greater attention should be directed towards socially and economically disadvantaged populations. In particular, ad hoc studies aimed at investigating the response of lower socioeconomic groups need to be conducted, as it has been demonstrated that the main interventions recommended by the Framework Convention on Tobacco Control38 generally do not reduce social inequalities in smoking,39 except for higher taxation.40 It is of paramount importance to prevent the reductions in smoking to have limited impact on the poorer social classes. Furthermore, in addition to MPOWER demand-side policies, supply side interventions against illicit trade, tobacco industry interference and duty-free sales, together with novel measures such as regulating content in tobacco products, and promoting campaigns for tobacco industry denormalisation, will need to be introduced or strengthened.
Like other simulation-based studies, the results depend on limitations intrinsic to the model, which by definition provides a simplified representation of reality, and on the quality and availability of input data. SimSmoke does not take into account the recent proliferation of electronic cigarettes, which may play a role as gateway to conventional smoking among youth,41 and act as a facilitator of smoking cessation among adults.42 Betel quid chewing, which is a widespread practice in Taiwan, is not part of the model as well, and may have affected the accuracy of our simulations due to its strong relationship with smoking behaviour (the great majority of chewers are smokers) and due to its health effects in combination with smoking.43 In addition, the age-specific mortality rates are constant over all future years, which may overestimate SADs especially in later years. However, SAD may be underestimated, because smoker relative mortality risks were based on recent cigarette use in Taiwan and may be expected to increase over time to the levels in high-income nations. In addition, we do not consider deaths due to second-hand smoke, which is likely to be important for women. With regard to input availability, we lacked nationally representative data in Taiwan for relapse rates, cessation rates and the percentage of former smokers by years since quitting. However, several previous SimSmoke models adopted US relapse rates, and predicted well.13–17 Moreover, the percentage of former smokers resulting from our estimations was consistent with the data reported in the TNHIS21 44 (which do not distinguish by years since quitting). Finally, we were unable to capture well trends in female smoking rates, although substantially lower than male rates. Better information is needed on female initiation rates.
Conclusion
Taiwan SimSmoke shows that full implementation of the MPOWER package with a large increase in the retail price of cigarettes could significantly reduce the smoking rate, even in a country where those measures have already been adopted at a moderate-to-strong level. However, the simulations also show that the effects on SADs are limited, and that the 5% endgame target will not be achieved in the next few decades without more drastic measures.
What this paper adds
The demand-side MPOWER measures, as recommended by WHO, have long proven to be effective in reducing tobacco use.
It is not clear whether the current declining trend, partly due to MPOWER implementation, will continue until achieving a tobacco endgame or will encounter a plateau in the next future.
Our study shows that in a relatively high-performing country like Taiwan, which had significant success in reducing tobacco use in the past, the current WHO MPOWER policies, even if fully implemented with a large tax increase, will not achieve the 5% endgame smoke-free society target in the next five decades.
The impact of the MPOWER measures is expected to weaken over time. Thus, new policies should be considered to prevent tobacco use from levelling off in the next few decades.
Acknowledgments
The authors wish to thank the Health Promotion Administration and the John Tung Foundation for their help in the data collection process.
References
Footnotes
MS and WG contributed equally.
Contributors DTL designed the original model and the computational framework. MS and WG collected, organised and analysed the data. MS carried out the implementation, performed the calculations and ran the simulations. MS and WG wrote the manuscript with input from all the coauthors. Y-WC, H-YC, Y-HC and C-PW provided critical feedback on policy implementation and helped to shape the research. WG conceived the study and was in charge of overall direction and planning. All coauthors discussed the results, commented on the manuscript and approved the final version. MS and WG are co-first authors.
Funding This work was funded by the Health Promotion Administration, Ministry of Health and Welfare, Taiwan (ROC), with funding from the Health and Welfare Surcharge on Tobacco Products (grant number: 03724606, project code: 1051218-107).
Disclaimer The Health Promotion Administration had no role in the study design, collection, analysis or interpretation of the data, writing the manuscript or the decision to submit the paper for publication.
Competing interests None declared.
Provenance and peer review Not commissioned; externally peer reviewed.
Correction notice Please note this article has been updated since published Online First. A column in Table 3 was previously omitted.
Patient consent for publication Not required.