Article Text

Abstract
Objectives: To estimate smoking attributable mortality (SAM) in Taiwan for the years 2001 through 2020 under scenarios of reductions in smoking rates by 0%, 2%, 4%, and 10% per year.
Method: The smoking attributable fraction (SAF) was used to calculate SAM from the risk experience in following up a large cohort (86 580 people) in Taiwan. Smoking rates were based on the 2001 National Health Interview Survey and other national surveys. An average 10 year lag was assumed between smoking rates and subsequent mortality.
Results: In 2001, 18 803 deaths, or 1 out of 4 deaths (27%), in middle aged men (35–69 years old) were attributable to smoking. SAM has been increasing and will continue to increase if smoking rates remain constant or even if reduced annually by 2%. SAM would begin to decrease only if rates were to be reduced by at least 4% a year.
Conclusions: The projected SAM in this study illustrates the seriousness of smoking caused mortality. Current efforts in tobacco control would lead to a progressive increase in SAM, unless efforts were doubled and smoking rates reduced by more than 4% a year. The urgency in requiring stronger tobacco control programmes to attenuate the staggering death tolls is compelling.
- ACS, American Cancer Society
- CDC, Centers for Disease Control and Prevention
- CPS, cancer prevention study
- ETS, environmental tobacco smoke
- IARC, International Agency for Research on Cancer
- NHIS, National Health Interview Survey
- SAF, smoking attributable fraction
- SAM, smoking attributable mortality
- smoking attributable mortality
- smoking prevalence
- cohort study
Statistics from Altmetric.com
- ACS, American Cancer Society
- CDC, Centers for Disease Control and Prevention
- CPS, cancer prevention study
- ETS, environmental tobacco smoke
- IARC, International Agency for Research on Cancer
- NHIS, National Health Interview Survey
- SAF, smoking attributable fraction
- SAM, smoking attributable mortality
In the late 1980s, the US Centers for Disease Control and Prevention (CDC) created a software program, SAMMEC, to calculate smoking attributable mortality (SAM).1 Applying the smoking attributable fraction (SAF) approach, SAM has been calculated for the USA,2–6 for North America and Latin America,7 and for selected other countries.8–11 Using a different approach, Peto et al12 estimated that there were three million tobacco related deaths occurring worldwide in the early 1990s,13 and according to Ezzati and Lopez this estimate has increased to 4.84 million in 2000.14 It has been projected that tobacco will cause around 10 million deaths globally by the year 2020,13 with more deaths occurring in developing countries rather than in developed countries.14 Ever since its first use nearly two decades ago, SAM has emerged as one of the most important summary statistics to convey the health burden of smoking.
The pace at which SAM increases and the efforts needed to reduce tobacco caused deaths are of great interest to policy makers in setting goals for tobacco control programmes. This paper estimates current SAM and projects changes in the next 20 years for Taiwan. Since the smoking rate is the most important parameter commonly used to measure the influence of tobacco control programmes, we projected SAM under different smoking rate reduction scenarios—that is, a reduction of 0%, 2%, 4%, or 10%. Through the results of this study, the public and policymakers may be better informed of the urgency and the level of efforts needed in mounting tobacco control programmes.
METHOD
Calculation of SAM
The SAF of the ith smoking related disease in the year t was derived for each cause or for all causes by the following formula:

where P is the smoking prevalence, P(t-10), the smoking prevalence of 10 years ago from the year t, and RRi, is the ith category of relative risk of smoking related diseases. Because of the long and variable periods of latency for different smoking related diseases, we used a method similar to the one used by the American Cancer Society (ACS) whereby a 10 year lag of smoking rate was used to calculate the SAM.15
Applying SAF to the number of smoking related deaths, SAM is calculated over all disease categories as:

where Mit is the number of deaths (35 years and older) for the ith disease category in the year t (based on the official projection of number of deaths by specific causes for each of the next 20 years for Taiwan).16 SAM was projected by applying the SAF for each of these years to the projected number of deaths in Taiwan.
Relative risks
Relative risks (RR) for current smokers were derived from follow up data from a large cohort in Taiwan beginning in 1982. The cohort consisted of 86 580 study subjects (53 091 men, 33 489 women) who were 35 years old or older.11,17,18 Cox’s proportional hazards model was used to examine the relation between smoking status and subsequent mortality risks (RR), as previously reported (table 1).19 The RR for all causes among ex-smokers was used to calculate the risks of ex-smokers. There were insufficient data to distinguish risks by number of years since quitting smoking, so the risk measures of ex-smokers were adjusted using the slope of declining risks with similar smoking intensities in the US cancer prevention study II (CPS-II) study.20 The relative risks for second hand smokers at home and at work were derived from the International Agency for Research on Cancer (IARC) Monograph,21 and Woodward and Laugesen,22 respectively. Only lung cancer, ischaemic heart diseases, and cerebrovascular diseases were included in calculating the smoking attributable deaths from environmental tobacco smoke (ETS).
Relative risks used and SAM calculated for 2001 by causes of death and smoking status
Prevalence of smoking
Smoking was already very popular in Taiwan in the early 1960s.23 Adult males aged 35 years and over had smoking prevalence rates (age standardised to 2001 population) above 75%, which remained at that level into the 1970s. Smoking rates among men started to decline in the late 1970s (73% in 1979), and the decline accelerated in the 1980s (59% in 1986). After the cigarette market opened in 1987, the rate climbed to 63% in 1990 and then declined to 47% in 2001.24 Female smoking rates remained relatively low during this period (4–8%).
In this study, the smoking prevalence rates for both males and females aged 35 years and older for the year 2001 were derived from data collected in the National Health Interview Survey (NHIS). The detailed methodology of this nationally representative survey has been described elsewhere.24,25 In brief, the survey used PPS sampling (probability proportionate to the size of the population or stratified cluster sampling) and included 25 464 respondents. For smoking rates between the years 1990 through 1996, biennial surveys conducted for market and consumption analysis by the government-run Taiwan Tobacco and Wine Monopoly Bureau (the Monopoly Bureau) were used.23 The Monopoly Bureau conducted national surveys every other year since 1963 on tobacco consumption and smoking behaviour. Each survey sampled around 6000 households, with a sample size of 20 000, amounting to over 0.1% of the population in Taiwan.
Current smokers were defined as daily smokers who had smoked at least 100 cigarettes in their lifetime, according to the World Health Organization’s definition. Data for ex-smokers came from the NHIS. The rates for ex-smokers in 2001 were assumed and applied to the years 1990 through 2000 because data were not available for these years. Ex-smokers were defined as former daily smokers who had not smoked for the previous 30 days.
Information on ETS at home and at worksite came from the NHIS and from a worksite survey,26 respectively. Home exposures were based on the question, “Did anyone, including visitors, ever smoke inside your home?”. For those answering yes, a follow up question regarding the number of days exposed in a week was asked. Current and ex-smokers were excluded in the calculation of the ETS portion of SAM. Passive smokers in the workplace were defined as those non-smoking adults who were exposed at work.
In order to examine the possible intensity of tobacco control measures, five smoking cessation or smoking rate reduction scenarios were assumed: a 0% reduction (that is, maintaining the 2001 smoking rate), a 2% annual reduction (that is, prevalence of a given year = 0.98 × prevalence of previous year), a 4% and 10% annual reduction from 2001.
RESULTS
The smoking rate for adult males aged 35 and older in 2001 was 47.3%, but in 1990, the rate was 62.8%, or 33% higher. In 2001, the number of deaths from smoking attributable diseases was estimated to be 18 803 (86% men, 14% women). Active smokers made up 82%, ex-smokers 13%, and second hand smokers 5% of deaths. SAM represented 22% of all Taiwanese deaths in men and 6% in women. Combined, SAM accounted for 16% of all deaths in Taiwan, at a rate of 52 deaths a day. Smoking caused one out of four deaths in middle aged men (27%) between the ages of 35–69 years, and one out of 11 in women (9%). Women suffered more than men from ETS, with deaths attributed to ETS constituting nearly one quarter (23%) of the SAM for women (table 2).
Summary of calculated smoking attributable mortality (SAM) by smoking status for 2001
Scenarios for different smoking rate reductions are shown in fig 1, and the projected SAM corresponding to these scenarios are shown in fig 2. Corresponding to a 2%, 4%, and 10% annual reduction, the smoking rates would be reduced to 32.2%, 21.8%, and 6.4%, respectively, by 2020. If the current smoking rate remains the same for the next 20 years (0% change), SAM for men in 2020 would increase by 38% with 22 237 deaths, an average of 61 deaths per day. If the annual smoking rate were to be reduced by 2%, 4%, or 10% per year from the year 2001, the corresponding projected SAM would decrease to 19 828, 17 618, or 12248 deaths in 2020, respectively. The 61 deaths per day would drop, reducing to 54, 48 or 34 deaths per day, respectively. If the smoking rate could be reduced by 4% annually, 4600 lives would be saved per year, and in this scenario, the projected SAM for 2020 would become close to the 2001 level.
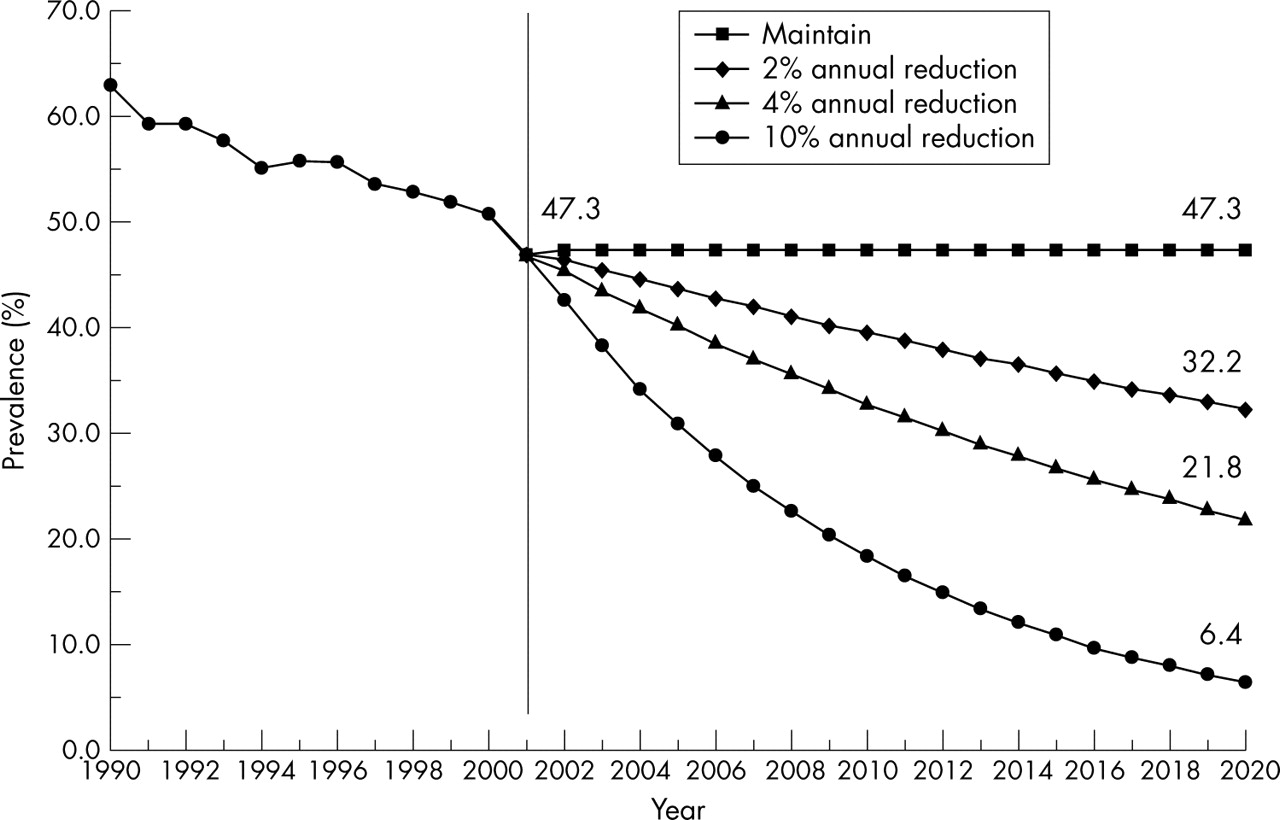
Changing smoking rates for projected SAM calculation.

Projected SAM for each of the next 20 years (2001–2020), with cumulative SAM for 20 years, based on different smoking rates. Number in parenthesis indicates SAM as percentage of total deaths in a given year. The bottom line, All smokers quit in 2001, or a 100% reduction of smoking rate, indicates continuing smoking related mortality by the ex-smokers. Over half of the cumulative SAM expected from maintaining the initial smoking rates would remain and amounted to nearly 200 000 deaths in the 20 years following the disappearance of smoking.
DISCUSSION
The current and projected SAM reported in this paper show clearly how hazardous and costly in lives smoking is to a society. With 18 803 tobacco related deaths in 2001, smoking is one of Taiwan’s most silent but deadly killers, comparable to the loss of lives that would be caused in one jumbo jet airliner crash per week. With one out of four deaths (27%) among men occurring during their productive years, the number of smoking related deaths is larger than the combined number of deaths from SARS (60),27 AIDS (56),28 Dengue fever (0), tuberculosis (1005), and motor vehicle (3582) related deaths in 2001. This number is expected to increase substantially in the next 20 years at the current smoking rate. To keep the SAM from increasing, an annual reduction of more than 4% will be needed. If the smoking rate could be reduced by 10% each year, as many as 10 000 lives could be saved by the year 2020. However, a 4% reduction will require a highly intensified effort from the government and from non-governmental organisations. The smoking rate among Taiwanese men (ages 18 and older) decreased 2% per year between 1990 and 2001.23,24 Thus, any rate of reduction beyond 2% will require additional tobacco control efforts above those already in place. It is noteworthy that the smoking rate reduction for men in the USA since the Surgeon General’s report in 1964 has amounted to an annual reduction of 2%, from 51.9% in 1965 to 21.6% in 2000.29
In Taiwan, one half to nearly two thirds of children and women have been found to be regularly exposed to ETS.30 Nevertheless, only a small fraction of SAM (5%) has been attributed to ETS, in part because the health effects on those younger than 35 were not studied in this paper. Women generally suffer more from ETS than men, because 10 times more men than women smoke in Taiwan.
The size of SAM estimated in this paper is different from those previously reported,11,31,32 in part because a more comprehensive methodology was used. A 10 year lag of smoking rates was applied, ex-smoker’s and secondhand smoker’s risks were included, and the cause specific relative risks were based on a much larger cohort from Taiwan. Nevertheless, compared to the reported SAMs from North American or European countries relative to their smoking population,33 the estimated SAM in this study is still low (table 3). The difference in the estimates can be attributed to the lower relative risks and less maturation among Taiwanese smokers, as reflected by the fewer number of cigarettes smoked per day (7–10 cigarettes less per day), the age of smoking initiation (4–7 years later), and the shorter duration of smoking, coupled with Taiwan’s late introduction to the tobacco market.24,34 It is to be noted that the full epidemic of tobacco attributable diseases and deaths has yet to appear in Taiwan because the uptake of cigarette smoking occurred more recently than in most Western countries, especially among women.
Comparison of SAM from Taiwan, North America, and European countries
Critics claimed that SAM, as calculated by the CDC method, did not control for the lower educational and socioeconomic status of smokers and other risk factors related to smoking, thereby overestimating the burden of mortality.35,36 In addition, they claimed that the relative risks from the CPS-II data were based on volunteers recruited by the ACS, who were not representative of the US population.35,36 Both issues have been addressed in subsequent literature and have been determined to have minimal impact on the results.37–39 We performed a similar comparison in our study between unadjusted and adjusted SAMs. After adjusting for educational levels, the use of alcohol, physical activity, and body mass index, the resulting SAM was reduced by 2.9% from that of the unadjusted.
Smokers have a significantly increased risk of accidental death in Taiwan,40 and so we have included injury in our SAM calculation. It can be argued that accidental deaths are related to smoking only indirectly, being an artefact of smokers’ lower socioeconomic status or reflecting smokers’ greater alcohol use. However, the significant increase of smoking related injury deaths remains after alcohol use or educational levels are adjusted.40 Since this observation is relatively recent and controversial, we also provided an estimate excluding smoking related injury deaths. The impact of this exclusion was relatively small, with only a 6.5% reduction from the original SAM.
In this study we did not include many well established causes of smoking related deaths reported in the western literature.2,41,42 Conditions such as cancers of the larynx, pancreas, urinary bladder, or kidney, and deaths from coronary heart disease and stroke in persons age 65+ were not included. This is because the SAM calculated in this study was based on relative risks for causes that were significant from a cohort in Taiwan. To a large extent the lack of significance for some smoking related diseases could be due to the short duration of the cohort follow up. However, by including the additional smoking related diseases that were specific to Taiwan, the results should be more pertinent to this Asian population.
CDC’s SAMMEC method uses smoking rates from the same year as the calculated SAM.2 However, the use of the CDC method in calculating SAM requires the assumption of a steady state of smoking prevalence and mortality risks. Since smoking rates in Taiwan have been decreasing by 2% per year between 1990 and 2001, the use of the 2001 rate for calculating SAM for 2001 would have violated such an assumption of a steady state and underestimated the SAM. This is the major reason why a latency of 10 years was applied in our calculation. Most smoking related diseases are known to have a latency period lasting from several years to several decades.2 We have conducted two additional SAM calculations, one based on a five year lag and the other based on a no-lag in the choice of smoking rates. The resulting SAM was 3.2% (18 209) and 10.0% (16 931), respectively, lower than the current estimate based on a 10 year lag (18 803). Decreasing trend in smoking rates would also lead to lower SAM in future years. As nearly half (44%) of our SAM came from cancer deaths, which has a latency generally greater than 15 years, the use of smoking rates 10 years before smoking related deaths would seem to be a reasonable compromise. We believe that the use of a 10 year lag is particularly relevant for Taiwan where smoking rates have steadily changed over the years.
What this paper adds
The large number of deaths related to smoking is a major public health burden accounting for 16% of all deaths in Taiwan, 22% for males and 6% for females. The number of smoking related deaths is expected to increase. To prevent this, smoking rates should be reduced by 4% or more every year. This requires a doubling of the current efforts. If Taiwan were to become “tobacco-free”, there would still be 200 000 smoking related deaths over the next 20 years, indicative of the urgency required for tobacco control efforts.
In a hypothetical exercise, we attempted to find out the impact on SAM with a 100% reduction of smoking rate or when every smoker in Taiwan quit smoking. If smoking were to be eliminated, nearly 200 000 ex-smokers will still expect to die from smoking related illnesses in the following 20 years, and over half (52%) of the expected SAM would remain. A recent paper similarly noted that, “If everyone on the planet were to quit tomorrow, there would still be tens of millions smoking related deaths from that point on”.43 In other words, SAM would continue to haunt Taiwan, until the society became smoke-free for about 20 years. The urgency to mount stronger programmes in tobacco control is compelling.
In conclusion, SAM in Taiwan will continue to rise over the next 20 years unless smoking rates are reduced by at least 4% a year. The projected SAM in this study illustrates the seriousness of smoking caused mortality. Current efforts in tobacco control would lead to a progressive increase in SAM. The urgency in requiring stronger tobacco control programmes to attenuate the staggering death tolls cannot be overemphasised.