Article Text

Abstract
Objective To evaluate the long-term net economic impact of the California Tobacco Control Program.
Methods This study developed a series of dynamic models of smoking-caused mortality, morbidity, health status and healthcare expenditures. The models were used to evaluate the impact of the tobacco control programme. Outcomes of interest in the evaluation include net healthcare expenditures saved, years of life saved, years of treating smoking-related diseases averted and the total economic value of net healthcare savings and life saved by the programme. These outcomes are evaluated to 2079. Due to data limitations, the evaluations are conducted only for men.
Results The California Tobacco Control Program resulted in over 700 000 person-years of life saved and over 150 000 person-years of treatment averted for the 14.7 million male California residents alive in 1990. The value of net healthcare savings and years of life saved resulting from the programme was $22 billion or $107 billion in 1990 dollars, depending on how a year of life is discounted. If women were included, the impact would likely be much greater.
Conclusions The benefits of California's Tobacco Control Program are substantial and will continue to accrue for many years. Although the programme has resulted in increased longevity and additional healthcare resources for some, this impact is more than outweighed by the value of the additional years of life. Modelling the programme's impact in a dynamic framework makes it possible to evaluate the multiple impacts that the programme has on life, health and medical expenditures.
- Cost of smoking
- healthcare expenditures
- California Tobacco Control Program
- economics
- public policy
This is an open-access article distributed under the terms of the Creative Commons Attribution Non-commercial License, which permits use, distribution, and reproduction in any medium, provided the original work is properly cited, the use is non commercial and is otherwise in compliance with the license. See: http://creativecommons.org/licenses/by-nc/2.0/ and http://creativecommons.org/licenses/by-nc/2.0/legalcode.
Statistics from Altmetric.com
Introduction
The California Tobacco Control Program (CTCP) was established in 19891–3 using a portion of the tax revenues generated as a result of the Tobacco Tax and Health Protection Act, Proposition 99. With an annual budget of roughly $100 million, the CTCP became the largest comprehensive tobacco control programme in the world.1–3 The $0.25/pack increase in tobacco taxes, which funded the programme went into effect in January 1989. Several other components were launched in spring 1990: a statewide anti-tobacco media campaign, community-based interventions and school-based prevention programmes. From the beginning, the CTCP has emphasised a strategy of changing social norms to make tobacco use less desirable, less acceptable and less accessible.4 5 The ultimate goal is to reduce tobacco-related diseases, poor health and deaths in California.6
A number of studies have been undertaken to evaluate the impact of the CTCP.7–15 Most of them focused on process indicators such as amount of funding and the scope of programme implementation, smoking outcome measures such as per capita cigarette consumption and smoking prevalence, and percentage of population protected by smoke-free homes or workplaces. A few studies examined the health benefit of the CTCP. Fichtenberg and Glantz16 found that the CTCP was associated with an immediate reduction in deaths from heart disease. Another study reported that from 1989 to 1999, the CTCP was associated with a 6% reduction in lung cancer incidence.17 Only one study evaluated the economic effect of the CTCP, estimating that the programme saved $86 billion in 2004 dollars of healthcare expenditures between 1989 and 2004.18 However, the long-term economic effect of the CTCP, including reduced smoking-related diseases (SRDs) and reduced smoking-related deaths, has not been documented.
To the extent that the CTCP successfully reduces the incidence of SRDs, it would save smoking-attributable healthcare expenditures (SAEs). The SAEs in California were estimated at $8.6 billion for 199919 and $8.7 billion for 1993.20 These estimates, referred to as ‘gross’ SAEs,21 were based on an annual cost of smoking approach.22 The reduction in number of premature deaths may impose additional healthcare expenditures during the prolonged years of life for people with avoided premature death. The tobacco industry refers to the potential saving from premature death as the ‘death benefit’.23 24 Cost of smoking estimates which take into consideration the expenditures net of the death benefit are referred to as ‘net’ SAEs.21
The issue of the ‘gross’ versus ‘net’ SAEs was first raised by Leu and Schaub.25 They estimated the lifetime cost of smoking by simulating the medical cost history of Swiss men with and without cigarette smoking. They concluded that the extra years of costs experienced by the longer-lived non-smoking cohort approximately balanced out the higher costs during each year of the smokers' shortened lives. Barendregt et al26 used a dynamic method to estimate the effects of smoking cessation on healthcare costs over time in Finland and found that if all smokers quit, healthcare costs would be lower at first but after 15 years there would be a net increase in healthcare costs. Hodgson27 used a life cycle approach to estimate the lifetime cost of smoking in the US and found contradictory evidence. His results showed that ever smokers incurred higher lifetime medical expenditures than never smokers even after adjusting for never smokers' additional years of life. In the debate over whether to use the ‘gross’ or ‘net’ SAEs, Warner et al21 suggested that the net measure is the logically correct one if the question of interest is how much greater a nation's healthcare expenditures are with smoking compared with the absence of smoking.
It is important that evaluations of public health programmes such as the CTCP consider the impact of the programme over time and capture the impact on mortality or longevity. For example, smoking cessation even late in life has been shown to increase life expectancy.28–30 Excluding this aspect of the programme from an evaluation is implicitly placing a value of 0 on life. Thus the value of lives saved and prolonged must be taken into account, in addition to changes in healthcare expenditures. The objective of this study is to evaluate the long-term net economic impact of the CTCP using models designed to capture both these effects.
Because it is virtually impossible to separate the impact of the tobacco tax increase from the impact of other tobacco control activities undertaken by the CTCP, we consider them together. Four outcome measures are considered: (1) years of life saved, (2) years of treating SRDs averted, (3) net healthcare expenditures saved after adjusting for additional healthcare expenditures for people who live longer due to not smoking and (4) total economic value of net healthcare expenditures saved and years of life saved. The evaluation is conducted on a cohort consisting of all men who resided in California in 1990. Since those who did not take up smoking or who quit smoking due to the CTCP would enjoy health benefits long into the future, we used an evaluation period from 1990 through 2079, the year when the youngest in 1990 would turn age 90.
Methods
Data sources
This study relies on four data sources.
National Academy of Sciences–National Research Council (NAS-NRC) Twin Registry
This is the largest national twin registry in the US. It consists of adult male twins born between 1917 and 1927 both of whom served in the military, mostly during World War II. Two questionnaires were mailed to registry members in 1967–1969 and 1983–1985 to collect information on registrants' smoking habits at the time of survey. The registrants' mortality status was periodically obtained from the computerised records of the US Department of Veterans Affairs (DVA),31 32 which was notified of the death of approximately 98% of World War II veterans by relatives or morticians who sought to claim a burial allowance. The Twin Registry data with mortality status followed-up through November 1999 was used to estimate the dynamic smoking-attributable mortality model. We did not use the cause of death information.
National Medical Expenditure Survey (NMES-2)
This is a national household survey conducted in 1987 which contains detailed data for 34 459 individuals on smoking history, healthcare utilisation and expenditures, reasons for service use (diagnosis), source of payment, health status and history of certain diseases.33 The NMES-2 data were used to estimate the dynamic smoking-attributable morbidity, health status and healthcare expenditures models. We adjusted the expenditures to 1990 dollars using the medical care component of the Consumer Price Index (CPI).35
Tobacco Use Supplement to the Current Population Survey (TUS-CPS)
This is a national survey targeting adults aged 15 and older. It is sponsored by the National Cancer Institute and administered as part of the CPS, the US Census Bureau's continuing labour force survey.34 It contains detailed information cigarette smoking history and other tobacco use. The sampling design allows producing state-specific and national estimates.36 37 The 1992/93, 1995/96, 1998/99 and 2001/02 TUS-CPS data were used to estimate population smoking initiation and cessation rates for California and other states in the evaluation analysis.
California Tobacco Survey (CTS)
This is a telephone survey of California residents that collects information about tobacco use behaviour and tobacco-related beliefs, attitudes and knowledge.38 39 The 1990 CTS Adult File (ages 18+), Youth File (ages 12–17) and the child sample (ages 0–11) from the Screener file were used to construct a cohort of all California male residents aged 0 and older for the evaluation analysis. The study cohort consisted of a weighted total of 14 711 966 males of age 0 and older.
Statistical analysis
Analyses in this study were conducted using several statistical software packages. Mathematica40 was used to derive and estimate the dynamic smoking-attributable mortality model and to predict the four outcome measures. LIMDEP V.8.041 was used to estimate the dynamic smoking-attributable morbidity, health status and healthcare expenditures models. SAS/STAT V.8.242 was used to estimate the population smoking initiation and cessation rates.
Dynamic models of smoking
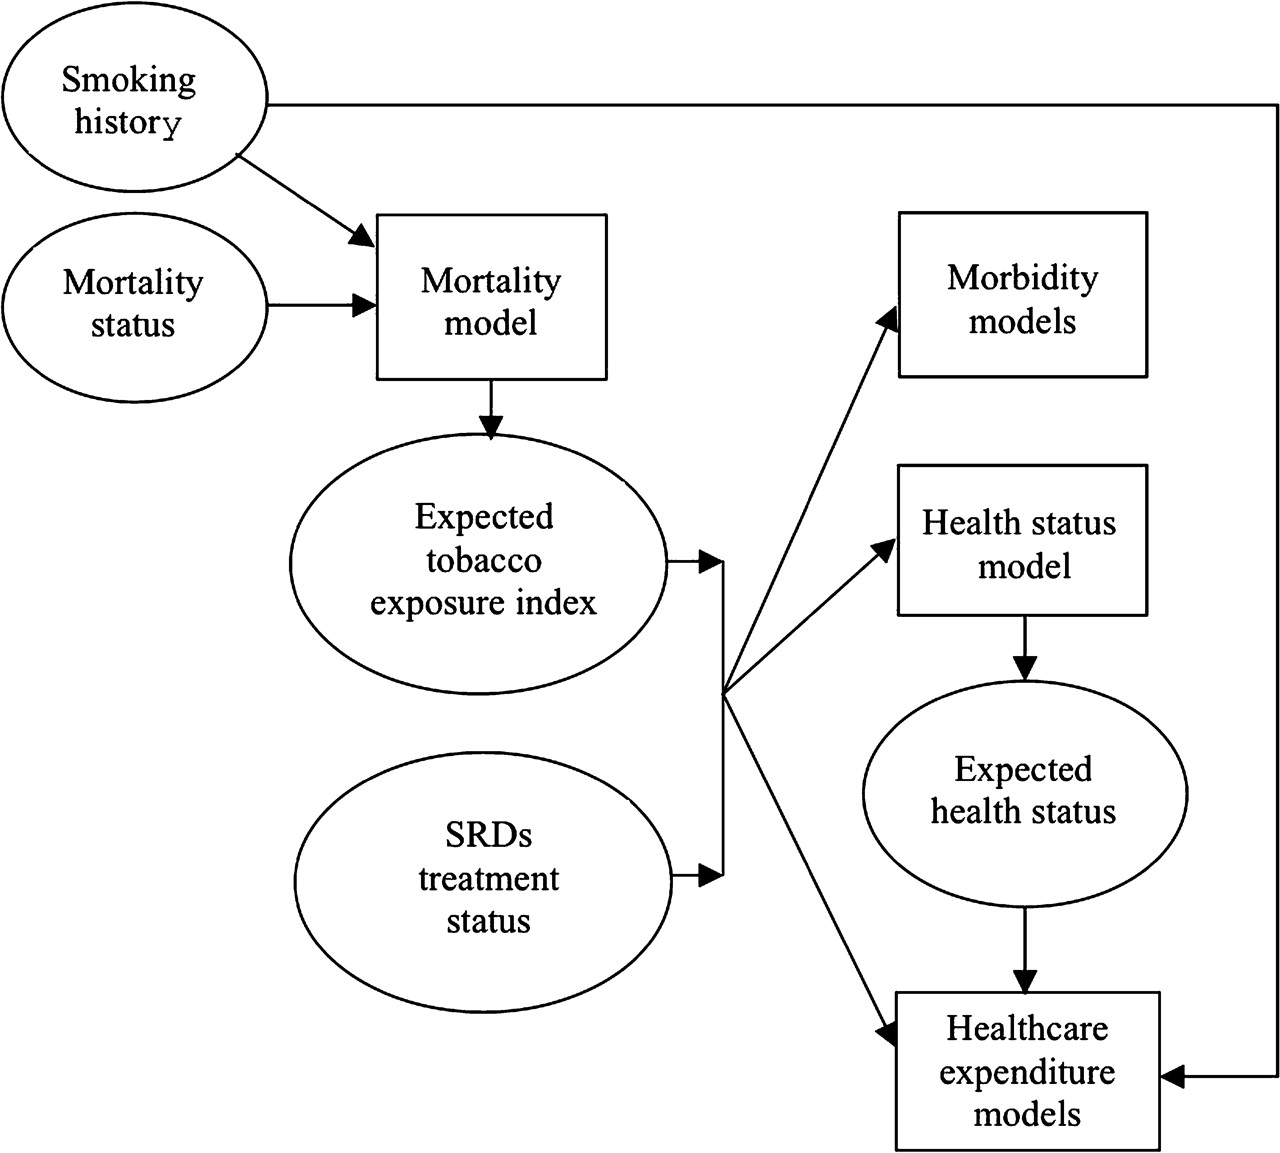
We developed a series of dynamic models to describe the impact of smoking on mortality, morbidity, health status and healthcare expenditures for men aged 40 and older. The lower boundary of age 40 was chosen because most SRDs begin to appear at this age. Figure 1 contains a flowchart showing the estimation process for these models.

Flowchart of the estimation process for the dynamic models of smoking. Mortality model: the input includes two key variables for each respondent, (a) smoking history and (b) mortality status (including the date of death). From the mortality model, the parameters of the expected tobacco exposure index and the hazard rate are estimated. Given these parameters, the expected tobacco exposure index is derived. Morbidity models (including two models, one for high risk smoking-related diseases (SRDs) and another for low risk SRDs): the two key input variables are (a) the expected tobacco exposure index and (b) the SRDs treatment status. Health status model: the input is the same as that for the morbidity models. The output is the expected health status. Healthcare expenditure models (including three models separately for individuals with high risk SRDs, individual with low risk SRDs and individuals without SRDs): the input is the same as that for the morbidity models and for health status model plus two additional variables, (a) expected health status and (b) smoking history.
The smoking-attributable mortality model
This describes the dynamic relationship between an individual's smoking history and his annual probability of death. It is at the core of all the other models because it yields an estimated index for an individual's expected tobacco exposure, given his smoking history (age started smoking, cigarettes smoked per day, age quit). Subsequent morbidity, health status and healthcare expenditures models are all functions of this tobacco exposure index. These models are dynamic in the sense that the tobacco exposure index changes as an individual's smoking behaviour changes over time.
The dynamic smoking-attributable mortality model begins by deriving a theoretical distribution of the tobacco exposure index, which is the solution to a two-equation system of stochastic differential equations describing the body's ability to accumulate and purge tobacco toxins in relationship to smoking behaviour and ageing over time.
The first equation is an instantaneous accounting identity stating that the time rate of change of cumulative tobacco exposure for a current smoker (denoted by subscript c) at time t is equal to the difference between a smoker's momentary intake of tobacco exposure at time t (ie, the product of tobacco dosage per pack, δ, and packs of cigarettes smoked per day, p) and his momentary body purging of tobacco toxin at time t, νc(t). The second equation describes the time rate of change of a current smoker's body purging of tobacco toxin. It is specified as a function of: (1) a constant, which represents the reduction in purge ability due to ageing γ0, (2) the cumulative tobacco exposure, γ1 toxc(t), with the assumption that the body's purging ability declines with more tobacco exposure and (3) an instantaneous white noise term, Wt. To simplify the estimation process, we assume tobacco dosage per pack equals 1 and tobacco exposure at time 0 is 0.
This two-equation system is the same for former smokers except that, in equation 1, the momentary exposure term, δ p, is absent and the initial value of momentary body purging at the time when a former smoker quits has the same expected value as a current smoker with an identical smoking history. This specification implies that the tobacco exposure level accumulated in the body of former smokers would be diminished over time after they quit smoking.
The solution to equations 1 and 2 describes the expressions of the expected value and variance of the tobacco exposure index in the population with the same smoking history.43 Supplementary appendix 1 derives the full theoretical distribution of this exposure index in detail.
The third equation in this analysis is a dynamic normal survival model specified as:
This equation states that the propensity to die by age t, Die*(t), is the sum of the expected propensity to die by age t, g(t), and a normally distributed random error term. The term g(t) is a function of an individual's age and the expressions of his expected tobacco exposure index at age t. Based on equation 3, and the expressions of the expected value and variance of the tobacco exposure index solved from equations 2 and 2, we derived the expressions of the hazard rate. Supplementary appendix 2 contains detailed description for the specification of equation 3 and the hazard rate formulation. We then estimated the parameters of the expected tobacco exposure index and the hazard rates with the maximum likelihood methods using the NAS-NRC Twin Registry data. Supplementary appendix 3 presents the detailed estimated parameters.
The smoking-attributable morbidity model
This includes two equations describing the propensity of being ‘currently treated’ for two groups of SRDs in a year. The first equation is for the group of high relative risk SRDs including lung cancer, laryngeal cancer and chronic obstructive pulmonary disease.44 The second equation is for the group of low relative risk SRDs such as coronary heart disease, stroke and all other SRDs.44 Both equations are specified as a function of individual's age and the expected tobacco exposure index. We estimated the morbidity model with a Probit model45 using the NMES-2 data. See supplementary appendix 3 for the estimated parameters.
The smoking-attributable health status model
This describes the probability distribution of individual's self-reported health status (excellent, good, fair, poor) for individuals who are not currently treated for any SRDs. It is specified as a function of an individual's age and the expected tobacco exposure index. We estimated the health status model with an ordered Probit model using the NMES-2 data. See supplementary appendix 3 for the estimated parameters.
The smoking-attributable healthcare expenditures model
This describes the total healthcare expenditures of an individual in a year, and is estimated using the NMES-2 data for three groups of individuals stratified by disease status. For those currently treated for high relative risk SRDs, an individual's expected total expenditures are estimated as the average total expenditures of all individuals who have the same smoking status in this group. For those currently treated for low relative risk SRDs, an individual's annual total expenditures are modelled as a function of ever smoker status and his expected poor health status. This model was estimated using the ordinary least squares (OLS) method. For those not currently treated for any SRDs, a two-part model46 is used to describe the propensity of having healthcare expenditures (first-part model) and the logarithm of the magnitude of annual expenditures for those with positive expenditures (second-part model). The first-part and second-part models are specified as functions of an individual's age, the expected tobacco exposure index, smoking status and expected poor health status. We estimated the first-part model with a Probit model and the second-part model with the OLS method. See supplementary appendix 3 for the model specification and estimated parameters.
Evaluation of the economic impact of the CTCP
We evaluated the economic impact of the CTCP over the full life of a cohort of all 1990 California male residents obtained from the 1990 CTS data. For each year, we estimated two sets of predictions for each outcome measure. The first set was estimated under the CTCP (the factual situation). The second set was estimated under the assumption that the CTCP did not exist (the counterfactual situation). The effects of the CTCP were measured as the difference between these two sets of predictions.25 Specifically, this evaluation consists of three steps.
Simulate smoking initiation and cessation rates
In order to estimate the two sets of predictions, the population smoking behaviour of the cohort under the factual and counterfactual situations from 1990 to 2079 was simulated. We focused on two measures of smoking behaviour: smoking initiation and successful cessation.
We calculated the yearly smoking initiation and cessation rates during the period of 1981–1999 using the TUS-CPS data. Never smokers were defined as those who answered ‘no’ to the question: ‘Have you smoked at least 100 cigarettes in your entire life?’ Those who answer ‘yes’ were ever smokers. Ever smokers were asked, ‘How old were you when you started smoking cigarettes fairly regularly?’ Ever smokers were also asked whether they currently smoked. If not, they were defined as former smokers and were further asked: ‘About how long has it been since you last smoked cigarettes fairly regularly?’ We adopted previously developed techniques47–52 to calculate yearly smoking initiation rates and cessation rates. First, we reconstructed each respondent's smoking status retrospectively for each year before the year of the survey, from 1981 to 1999. Consistent with another recent study, we assumed respondents' state of residence did not change over time during this reconstruction period.53 Second, we calculated smoking initiation rates for three age groups (11–15, 16–18 and 19–22) separately for California and for all other states by dividing the weighted number of respondents who started smoking in a given year by the weighted number of non-smokers in the beginning of that year. Third, cessation rates were calculated by dividing the weighted number of long-time quitters with at least 6 months of abstinence who quit smoking in a given year by the weighted number of respondents who were current smokers in the beginning of that year. The cessation rates were calculated for four age groups (20–34, 35–44, 45–54 and 55+) for California and all other states. Finally, these crude rates were smoothed using a 3-year moving average.
For each age group, a time series model of California's smoothed initiation (or cessation) rates during 1981–1999 was specified as a function of all other states' smoothed initiation (or cessation) rates, a dummy variable measuring the effect of the CTCP (value of 1 since 1989; 0 otherwise), and a time trend, using a method similar to that employed by Fichtenberg and Glantz.16 By including the rate for all other states in the model, we controlled for changes in the California rate due to national changes in risk factors. The simulated initiation (or cessation) rates under the factual situation were given by the predicted values from this model, and the simulated initiation (or cessation) rates under the counterfactual situation were also given by the predicted values from this model except that the dummy variable for the CTCP was assumed to be 0 in 1989 and later years. After 1999, age-specific factual and counterfactual initiation and cessation rates were assumed to be at their respective 1999 levels.
Simulate mortality, morbidity, health status and healthcare expenditures
The simulated smoking initiation and cessation rates and the estimated parameters from the dynamic models of smoking were applied to the California cohort to simulate their lifetime outcomes under the factual and counterfactual situations. For each year from 1990 to 2079, we began to simulate who dies or survives for individuals aged 40 and older. If an individual survives or is not yet 40 years old, we simulated who takes up or quits smoking and who remains at their previous year's smoking status, and estimated the expected tobacco exposure index. For individuals aged 40 and older who survives, we simulated who is currently treated for high or low relative risk SRDs and who is not, and for those not treated, what each individual's expected health status is. We then predicted each individual's healthcare expenditures. All of these simulations were performed under the factual and counterfactual situations. Supplementary appendix 4 contains details of the design of the simulations.
Estimate the effects of the CTCP on four outcome measures
Given the above simulation results, we used four different algorithms to estimate the effects of the CTCP on four outcome measures: (1) years of life saved, (2) years of treating SRDs averted, (3) net healthcare expenditures saved after adjusting for additional healthcare expenditures for people who live longer due to not smoking and (4) total economic value of net healthcare expenditures saved and years of life saved.
In the first algorithm, an individual is dropped from the factual and the counterfactual simulations when he dies in either simulation. Therefore, this algorithm derives ‘gross’ healthcare savings without considering the impact of potential prolonged years of life due to the CTCP. This is similar to what is assumed in the annual cost of smoking studies of national and state estimates of smoking-attributable expenditures.19 20 44 54 55
In the second algorithm, individuals who die in the factual or counterfactual simulation are still included in the other simulation until they die or reach age 90. Because more individuals live longer due to the health benefit of the CTCP, those additional years of life lead to additional healthcare expenditures. Therefore, this algorithm derives ‘net’ healthcare savings due to the CTCP, analogous to the lifetime cost of smoking studies,25–27 by taking into account the reduced smoking-attributable healthcare expenditures during the years while people are alive and the additional non-smoking-related healthcare expenditures during the prolonged years of life.
The third and fourth algorithms consider the value of lives saved by the CTCP in addition to net healthcare savings. Because premature deaths from smoking usually occur among older people who have relatively low market earnings, we valued years of life using a willingness-to-pay (WTP) approach. While early WTP studies implied the value of life ranging from $3 million to $7 million,56 Sloan et al29 used a conservative value of $100 000 per life year to estimate the economic losses from smoking-related mortality. We adopted $100 000 per year to value the life year in 1990 with adjustments depending on each person's disease treatment and health status: $100 000 for excellent health, $80 000 for good health, $50 000 for fair health and $25 000 for poor health or being treated for SRDs. The only difference between the third and fourth algorithms is the discount rate used to calculate the present value of expected life years saved (see below).
An alternative approach for considering the value of life is to calculate disability adjusted life years (DALYs) or quality adjusted life years (QALYs). While formally calculating DALYs or QALYs was beyond the scope of our study due to the lack of data availability, we have taken into account the dimensions of the quantity and quality of life that DALYs and QALYs capture by assigning different values for a year of life based on disease and health status in our third and fourth algorithms.
Discounting
In all four algorithms, the present value of healthcare expenditures saved by the CTCP was estimated by taking into account discounting as performed in the lifetime costs of smoking literature.27 29 57 58 First, considering the potential growth in future healthcare expenditures, we expressed each person's future stream of annual healthcare expenditures during his expected ‘lifetime’ from age 40 to age 90 by inflating the 1990 value of the predicted healthcare expenditure by 2% per year. The growth rate of 2% is approximately the difference in average annual growth rate between the CPI for medical care and the CPI for all urban consumers during 1990–1999.35 Second, this future stream of predicted expenditures was discounted by the rate of time preference at 3% per year to derive the present value of the lifetime expenditures. For any person, the healthcare expenditures saved by the CTCP equalled the present value of the lifetime expenditures under the counterfactual situation minus the present value of the lifetime expenditures under the factual situation. Total healthcare expenditures saved for all male Californians were obtained by summing savings across individuals, taking into account sampling weights in the 1990 CTS data.
In the third algorithm, we discounted the value of future life years by the rate of time preference using 3% per year.59 In the fourth algorithm, we discounted the value of future life years by discount rates that approximated the differential probabilities of death among individuals of different smoking statuses. As an approximation, we discounted a year of a current smoker's life by 2%, a year of a former smoker's life by 1.5% and a year of a never smoker's life by 1%.
Results
The estimated probability of survival given age and smoking history is illustrated in figure 2. The more exposure to tobacco a person has had, as measured by number of decades smoked (or formerly smoked) and by packs per day smoked, the lower the probability that he will be alive.
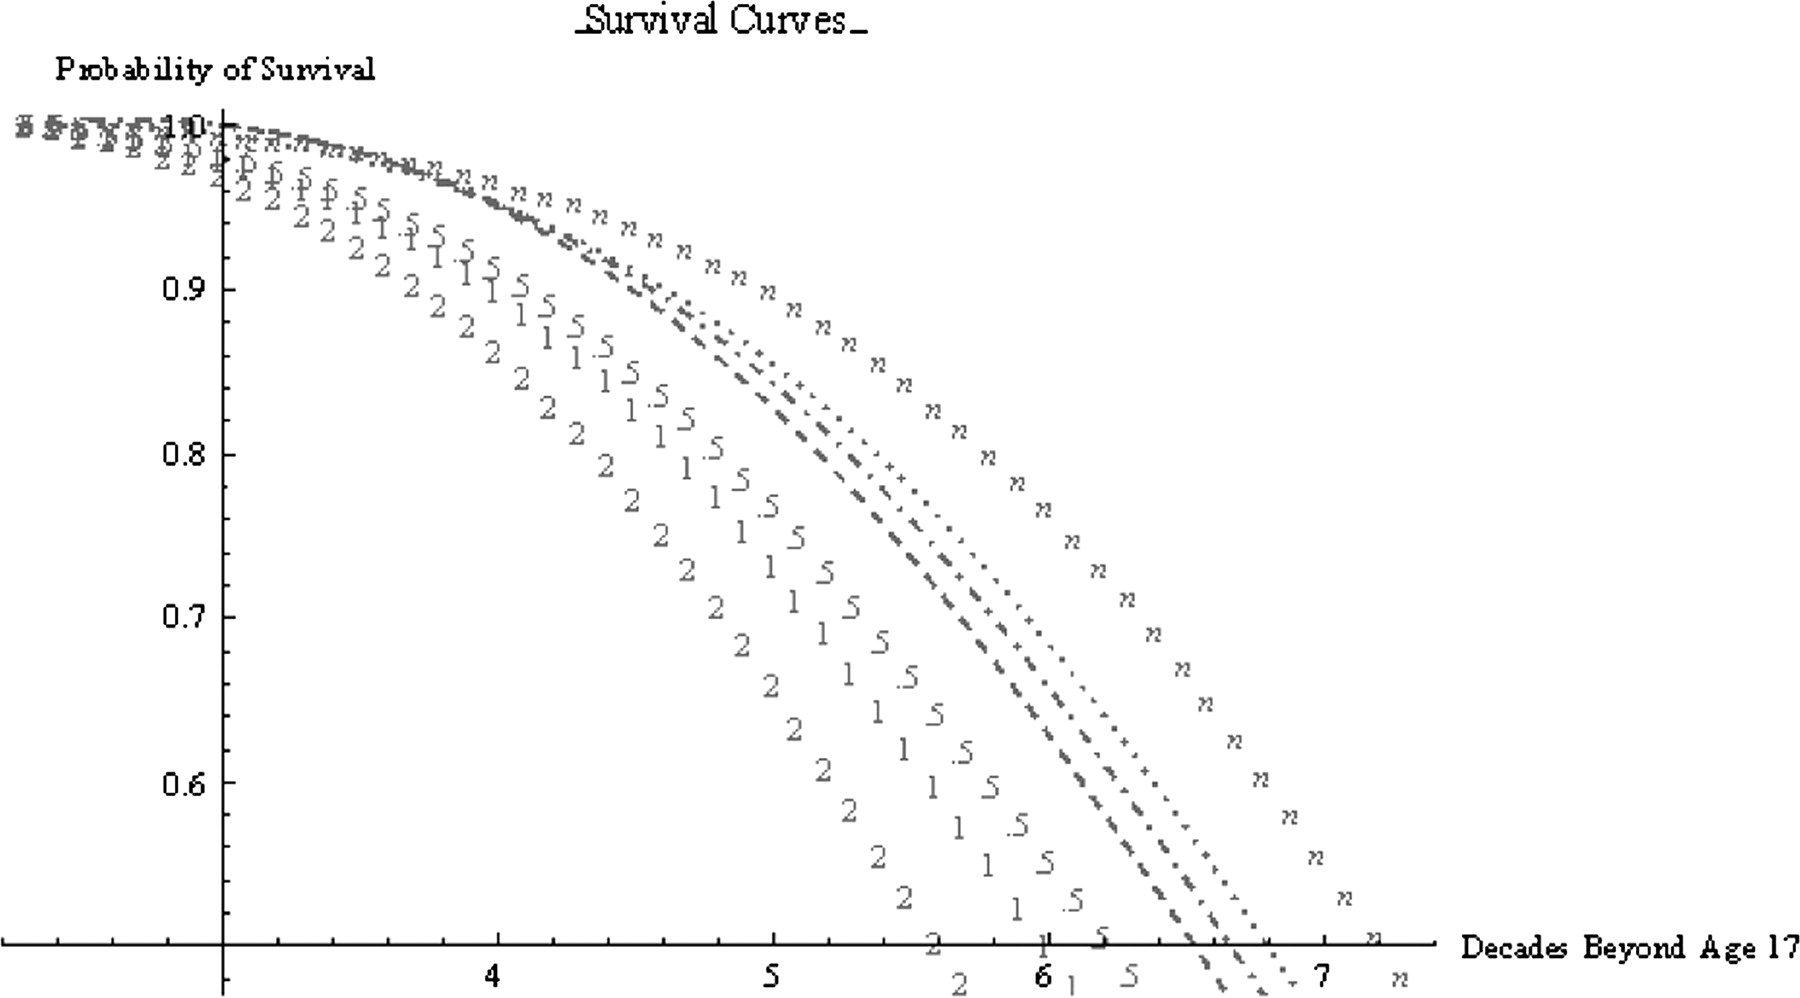
Probability of survival for men with different smoking histories. Seven survival curves denote different smoking histories: n, never smoker; …, former smoker who smoked 1 pack/day for 10 years since age 17 and quit at age 27; ·–·, former smoker who smoked 1 pack/day for 20 years since age 17 and quit at age 37; – –,former smoker who smoked 1 pack/day for 30 years since age 17 and quit at age 47; 5, current smoker who smoked 0.5 pack/day since age 17; 1, current smoker who smoked 1 pack/day since age 17; 2, current smoker who smoked 2 pack/day since age 17. Age 17 was chosen because it is the mean age when male smokers began to smoke.
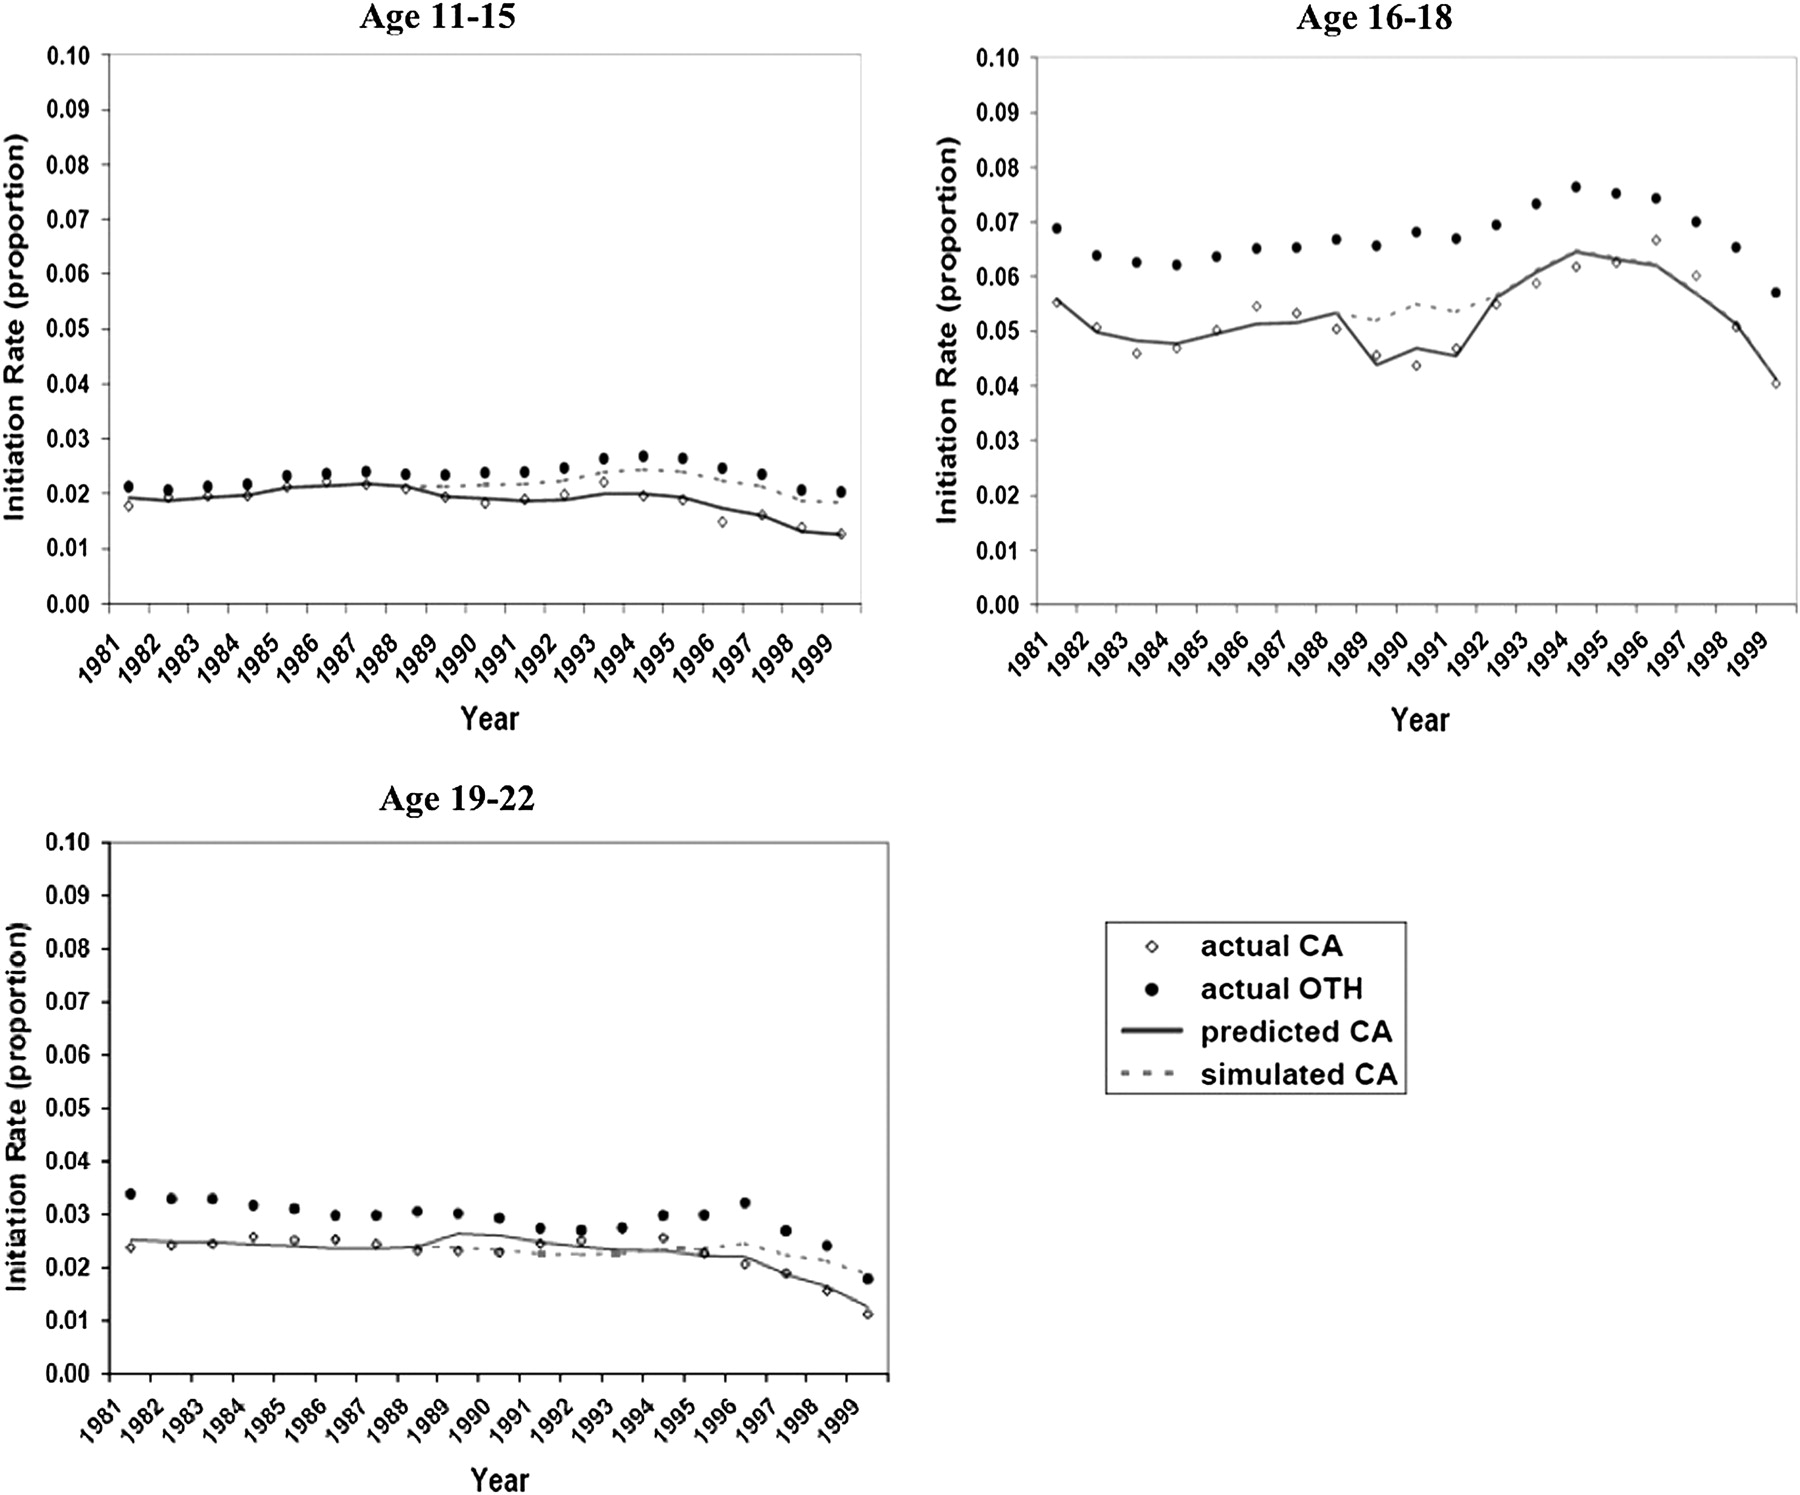
Figure 3 shows the observed, predicted and simulated smoking cessation rates for California males during 1981–1999 for four age groups. The young adult group (20–34) had the highest increase in cessation rates—from about 2% in 1981 to over 5% in 1999—and was most responsive to the CTCP in cessation especially after 1995, as measured by the difference between the predicted cessation rates under the factual situation and the simulated cessation rates under the counterfactual situation. Figure 4 shows the observed, predicted and simulated smoking initiation rates for three age groups. The initiation rates for California males were lower than those for all other states, especially for the group aged 16–18. For the groups aged 11–15 and 19–22, their initiation rates declined noticeably after 1995 and the reduction was related to the implementation of the CTCP.
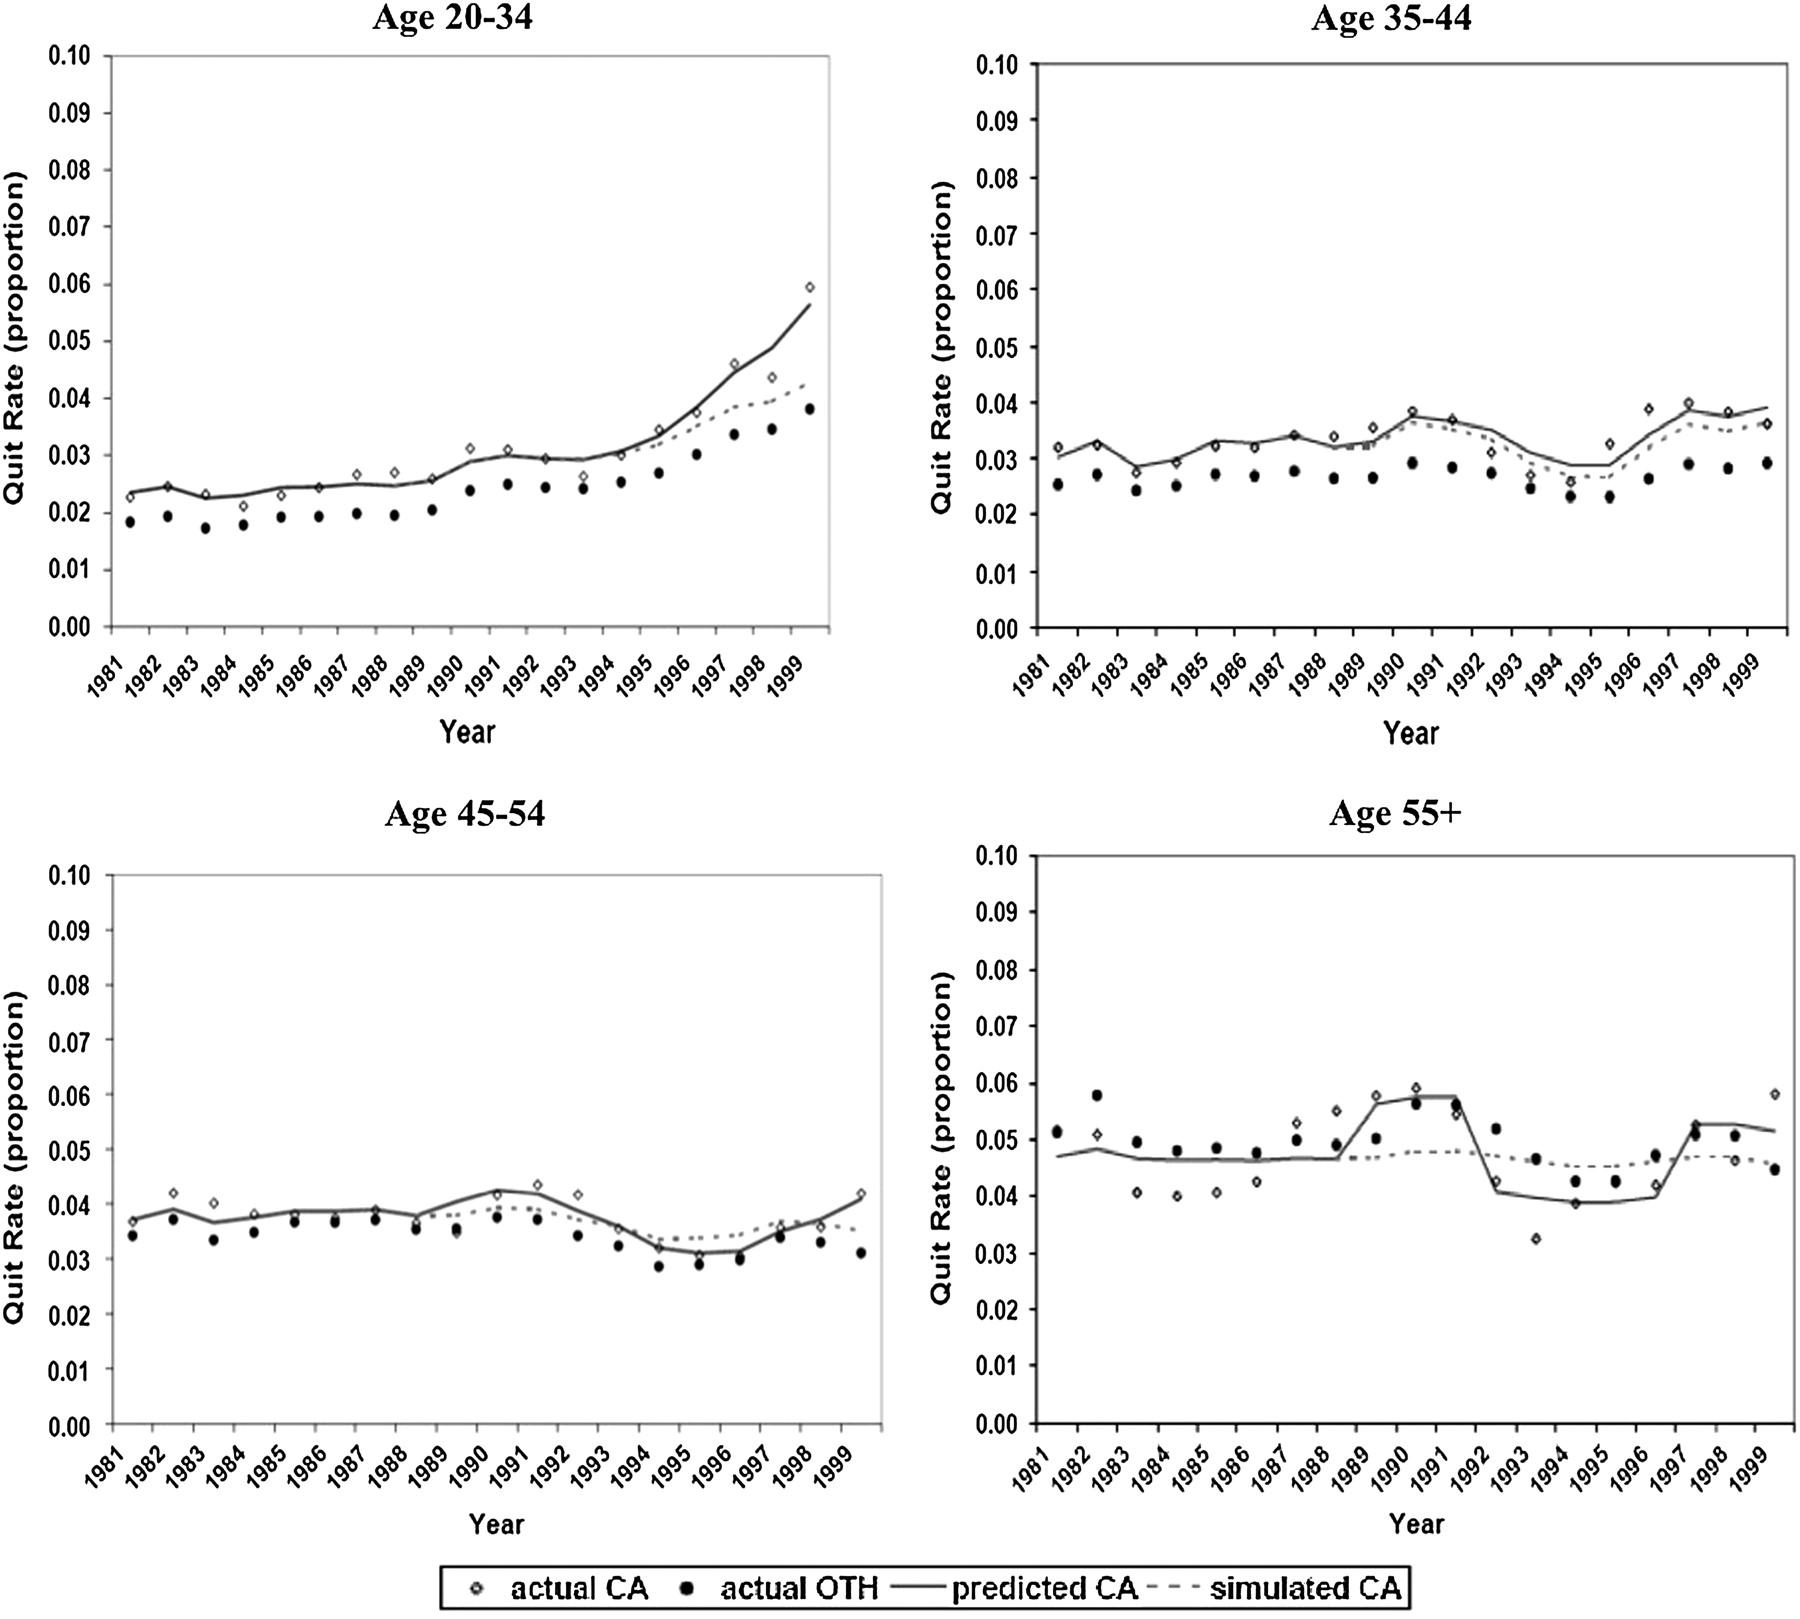
Smoking cessation rates for men in California and all other states by age, 1981–1999. The actual rates (dots) represent the 3-year moving average of the observed cessation rates for California (CA) and all other states (OTH). The predicted CA rates mean the predicted cessation rates from the time series model under the factual situation. The simulated CA rates mean the predicted cessation rates from the time series model under the counterfactual situation.
Smoking initiation rates for men in California and all other states by age, 1981–1999. The actual rates (dots) represent the 3-year moving average of the observed initiation rates for California (CA) and all other states (OTH). The predicted CA rates mean the predicted initiation rates from the time series model under the factual situation. The simulated CA rates mean the predicted initiation rates from the time series model under the counterfactual situation.
Table 1 shows the estimated economic benefits of the California CTCP for the 1990 cohort followed until death. Almost three-quarters of a million person-years of life are saved. In addition, 141 426 person-years of treatment for the high relative risk SRDs and 16 240 person-years of treatment for the low relative risk SRDs are averted.
Estimated economic impact of the California Tobacco Control Program (CTCP) over a 90-year evaluation period from 1990 through 2079
Using our first algorithm, we estimate that the CTCP saved $1.438 billion dollars (in 1990 dollars) in healthcare costs over the period from 1990 through 2079. The estimate is statistically significant at p value <0.05, two-tailed test.
Our second algorithm yields an estimate of ‘net’ healthcare savings from the CTCP, including the additional healthcare expenditures associated with living longer due to the CTCP. The present value of the net savings for healthcare expenditures was estimated as −0.144 billion (in 1990 dollars), but is not statistically significant.
Based on the third and fourth algorithms, we derived two estimates for the total economic value of net healthcare savings and years of life saved due to the CTCP, valuing a year of life at $100 000 with adjustments for individual's disease treatment and health status. From the third algorithm, our estimated present value of the total net healthcare resources saved plus the value of years of life saved was $22.443 billion (in 1990 dollars). From the fourth algorithm, we estimated that the CTCP would generate $107.418 billion (in 1990 dollars) of total savings including net healthcare saving and the value of life saved. Both estimates are statistically significant at p value <0.05, two-tailed test.
Discussion
Our results highlight the importance of developing a comprehensive measure for evaluating the impact of a tobacco control programme that considers the value of healthcare resources used, and also the value of years of life saved and of improved health status associated with not smoking. A comparison of the ‘gross’ healthcare expenditures to the ‘net’ healthcare expenditures shows that when the healthcare costs resulting from longer life are considered, the healthcare savings from the CTCP disappear. However, these approaches ignore the value of having people live longer and healthier. When a value for life is included, the total economic value of the benefits from the CTCP amounts to $22.4 billion in 1990 dollars. This is more than a 15-fold increase over the estimate of the ‘gross’ healthcare savings and a very different result from the ‘net’ healthcare savings, which ignore the value of life. This value is equivalent to $35.5 billion in 2007 dollars (adjusted by the CPI). When an individual's probability of death is used to discount the years of life, the CTCP would generate $107.4 billion in 1990 dollars, a 75-fold increase over the estimate of the ‘gross’ healthcare savings. This value is equivalent to $170.2 billion in 2007 dollars. Given that a key public health outcome is improved health, the value of life saved and improved health should be central to evaluating the destructive effects of smoking, the single most important preventable public health hazard.
During the first decade of the programme, the CTCP spent about $1.2 billion dollars (A Roeseler, California Department of Public Health, California Tobacco Control Program, personal communication, 2005). This is dwarfed by the total economic value of the net healthcare savings, lives saved and health improved due to the programme. However, it must be noted that our estimates result from the combined effect of the tobacco tax increase and other components of the CTCP including the statewide media campaigns, community-based interventions and school-based prevention programmes.
There are several limitations to this study. First, women were not included in the analysis because longitudinal data on female mortality and smoking were unavailable. However, we postulate that the economic effects of the CTCP for women would be on the order of two-thirds the size of the effects for men because the smoking prevalence rate for women was approximately 69% of the rate for men in California.19 Thus, the total economic value of the CTCP including men and women may be considerably larger than our estimates. Further research is needed to include women in the evaluation so that a fuller understanding of the importance of tobacco control programmes can be obtained. Second, for the period from 2000 to 2079, we assumed that smoking initiation and cessation rates remain at their 1999 levels. For these rates to remain constant beyond 1999, tobacco control efforts must be sustainable. Future research could explore how the economic impact of the CTCP is sensitive to post 1999 smoking rates. Third, in the analyses of yearly smoking initiation rates and cessation rates, we assumed the state of residence for the respondents of the TUS-CPS data was unchanged. A recent study which compared the cessation rates between California and a group of comparison states pointed out that a large movement of former smokers from California to other states during the study period would artificially inflate the estimated cessation rate in other states, and vice versa.53 Further research is needed to explore the smoking population's movement between states so as to determine the direction of potential bias due to such assumption. Fourth, the simple specification of a single dummy variable for the CTCP in the smoking initiation and cessation equations implies that the effect of the programme was constant over time. However, it has been reported that the impact of the CTCP on smoking prevalence rates was stronger during the early 1990s than during the late 1990s, implying that the impact of the CTCP on smoking initiation and cessation rates might not be constant over time.8 Nevertheless, even with this limitation, our results are in general consistent with the findings from a study by Messer and Pierce et al53 which showed that from 1980 to 1999, cessation rates increased most for the young (age 20–34), and this age group also showed the greatest difference between California and the comparison states. Finally, we did not include any impact of the CTCP on secondhand smoke exposure, though data have shown a substantial decrease in exposure over time.
Tobacco control programmes are costly. However, the benefits of the programmes are substantial and continue to accrue for many years. Although those who are persuaded not to smoke will live longer, have better health status and require additional healthcare resources during their additional years of life, this impact is outweighed by the value of additional years of life and better health. Public health programmes need to be evaluated with healthcare costs, additional years of life and improved health considered as important outcomes.
What this paper adds
This paper develops a series of dynamic models of smoking behavior and consequences that analyze the impact of smoking initiation and cessation on morbidity, mortality, health status, and healthcare expenditures over the lifetime of Californians.
The models are used to evaluate the impact of the first decade of the California Tobacco Control Program on males.
The findings indicate that when the value of increased longevity is included, the program saved $22–$107 billion, depending on how life is valued.
References
Supplementary materials
Web only appendix
Files in this Data Supplement:
Footnotes
Funding This research was funded by the California Tobacco-Related Disease Research Program under grant 9RT-0157. The grant was awarded competitively and the funding agency was not involved in any aspect of the research.
Competing interests None.
Provenance and peer review Not commissioned; externally peer reviewed.