Article Text

Abstract
Significance The wide availability of sweet flavours has been hypothesised as a factor in the popularity of electronic cigarette (ECIG), especially among youth. Saccharides, which are commonly used to impart a sweet flavour to ECIG liquids, thermally degrade to produce toxic compounds, like aldehydes and furans. This study investigates the formation of furanic compounds in aerosols when ECIG liquid solutions of varying sweetener concentrations are vaped under different power and puff duration.
Methods Liquids are prepared by mixing aqueous sucrose, glucose or sorbitol solutions to a 70/30 propylene glycol/glycerin solution. Aerosols are generated and trapped on filter pads using a commercially available ECIG operating at 4.3 and 10.8 W and 4 and 8 s puff duration. Extraction, elimination of matrix interference and quantification are achieved using novel solid phase extraction and gas chromatography tandem mass spectrometry methods (GC-MS).
Results Well-resolved GC peaks of 5-hydroxymethylfurfural (HMF) and furfural (FA) are detected. Both HMF and FA are quantified in the aerosols of sweet-flavoured e-liquids under various vaping conditions. Levels of furan emissions are significantly correlated with electric power and sweetener concentration and not with puff duration. Unlike saccharides, the formation of HMF and FA from a sugar alcohol is negligible.
Conclusions The addition of sweeteners to ECIG liquids exposes ECIG user to furans, a toxic class of compounds. Under certain conditions, the per-puff yield of HMF and FA in ECIG emissions is comparable to values reported for combustible cigarettes.
- Prevention
- Toxicology
- Smoking topography
- Electronic nicotine delivery devices
- Carcinogens
Statistics from Altmetric.com
Introduction
Electronic cigarette (ECIG) use has rapidly become a global epidemic.1–4 Between 2013 and 2014, ECIG use has tripled among middle and high school students and surpassed current use of tobacco products.5–7 Besides the wide availability,8–10 media advertisements11 ,12 and social acceptability, the high prevalence of ECIG use among youth has been attributed to the wide variety of available flavours.13 ,14
The ECIG basic design consists of a battery, electrical heating coil and e-liquid reservoir.15 ECIGs vapourise a liquid composed of varying ratios of propylene glycol (PG), glycerin (VG), water, nicotine (0–48 mg/mL) and additives, including flavourants.16 The efficacy of ECIG nicotine delivery has evolved with design and user behaviour over the years.17 ,18 Along with nicotine, e-liquids can be contaminated with nitrosamines, volatile organic compounds or metals leached from the different metallic components.19 ,20 Other toxicants, which are generated from the thermal degradation of the heated liquid,21 are referred to as ‘vaping toxicants’. One group of vaping toxicants is reactive oxygen species that are generated from the cleavage of chemical bonds.22 Another group is carbonyls which may be the most studied toxicants in ECIG vapours after nicotine.23 Studies have reported widely varying carbonyl yields,24 with some exceeding those reported for combustible cigarettes.25 Produced carbonyls in ECIG aerosol was anticipated from the investigation of PG and VG pyrolysis in food chemistry and biomass fuel generation.26 ,27 Flavourants may present another potent source of ‘vaping toxicants’.28
In the ECIG market, there are more than 7000 different liquid flavours.29–31 Whether flavours enhance ECIG appeal to smokers and thereby reduce overall consumption of combustible cigarettes,32–34 or serve to initiate nicotine-naïve individuals and thereby increase overall use of combustible products35–38 remains a controversial topic. In 2009, the US Food and Drug Administration (FDA) banned tobacco cigarettes with characterising flavours because of their appeal to youth.
Several studies have reported toxicant emissions from flavoured ECIGs.28 ,39 ,40 Flavourants may be grouped into a number of categories, one of which catalogues six common groups: tobacco, menthol, fruits, beverages, sweet flavours and others.28 The ‘sweet’ category, which is popular among ECIG users,7 lists sugar, caramel and honey as advertised ingredients.41 The thermal degradation of sugars has been reported to yield toxic furans including 5-hydroxymethylfurfural (HMF) and furfural (FA).42 ,43 FA causes irritation to the upper respiratory tract in humans,44 and both FA and HMF show tumourigenic activity in mice.45–47
In this study, we examined whether vaping laboratory-prepared sucrose, glucose and sorbitol containing e-liquid solutions can produce significant levels of HMF and FA. To do so, a novel analytical clean-up procedure gas chromatography tandem mass spectrometry (GC-MS) method was developed and optimised. Using this method, the influence of puff duration, power and sugar concentration on the yield of these toxicants was evaluated.
Materials and methods
Liquids with various concentrations of sucrose, glucose or sorbitol were prepared in a 70/30 PG/VG ratio, and vaped under variable ECIG electrical power and puff duration. The analysis of HMF and FA in aerosols by GC-MS necessitated the optimisation of a new extraction procedure to separate furans from PG and VG using solid phase extraction (SPE).
Materials
SPE cartridges (1000 mg/6 mL Hypersep si) and quartz filters (Advantec, QR-100, 47 mm) were procured from Thermo Fisher Scientific and Whatman International, respectively. High-performance liquid chromatography-grade ethyl acetate, hexane, chloroform and acetonitrile, PG (99.5%), VG (99–101%), and HMF analytical standard were obtained from Sigma Aldrich. FA and internal standard (5-chloro-2-furfural) were obtained from Absolute Standards. Glucose, sorbitol and sucrose were food grade products provided by the Faculty of Agricultural and Food Sciences at the American University of Beirut (AUB).
Liquid preparation
E-liquid of 70/30 PG/VG ratio was used because it is commonly found in ECIG products. Stock solutions of sucrose, glucose and sorbitol in distilled water were prepared with 345, 442 and 243 (mg/mL) concentrations, respectively. Subsequently, 0.5 mL of each stock solution was added to 10 mL of the PG/VG mixture. The percentage of sugar in the prepared liquids (1.01–1.91 wt% equivalent to 11–21 mg/mL) was chosen to be in the range of commercially reported concentrations (1–4 wt%).28 Four concentrations of 0.03, 0.25, 0.63, 1.23 wt% were prepared and sonicated for 2 hours to ensure homogeneity.
Aerosol generation and sampling
Aerosols were generated from a custom-designed digital puff production machine at AUB48 using the commercial brand VaporFi PLATINUM II Tank (VP).49 This model was selected because it represents a common ‘tank’ system in which liquid is conducted from the reservoir via a short wick to the heating coil.
Aerosols were generated at 4.3 and 10.8 W, representing a typical and higher than average power input (operating ranges of 3–15 W are common).50 In addition to power, the effects of two puff durations (4 or 8 s) and sucrose concentrations were assessed. Electrical resistances of the ECIG atomisers, which were measured before and after each use, were 2.3±0.11 Ω.
Aerosols were generated at a constant puff velocity of 1 L/min and an inter puff interval of 10 s. Produced aerosols were drawn from the mouth end of the ECIG device, and collected through a quartz fiber filter.
Study design
Variables included power input (4.3 vs 10.8 W), puff duration (4 vs 8 s), sugar (sorbitol, glucose and sucrose) and sucrose concentration (0, 0.03, 0.25, 0.63, 1.23 wt%). To control for potential interactions with ECIG age and manufacturing variability, three devices of the same make and model were used, and the experimental condition orders randomised. Results of three atomisers were averaged for any given experimental condition.
Analytical procedure
Filter extraction
The quartz filter loaded with ECIG aerosols is transferred to a glass vial (4 mL) and subsequently extracted with 2 mL of ethyl acetate after 30 min sonication. The filter is removed and the extract is concentrated at room temperature under nitrogen flow (5 L/min) to 0.5 mL.
SPE clean-up operating procedure
The clean-up method is optimised using standard solutions of HMF and FA prepared in PG/VG matrix of 70/30 ratio. SPE is conditioned using 10 mL hexane, the concentrated sample is loaded and the elution solvent is optimised (chloroform/acetonitrile: 8.5/1.5 mL) to retain PG and VG while eluting HMF and FA at high recovery. The eluted solution is concentrated down to 0.5 mL under nitrogen flow. The sample is spiked with 5-chloro-2-furfural (4 µg/mL) as internal standard (IS) before injection to GC-MS.
Quality control and quality assurance
The repeatability of the method is evaluated by carrying out six replicate extractions of 5, 40 and 120 µg/mL. The maximum %relative standard deviation (RSD) is 15% and 3% for HMF and FA, respectively. The recovery of the method at 5 and 40 µg/mL is 90% for HMF and 60% for FA. Limits of detection and quantification, which are assessed using seven replicates, are 0.05 µg/mL for HMF and 0.2 µg/mL for FA and 0.1 µg/mL for HMF and 0.7 µg/mL for FA, respectively. The quantitative analysis is carried out using an extracted calibration curve with a linear range of 0.1–100 µg/mL for HMF and 0.8–20 µg/mL for FA. The corresponding regression coefficients are higher than 0.995.
GC-MS conditions
The GC-MS analysis is achieved on a Thermo-Finnigan Trace GC-Ultra Polaris ITQ 900 coupled with an AS 3000 II autosampler. A separation TraceGOLD-5MS (TG-5MS) column (60 m×0.25 mm, 0.25 μm film thickness) and electron impact ionisation with nominal electron energy of 70 eV are used. The mobile phase is helium gas of 99.999% purity with a 1 mL/min flow rate. The mode of injection is splitless. The injector temperature is set at 200°C. The initial temperature was 40°C, hold for 1 min, ramping at 30°C/min to 80°C, at 15°C/min to 150°C and then at 20°C/min to 220°C. The quantitative analysis is performed using selected ion mass (m/z=97, 96 and 129 for HMF, FA and IS, respectively).
Statistical analysis
The effect of the power, puff duration and sweetener concentration on HMF and FA yields was assessed by a two-tailed distribution and heteroscedastic t-test.
Results
Both HMF and FA were reliably detected in the generated aerosols. Figures 1 and 2 show the average levels of HMF and FA per mg of total particulate matter (TPM). FA yields were considerably lower than HMF under all conditions. Prior to vaping, all liquids showed no detectable quantities of furans. Battery power output revealed a significant effect on the TPM normalised yields of HMF generated from sucrose (p<0.01) and glucose (p<0.02). In particular, 4.3 W generated higher HMF concentrations than 10.8 W. FA concentrations appear to show an opposite trend, with greater power resulting in larger yields; however, the large variances in repeated measures rendered the differences statistically insignificant, except for the glucose condition with an 8 s puff duration.
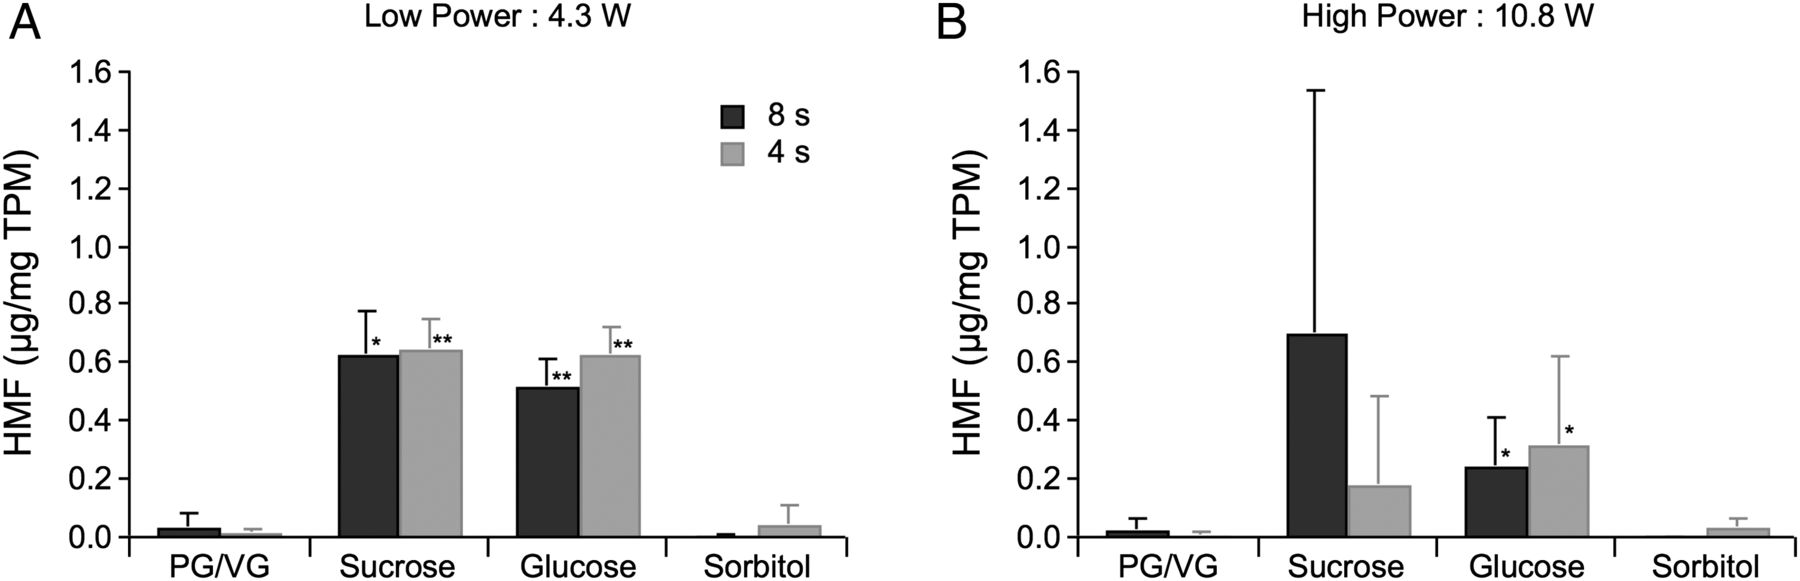
Average HMF yield normalised by TPM (µg/mg) in aerosols generated from laboratory-prepared sucrose, glucose and sorbitol liquids vaped at 4.3 W (A) and 10.8 W (B) and at 8 and 4 s. * and ** indicate significant difference from the unflavoured liquid at p<0.05 and p<0.01, respectively. N=3 measurements for each condition. FA, furfural; HMF, 5-hydroxymethylfurfural; PG, propylene glycol; TPM, total particulate matter; VG, glycerin.

Average FA yield normalised by TPM (µg/mg) in aerosols generated using sucrose, glucose and sorbitol-containing liquids vaped at 4.3 W (A) and 10.8 W (B). * indicates significant difference from the unflavoured liquid at p<0.05. N=3 measurements for each condition. FA, furfural; HMF, 5-hydroxymethylfurfural; PG, propylene glycol; TPM, total particulate matter; VG, glycerin.
Relative to the unflavoured conditions, the sucrose and glucose conditions generally had greater HMF and FA concentrations, while the sorbitol conditions showed similar results. At 4.3 W (figure 1A), these differences in HMF of sucrose and glucose were significant, while those for the sorbitol condition were not. Similar trends were observed at 10.8 W (figure 1B); however, HMF yields for the sucrose condition were not significantly different from the unflavoured condition due to the large variance in repeated measures. In a similar comparison, sorbitol produced no significant change in FA (figure 2), while the sucrose and glucose conditions appear to have greater yields. Only the 8 s puff duration and 10.8 W glucose condition demonstrated a statistically significant difference. Unlike power, puff durations have generated similar levels of furans. Furthermore, both HMF and FA aerosol show a significant correlation with sucrose concentration at both puff durations (p<0.01 and p<0.001 at 4 s, and p<0.01 and p<0.001 at 8 s for HMF and FA, respectively; figure 3).

Average level (µg/mg) of HMF (A) and FA (B) in the aerosol generated from different concentrations of sucrose in the e-liquid (n=3 per condition). FA, furfural; HMF, 5-hydroxymethylfurfural.
To validate the method on a commercial ECIG matrix, a flavoured Vapor Fi was selected and spiked with a known concentration of sucrose (13 mg/mL, equivalent to 1.23%). Three replicate solutions were vaped at 5.0 W during a 4 s puff duration. Aerosols average concentrations (ng/mg) of HMF (4.26±1.15) and FA (191.47±62.55) were comparable to what is reported for the standard solutions. Chromatograms of the spiked commercial e-liquid show no interferences preventing the detection and quantification of furan compounds.
Discussion
The thermal decomposition of saccharide molecules such as sucrose, glucose and fructose has been under intense focus for its wide application in food51–53 and as an alternate renewable energy source.54–56 Hence, many studies have reported HMF as a product of the caramelisation process57–60 and both HMF and FA as thermal decomposition products under different type of catalysts, temperature and pressure.61–67 Owing to the high functionalisation of sugar molecules, the decomposition mechanism is thought to involve many side reactions,68–70 with HMF being thermally generated from sucrose through the formation of fructofuranosyl cation and from glucose through the cyclisation of 3-deoxyglucosone intermediates. FA is formed via an additional dehydration product from the thermal decomposition of sugar molecules as shown in figure 4.71–74

A plausible pathway for the saccharide dehydration.
In ECIG systems, the presence of sucrose in some sweet commercial brands has been reported.75 Our results show that HMF and FA are formed when sucrose and glucose-containing liquids are vaped. Minimal amounts, however, are produced with sorbitol-containing liquids. Interestingly, lower battery power led to higher HMF concentrations but lower FA concentrations. This finding complicates the commonly held notion that lower power output leads to lower heating filament temperatures and, therefore, lower emissions of toxicants, which are formed by thermal degradation, such as volatile aldehydes.24 ,48
Variances in repeated measures of HMF and FA were far greater at higher power conditions. Such variability may have been induced by the occurrence of hot spots on the heating element where contact with the liquid-supplying wick was poor. These variations are comparable to those previously observed with aldehydes in ECIG aerosols.21 ,76–79
HMF and FA yields were also dependent on the initial sucrose concentration. However, the non-linear correlation between sucrose and the furan products (HMF and FA) indicates that the mechanism of formation of furans is complex.80 So, in addition to the initial sucrose concentration, the degradation of sugar might be influenced by factors like the condition of the coil, the maximum temperature reached during its activation and the multistep mechanism of furan formation.
Considering the full range of the aerosol furan content independent of the power, the puff duration, and the sugar type and concentration (see online supplementary table S1), the exposure level per puff of ECIG was compared with the aerosol levels in tobacco cigarette and water pipe smoke (WPS) as shown in table 1. It is found that ECIG users are exposed to HMF and FA levels similar to the ones reported for a combustible cigarette and to the lower limits of water pipe smoke. Exposure to HMF and FA raises several health concerns. The potential mutagenic activity of HMF is attributed to one of its major toxin metabolites known as 5-sulfoxymethylfurfural.46 ,47 As for FA, clear evidence for carcinogenic activity and histopathological changes in the respiratory epithelium of mice have been reported.45 ,44
The range of HMF and FA aerosol concentrations per puff in ECIG, tobacco cigarette and water pipe
supplementary table
Aerosol levels of furans at different power, puff duration and sugar type and concentrations expressed in μg/puff
Results indicate that potential toxicants are produced at concentrations lower than 0.26%, and therefore limits on the type and content of sweet flavourants can be recommended. In addition, increased emission in relation to power and puff duration calls for stringent regulations on the ECIG design.
Conclusion
This study focuses on developing an analytical method to isolate furans from the PG/VG matrix and assessing the emission of toxic furans from sweet-flavoured ECIG solutions. Vaped under different conditions, the levels of furans are found to be significantly different from the PG/VG base solutions and are correlated with battery power output and sugar concentration. Surprisingly, no significant difference in yields was observed between the 4 and 8 s puff durations. Per-puff emissions of HMF and FA from ECIGs using sweetened solutions were comparable to those found in cigarette and water pipe smoke, suggesting that sugar-based additives in ECIG solutions be regulated.
What this paper adds
The market of electronic cigarette has globally exploded with the introduction of a wide range of flavourants. This comes at a time when regulations and potential risk studies are still scarce. This paper assessed the production of furans from sweetened e-liquids. A systematic approach is taken to study the effect of power, puff duration and sweetener type and percentage on the yield of furans. A novel clean-up procedure is developed followed by quantification via a new gas chromatography tandem mass spectrometry method.
References
Footnotes
Funding Research reported in this publication was supported by the National Institute on Drug Abuse of the National Institutes of Health under Award Number P50DA036105 and the Center for Tobacco Products of the US Food and Drug Administration.
Disclaimer The content is solely the responsibility of the authors and does not necessarily represent the official views of the National Institutes of Health or the Food and Drug Administration.
Competing interests None declared.
Provenance and peer review Not commissioned; externally peer reviewed.