Article Text

Abstract
Background Tobacco use is still highly prevalent in Europe, despite the tobacco control efforts made by the governments. The development of tobacco control policies varies substantially across countries. The Tobacco Control Scale (TCS) was introduced to quantify the implementation of tobacco control policies across European countries
Objective To assess the midterm association of tobacco control policies on smoking prevalence and quit ratios among 27 European Union (EU) Member States (EU27).
Methods Ecological study. We used the TCS in EU27 in 2007 and the prevalence of tobacco and quit ratios data from the Eurobarometer survey (2006 (n=27 585) and 2014 (n=26 793)). We analysed the relationship between the TCS scores and smoking prevalence and quit ratios and their relative changes (between 2006 and 2014) by means of scatter plots and multiple linear regression models.
Results In EU27, countries with higher scores in the TCS, which indicates higher tobacco control efforts, have lower prevalence of smokers, higher quit ratios and higher relative decreases in their prevalence rates of smokers over the last decade. The correlation between TCS scores and smoking prevalence (rsp=–0.444; P=0.02) and between the relative changes in smoking prevalence (rsp=–0.415; P=0.03) was negative. A positive correlation was observed between TCS scores and quit ratios (rsp=0.373; P=0.06). The percentage of smoking prevalence explained by all TCS components was 28.9%.
Conclusion EU27 should continue implementing comprehensive tobacco control policies as they are key for reducing the prevalence of smoking and an increase tobacco cessation rates in their population.
- public policy
- surveillance and monitoring
- advertising and promotion
- packaging and labelling
- price
This is an open access article distributed in accordance with the Creative Commons Attribution Non Commercial (CC BY-NC 4.0) license, which permits others to distribute, remix, adapt, build upon this work non-commercially, and license their derivative works on different terms, provided the original work is properly cited and the use is non-commercial. See: http://creativecommons.org/licenses/by-nc/4.0/
Statistics from Altmetric.com
Introduction
Tobacco remains the largest preventable health hazard in European Union (EU), and it is responsible for 700 000 deaths a year.1 Europe, despite the decline of tobacco smoking prevalence over the past decades,2 has one of the highest smoking prevalence among adults (28%).3 Comprehensive tobacco control policies have shown to have an impact on reducing smoking prevalence.4–6
The EU as a whole and its Member States (MS) individually have all ratified the WHO Framework Convention on Tobacco Control (WHO FCTC).7 Subsequently, most of them have accordingly implemented the recommended key tobacco control policies8 but with considerable differences across EU MS.9 10 Thus, a variation in the extent to which smoking prevalence is decreasing in EU MS could be an indicator of commitment to tobacco control at the national level.10
Six cost-effective measures should be prioritised in comprehensive tobacco control programmes5 including taxes, smoke-free laws, public information, advertising bans, direct health warnings and access to treatment.11 Increasing taxation on tobacco products is the most effective measure12; however, the evidence suggests that the best result is achieved when a comprehensive tobacco control policy is implemented.5 In a recent global study of 126 countries, analysing WHO data from 126 countries, the number of key demand-reduction WHO FCTC policies (MPOWER policies) implemented at the highest level was strongly associated with reductions in smoking prevalence from 2005 to 2015, the first decade of the treaty. Thus, there is promising evidence on the power of tobacco control policies to reduce smoking prevalence.13 Similar results were found by Ngo et al,14 who examined the relationship between MPOWER scores and smoking prevalence changes reported by Euromonitor from 2007 to 2014.
This article assesses the relationship between the strength of key tobacco control policies and reductions in smoking prevalence using a different method, focusing specifically on that relationship across the EU MS. The Tobacco Control Scale (TCS), developed by Joossens and Raw to systematically monitor the implementation of tobacco control policies at country-level across Europe, has been used to chart overall progress in national-level tobacco control.15 16 Previous studies in Europe have associated the implementation of tobacco control policies with attitudes towards smoke-free legislations, smoking behaviours and involuntary exposure to secondhand smoke.8 17 18 Those studies, however, did not examine the relationship between country-level tobacco control policies and the smoking prevalence and quit ratios considering adequate time-lag or the impact of the policies in the change of prevalence or quit ratios. Therefore, the objective of the present study was to evaluate the association between the implementation of tobacco control policies and smoking prevalence and quit ratios in 27 EU MS over time (2006–2014).
Methods
This is an ecological study with the EU MS as the unit of analysis. We used data from tobacco control activities, measured by the TCS proposed by Joossens and Raw.5 We used data from the 27 EU MS included in the 2007 TCS report (all current EU MS, except Croatia).19 The TCS provides a score for each country based on their national-level implementation of tobacco control policies according to the six most cost-effective policies.20 Smoking status information was obtained from waves 66.2 and 82.4 of the Eurobarometer survey from 2006 and 2014, respectively.21 22 The Eurobarometer is a cross-sectional study of a representative sample of the adult population (≥15 years old) conducted by the European Commission in all the EU. The fieldwork was conducted in October–November 2006 and in November–December 2014 and included 27 584 and 26 793 respondents, respectively. The final samples were representative of the population aged 15 years and above in each country (about 1000 persons in each country except for Cyprus, Luxembourg and Malta, with approximately 500 respondents). The sample was weighted for sociodemographic variables. The Eurobarometer sampling methods and sampling size are consistent in all EU countries and in the different waves used ensuring that tobacco smoking indicators estimates do not differ between countries or years.23
Variables
Tobacco consumption
Smoking prevalence in 2014 was obtained from adult respondents answering ‘I currently smoke’ to the question ‘Regarding smoking cigarettes, cigarillos, cigars or a pipe which of the following applies to you?’ in wave 82.4.1 Smoking prevalence in 2006 was obtained from the proportion of respondents who gave any of the answers ‘You smoke packed cigarettes’, ‘You smoke roll-up cigarettes’ or ‘You smoke cigars or a pipe’ to the question ‘Which of the following applies to you?’ in wave 66.2.24
Tobacco cessation
Quit ratios were calculated as the ratio of former smokers divided by the number of ever-smokers (current and former smokers). Former smokers were respondents answering ‘I used to smoke but now I have stopped’ to the question ‘Regarding smoking cigarettes, cigars, cigarillos or a pipe, which of the following answers applies to you?’ Total ever-smokers were former smokers and respondents answering ‘I currently smoke’ at the preceding question from the Eurobarometer.
Tobacco control policies
TCS scores were used to assess the national-level implementation of tobacco control policies, using a scoring system developed by a panel of experts. The scale was developed by means of a questionnaire sent to European Network for Smoking and Tobacco Prevention correspondents in the participant EU MS. Hence, the six components of the TCS and their corresponding score are: price (30 points), public place bans (22 points), public information campaigns spending (15 points), advertising bans (13 points), health warnings (10 points) and treatment (10 points). This score increases with the strength of tobacco control policies up to a possible maximum of 100 points, indicating a full implementation for all strategies considered. The score of each of the six cost-effective policies was weighted by its reported effectiveness, judged by scientific evidence on tobacco control.5 20
To eliminate missing values in public information campaign spending, we used the score from the previous TCS (2005) for this component assuming no change between 2005 and 2007 as 85% of the countries having values for both years only showed a ±1 point variation in their score.
Statistical analysis
Age-standardised and sex-standardised smoking prevalence rates and quit ratios were calculated for each country by means of the direct method of standardisation using the European population of 2013 as the standard.
We graphically described the distribution of the prevalence rates, quit ratios and TCS scores across the EU MS. We analysed the association between the TCS score in 2007 (overall and by its six components) as independent variables and smoking prevalence rates and quit ratios in 2014 as dependent variables by means of scatter plots and Spearman rank correlation coefficients (rsp) and the corresponding 95% CIs. We considered this time-lag of 7 years sufficient to observe any impact of the tobacco control policies on prevalence. We also analysed the correlation between the relative changes in smoking prevalence rates and quit ratios from 2006 to 2014. The relative change expresses the absolute change as a percentage of the indicator in the earlier period. We used relative and not absolute change because baseline values of both indicators were different for each EU MS.
Finally, we performed a linear regression analysis to examine the association between each component of the TCS from 2007 (independent variables) and the smoking prevalence and quit ratios in 2014 and both smoking indicators relative changes from 2006 to 2014 (dependent variables). We also fitted a multivariable linear regression model adjusting for all component scores to assess their independent effect.
Diagnostic tests showed that the linear regression model was appropriate for the analysis with respect to the assumptions of linearity and normality of percentage point change in smoking prevalence in 2014 but not for homoscedasticity. We performed a logarithmic transformation of the data, but the model continued to not fulfil the assumption of homoscedasticity. However, we decided to fit the model assuming our model limitations as a result of the small sample size. For quit ratios, none of the linear regression conditions were met. We performed a logarithmic transformation, but the model continued unfulfilling the assumptions. Thus, we decided not to perform the linear regression model for quit ratios as the dependent variable. The analyses were performed separately for men and women and for six age groups (15–24, 25–34, 35–44, 45–54, 55–64 and ≥65 years) since tobacco control policies have shown a differential effect on smoking prevalence by sex and age in previous studies.15 18 All tests of statistical significance were two sided, and P values less than 0.05 were considered statistically significant. Analyses were performed with Stata V.13.0 and SPSS V.20, incorporating the weights provided in the Eurobarometer dataset to account for the complex survey design.
Results
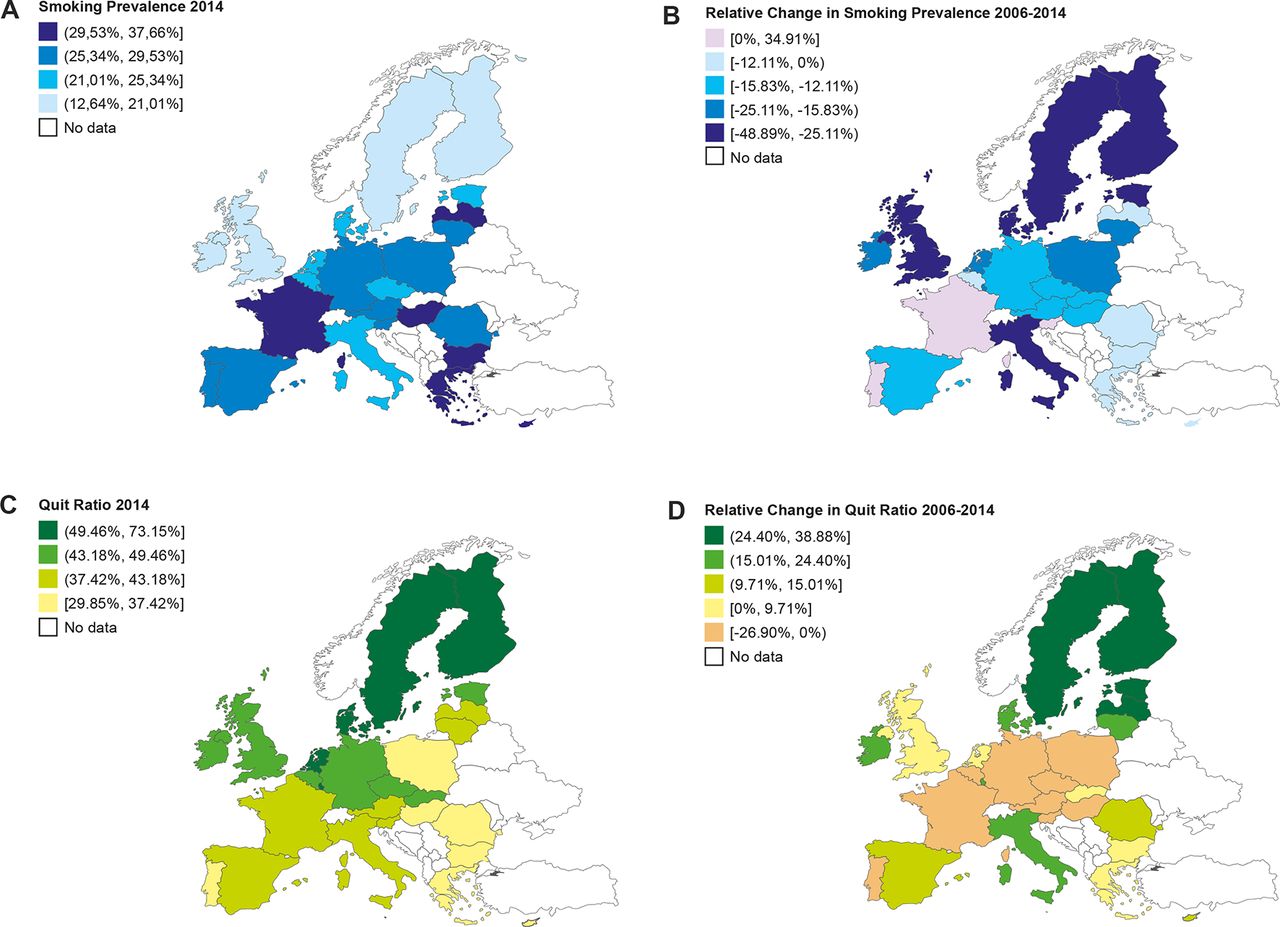
In 2014, the prevalence of smokers was 25.4% (95% CI 23.3% to 27.6%) in EU27, varying from 12.6% in Sweden to 37.9% in Bulgaria (figure 1A). The prevalence of smokers in EU27 decreased by 13.9% (95% CI 7.3% to 20.6%) from 2006 to 2014, varying from a relative decrease of 48.9% in Sweden to 0.3% in Bulgaria. Three EU27 countries (France, Portugal and Slovenia) have however increased their prevalence of smokers during the last decade (figure 1B). In 2014, the quit ratio was 44.2% (95% CI 40.3% to 48.1%) in the EU27, varying from 73.2% in Sweden to 29.9% in Hungary (figure 1C). The quit ratio in EU27 has increased by 8.5% (94% CI 2.2% to 14.9%) from 2006 to 2014, varying from 38.9% in Latvia to 2.9% in Bulgaria. Some countries have decreased their quit ratio during the last decade (figure 1D), with the greatest decrease in Slovenia (26.9%).

(A) Smoking prevalence in 2014, (B) relative change of the smoking prevalence from 2006 to 2014, (C) quit ratio in 2014 and (D) relative change of quit ratios between 2006 and 2014 in 27 European Union countries (EU27). For relative changes, intervals have been determined by quartiles from 0%.
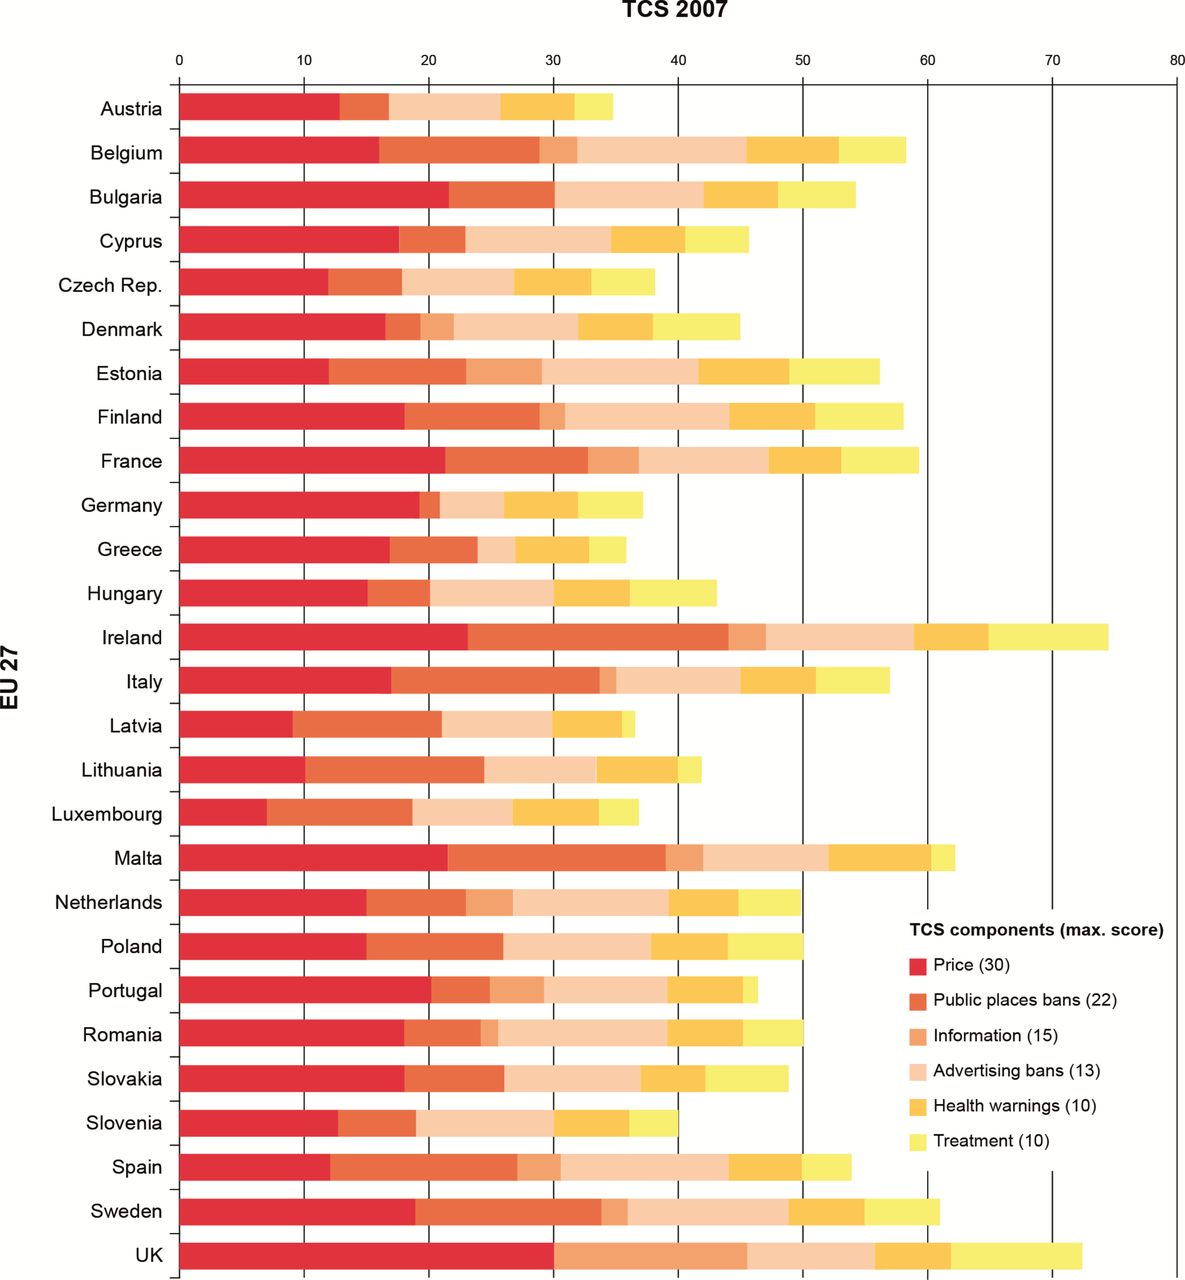
In 2007, Austria was the EU MS with the lowest score in TCS (35), while the UK had the highest one (93) (figure 2). The EU MS that had higher scores in the TCS (UK, Malta and Sweden; scores ≥60) showed relatively low smoking prevalence (less than 12.5%) and higher quit ratios (over 49%). Those with lower scores in the TCS (Germany, Greece and Luxembourg; scores ≤40) had relatively high smoking prevalence (between 20.9% and 37.9%) and the quit ratios were relatively low (between 51.6% and 33.4%).
There was a moderate inverse association between TCS score and the prevalence of smokers in 2014 (rsp=−0.444, 95% CI −0.71 to −0.08; P=0.02; figure 3A; table 1) and a moderate direct association between TCS scores and the relative change in smokers’ prevalence in EU27 from 2006 to 2014 (rsp=0.415, 95% CI 0.04 to 0.69; P=0.03; online supplementary table S1) (figure 3A). Higher TCS scores in 2007 correlated with lower prevalence of smokers in 2014, being stronger among men (rsp=−0.512; P<0.01), adults aged 25–34 years-old (rsp=−0.414; P=0.03). By the individual TCS components, higher scores on public places bans (rsp=−0.439; P=0.02) and health warnings (rsp=−0.414; P=0.03) were the ones better correlated with the smoking prevalence in 2014 (table 1) in EU27. Price was the component with the lowest correlation (rsp=−0.181; P=0.37) (table 1). TCS scores and higher changes on tobacco smoking rates were highly correlated among men (rsp=0.399; P=0.04) and among adults aged >65 years old (rsp=0.551; P<0.01). By components, higher TCS scores on public places bans (rsp=0.502; P<0.01) and treatment (rsp=0.564; P<0.01) correlated with higher changes in 2006–2014 on smoking prevalence (online supplementary table S1) in EU27.
Supplementary file 1

Tobacco Control Scale (TCS) total scores by its components in 2007 for the 27 European Union countries.

(A) Correlation between Tobacco Control Scale (TCS) total scores in 2007 and the smoking prevalence in 2014 (left) and the relative changes of smoking prevalence between 2006 and 2014 (right) in the EU27. (B) Correlation between TCS total score in 2007 and quit ratios in 2014 (left) and the relative change of quit ratio between 2006 and 2014 (right) in the EU27. *P<0.05. EU, Europen Union; rsp, Spearman’s rank correlation coefficient.
Spearman’s rank correlation coefficients (rsp) and 95% CI between TCS scores in 2007 (overall and individually for its six components) and smoking prevalence in 2014 in total and by sex and age groups
There was a moderate non-significant direct association between TCS scores and quit ratios in 2014 (rsp=0.373, 95% CI −0.01 to 0.66; P=0.06; figure 3B, online supplementary table S2) and a low non-significant direct association between TCS scores and changes in the quit ratios in 2006–2014 (rsp=0.278, 95% CI −0.11 to 0.60; P=0.16; figure 3B, online supplementary table S3). Higher overall TCS scores correlated with higher quit ratios in 2014. This correlation was higher among men (rsp=0.524; P<0.01) and among adults aged >65 years old (rsp=0.501; P<0.01). By TCS components, scores on public place bans (rsp=0.364; P=0.06) and health warnings (rsp=0.377; P=0.05) were those better correlating with higher quit ratios; however, both associations were non-significant (online supplementary table S2). TCS scores and higher changes on quit ratios were highly correlated among adults aged >65 years old (rsp=0.398; P=0.04) and, by TCS components, scores on public place bans (rsp=0.505; P<0.01) were those better correlating with higher relative changes in quit ratios from 2006 to 2014 (online supplementary table S3).
The unadjusted linear regression models for each TCS component showed that none of them explained more than 20% of the smoking prevalence in 2014 in Europe. As shown in table 2, in the linear regression model simultaneously adjusted for all TCS components, none of the components was statistically significantly associated with the smoking prevalence in 2014. The percentage of the smoking prevalence explained by the model was 28.9% (P=0.279). In men, the percentage of the smoking prevalence explained by the model was 31.1% (P=0.227) and was 23.0% (P=0.455) in women.
Adjusted linear regression analysis examining the association between each component of the TCS in 2007 and the smoking prevalence of 2014 in 27 EU countries
Discussion
Main findings
A higher implementation of tobacco control policies as indicated by higher TCS scores in 2007 was associated with a lower prevalence of smokers among the EU population both in 2014 and with changes in prevalence across the whole period (2006–2014). Similarly, higher TCS scores in 2007 were moderately associated with higher quit ratios in 2014; however, no association was found when correlating TCS scores with changes in quit ratios across the whole period.
Interpretation of results
The individual TCS components that showed a higher association with both a lower smoking prevalence and higher quit ratios in 2014 were public places bans and health warnings. A study conducted in Europe also found a correlation between the level of smoke-free legislation among European countries and a decrease in the prevalence of smoking of cigarettes and an increase in the previous intent to quit smoking in the past months,25 in agreement with previous conducted research.26 The results of the present study are consistent with those of other studies, which demonstrated the positive impact of number of highest level implementations of MPOWER measures on reducing smoking prevalence over time.13 14 Additionally, our study is a further advance over these previous studies since it does show the association between tobacco control policies implementation on smoking prevalence and on tobacco cessation through quit ratios.
It is possible that the countries that adopt tobacco control policies are those in which smoking has lost its social acceptance favouring a decline in the smoking prevalence. Our data indicate, however, that tobacco control policies matter. Therefore, we cannot exclude a two-way phenomenon as those countries with favourable secular trends in smoking should be more prepared to implement and enforce tobacco control policies. There are also indicators that the policies may precede the decline in smoking prevalence. For example, in the UK, the low prevalence at the beginning of 2000s derive from a steady decline observed since the early 1970s, directly linked to the increase in the price of tobacco through taxation.27 Another example is the case of Spain, where the prevalence of smoking was high (about 70% in males aged 45–64 years) in the 1980s in the absence of strong tobacco legislation, and once legislation was enforced and new tobacco control policies were implemented in the late 1990s, we observed a steady decline of the prevalence of smoking among males and a level-off of the prevalence in females.28
Tobacco tax and price increases are proven to be the fastest acting and most effective measures of all.13 29 30 However, our study shows only a low correlation between TCS price scores and tobacco smoking prevalence. Such results could be explained by the lack of variability among countries of the EU27 scores in this component, as 70% of their scores are between 11 and 19 points.5 Moreover, the smoking prevalence in these countries in 2014 did not differ much either, since also about 70% of them had a prevalence rate between 20% and 29%.
Other explanations include, first, the increase in the proportion of roll-your-own (RYO) over the past few years, particularly among young people, that have been attributed to a raise on the price of manufactured tobacco31–33 combined with the sustained cheaper prices for RYO. Therefore, our results could be underestimating the effect of price on smoking prevalence. While the TCS did not take into account RYO cigarettes to score the implementation of tobacco taxation policies,5 the smoking prevalence did include RYO smokers and not only manufactured ones.23 Second, these results could be explained by an attenuation of the long-term effect of an increase on tobacco price. A study conducted in Australia showed that despite the increase in quitting activity in the months immediately after the tax increase, quitting activity fell back to previous levels after 3 months.34 Third, legal cross-border shopping and illicit trade could be also responsible at some extent of the attenuated effect of price on smoking prevalence since it might increase the affordability of tobacco products, mainly cigarettes, while it counteracts the governmental tax increases35
A study in 18 European MS found a positive association between the quit ratios and TCS score.15 Our study shows a direct but not statistically significant correlation between TCS score and quit ratios; however, no association was found with changes in quit ratios across the whole period. Lower associations between tobacco control policies and quit ratios could be explained because quit ratios may represent a less sensitive measure to monitor tobacco use among certain populations compared with tobacco smoking prevalence because of changes in the denominator per each measure or the different stages of the tobacco epidemic.36
Limitations and strengths
This is an ecological study, and consequently, any causal relationship between tobacco control policies and the outcomes assessed (smoking prevalence and quit ratios) is difficult to establish. However, the results of our study are in agreement with other studies showing a reduction in smoking prevalence and an increase in quit ratios after passing tobacco control policies.8 15 37 We are not trying to infer the relationship at the individual level but simply assessing an ecological effect. Other limitations of our study are the reduced number of EU MS introduced in the analysis as it reduces the statistical power and the lack of information about the stage of the tobacco epidemic across the different countries.37 However, we have been able to study the correlations in separate strata of sex and age, since we computed the prevalence rates and quit ratios from the original Eurobarometer database. This information could help to better understand the relationships studied rather than using the crude prevalence and quit ratios estimates.
The use of self-reported data from questionnaires could be a source of bias, although self-reports on smoking status have acceptable validity.38 The small sample size in each EU MS could be another limitation. However, the sample design of the Eurobarometer guarantees the representativeness by country.1 Given the limited sample size (n=27 countries), the correlation coefficients could be also affected by some outlier observations. We statistically assessed that UK and Ireland, the two countries with higher TCS scores and lower smoking prevalence, are influential observations but not outliers. Hence, we opted to maintain both countries in the correlation analysis. Similarly, the sample size likely precluded significant associations of the TCS components with smoking prevalence in the multivariate analysis.
Finally, using the TCS as a measure of the tobacco control activities of each EU MS has some limitations since it scores the implementation of tobacco control policies but, at least in 2007, the TCS did not score their level of enforcement except for smoke-free policies.5 Admittedly, TCS scores in 2007 may not fully reflect tobacco control policies implemented in subsequent years that could in turn also affect the prevalence of smoking in 2014. However, the ranking of countries according to TCS scores has been relatively consistent across different editions of the scale and the magnitude of the correlation decreased as we used more recent TCS scores (2010: rsp=−0.435; P=0.02; 2013: rsp=−0.275; P=0.17)
Our study is the first to introduce a longitudinal perspective to the analysis of the impact of tobacco control policies in the EU. It evaluates the association between TCS scores and tobacco use indicators (smoking prevalence and quit ratios) across time using an adequate time window between the evaluation of policies and tobacco use indicators. Moreover, our study introduces the use of relative changes as an outcome variable taking into account the difference in the starting point of each country and hence trying to avoid an underestimation of the effect.
Conclusion
This study shows that, at the ecological level, higher implementation of tobacco control policies is associated to lower prevalence of smoking and higher quit rates over the last decade. Although variability in tobacco control policies exists among EU countries, it is relatively limited. Therefore, it would be interesting to develop scales, based in the original TCS, for other continents to be able to compare countries that are in different levels of the FCTC implementation process.13 39 Further steps should include an analysis of the impact of relative changes in the TCS scores on changes in smoking prevalence and quit ratios over the last decade. EU27 should continue implementing comprehensive tobacco control policies as they have a positive effect in reducing the prevalence of smoking and increasing tobacco cessation rates in their population.
What this paper adds
Higher Tobacco Control Scale scores in 2007 are associated with both lower smoking prevalence (rsp=–0.444; P=0.02) and higher quit ratios (rsp=0.373; P=0.06) in 2014.
European Union Member States with a higher level of implementation of tobacco control policies have both a higher decrease in their smoking prevalence and a higher increase in their quit ratios.
References
Footnotes
Contributors Study design: AF and EF. Collected data and prepared database for analysis: AF, LJ and FTF. Contributed to strategy of analysis: AF, EF and GTF. Analysed data: AF and YC. Interpreted data results: AF, EF, FTF, AB, CM, LJ and YC. Drafted manuscript: AF. Critically revised manuscript: all authors. Approved final manuscript version: all authors. Guarantor: EF.
Funding This research forms part of the EUREST-PLUS Project. This Project has received funding from the European Union’s Horizon2020 Research and Innovation Programme under agreement No. 681109. AF, AB, YC, CM and EF were also supported by the Department of Universities and Research, Government of Catalonia (grants 2014SGR999 and 2017SGR319).
Competing interests None declared.
Provenance and peer review Not commissioned; externally peer reviewed.
Data sharing statement The datasets of the Eurobarometer supporting the conclusions of this article are freely available online in doi:10.4232/1.10981, doi:10.4232/1.12265 and doi:10.4232/1.12264.