Article Text

Abstract
Objectives: To relate Australian National Tobacco Campaign advertising to outcome measures such as smokers’ awareness of and reaction to the campaign, and indicators of interest in smoking cessation.
Design: Continuous tracking was used to survey random cross sectional samples of the target audience via telephone interviews. Baseline measures were collected preceding each advertising phase, whereafter subjects were interviewed on a weekly basis for the entire period of each phase. Changes in outcomes could thus be inferred on a weekly basis allowing variations in advertising intensity to be monitored for effect. Three phases were evaluated variously in Melbourne, Sydney, and Adelaide.
Subjects: A total of 9033 subjects aged 18–40 years were interviewed. Age and sex of the sample were evenly distributed.
Results: In general, it was found that the greater the media weight, the greater the recall and recognition mediated by the message of the advertisement and the creative execution—advertisements with a clear figure ground executional format appeared more memorable than those without, and health effects advertisements were more memorable than those encouraging calls to a quitline. The relationship between various communication effects and media weight was limited by the confounding of prior activities in two of the phases.
Conclusions: Advertisements with clear figure ground executional formats and those illustrating health effects of smoking have high memorability. Future campaigns that are continuously tracked are recommended to systematically vary media weight, flighting schedules, and advertisement type, so as to maximise information about these variables and their interactions.
- tracking survey
- advertisements
- target audience rating points
- CIT, continuous information tracking
- TARPs, target audience rating points
- WNTD, World No Tobacco Day
- CATI, computer assisted telephone interviewing
Statistics from Altmetric.com
- CIT, continuous information tracking
- TARPs, target audience rating points
- WNTD, World No Tobacco Day
- CATI, computer assisted telephone interviewing
The impact of anti-smoking advertising campaigns is generally evaluated via pre-post surveys,1 sometimes using cohort samples,2 or post only surveys.3 In most cases, respondents are asked about their recall and impact of the advertisements some time after the advertising has ceased. Such surveys are unable to assess transitory campaign effects that might be related to media weight or to different advertising executions. In a continuous information tracking (CIT) programme, interviewing is carried out continuously throughout an extended period. A major feature of CIT is that one can identify dependent variables that vary directly and contemporaneously with media weight or type of campaign activity (eg calls to a quit line), and those that vary as a function of cumulative campaign activities (eg changes in some attitudes and beliefs). In the context of an anti-smoking campaign, the aims of CIT are to plot the relationship between advertising input and output measures, such as smokers’ awareness of and reaction to the campaign, attempts and intentions to quit, and other indicators of interest in smoking cessation.
CIT relies on measures of television media weight for its advertising exposure estimates, known as target audience rating points (TARPs). TARPs are a standard measure of the weekly volume of television advertising weight scheduled to reach the target audience (which for the current campaign was all smokers aged 18–39 years old). TARPs are a multiple of the per cent of the target audience reached by (ie exposed to) the campaign and the average number of times (frequency) a target audience member is exposed to the advertising. Hence TARPs data are somewhat ambiguous in that 240 TARPs may represent 80% of the target audience reached with an average frequency of three, or 60% reached an average of four times, and so on. In most cases, advertisers attempt to reach at least 80% of their target audience over the first two weeks of a campaign. In spite of this ambiguity, TARPs data have been found to be reliably related to various campaign effects.4–5
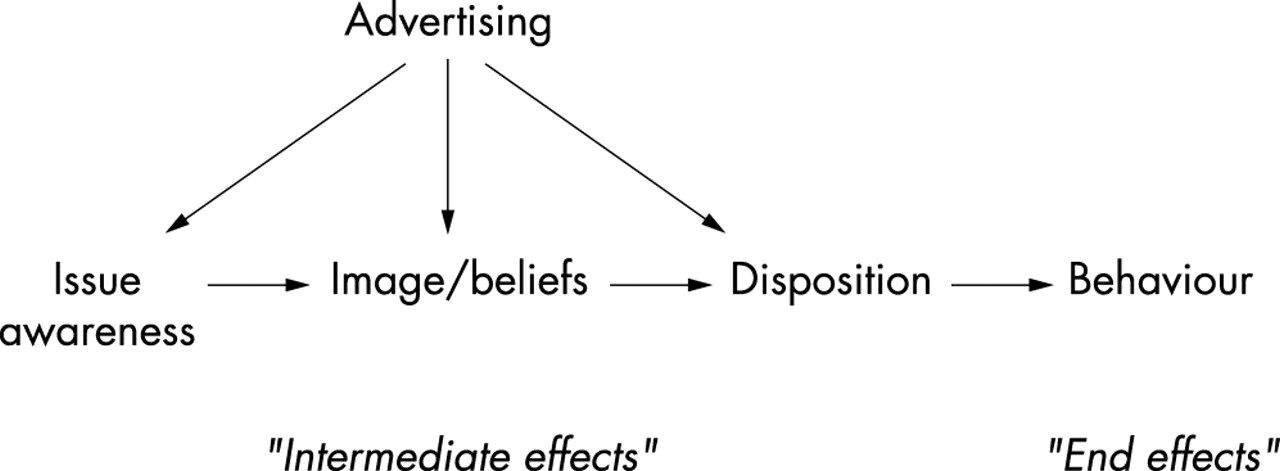
The specific survey measures used in the tracking programme compared with TARPs are derived from a basic model of communication effects. In its simplest form, this can be represented for advertising effects, as in fig 1.6

Simple model of advertising’s influence on behaviour changes.
In this model, behaviours (the end effects) are a function of the individuals’ awareness of the issue, beliefs, and knowledge about the issue and based on these, their disposition or attitude toward the issue. A communications campaign (advertising, input) aims to facilitate a change in behaviour through changes to one or more of these intermediate effects.
CIT involves the on going monitoring of media activity and the simultaneous measurement of one or more of the following five variables:
process impact of the various communications (advertisement recall and recognition; message take out)
changes in salience or awareness of the topic in question (eg tobacco as a significant health issue)
changes in knowledge or beliefs about the topic (eg beliefs about damage caused by smoking)
changes in overall attitudes or disposition towards the issue (eg overall attitude to smoking)
changes in behaviour or intentions (eg attempted quitting or intentions to attempt to quit).
The present paper provides details of the tracking surveys undertaken as part of a comprehensive evaluation of the Australian National Tobacco Campaign from 1997 to 2000. A complete overview of the campaign and its rationale is provided elsewhere.7–8 As described in Hill et al,7 the seven advertisements for the campaign were designed to be empathetic towards smokers and to appeal to the self-deprecating humour possessed by many smokers as revealed in initial focus groups. This was achieved by illustrating actors in situations that smokers could relate to, such as being forced to light a cigarette from a stove for lack of a lighter; salvaging a crumpled and bent cigarette from a bag; huddling outside an office block on a blustery day to smoke a cigarette; and lighting up a cigarette at a bus stop just before the bus appears. While being sympathetic towards smokers, six of the advertisements were designed to evoke strong visceral (or “yuk!”) responses by graphically portraying the health effects of smoking on various organs of the body in a grisly manner. The advertisements are described in more detail by Hassard9–10 and Hill et al,7 we describe them in brief below, according to the phase in which they were launched.
The advertisements launched in phase one were:
artery: fat deposits being squeezed from the inside the walls of a smoker’s aorta
lung: accelerated time exposure of lung tissue disintegrating from cigarette smoke
tumour: bulbous tumour growing on the insides of a smoker’s lung.
Phase one of the campaign commenced in Melbourne on 7 June 1997 with the “artery” and “lung” advertisements, “tumour” was introduced in the second week of July, and the advertising continued until December 1997. In the first four weeks of phase one, TARPs averaged almost 300 per week.
The advertisements launched in phase two were:
brain: a smoker’s brain being dissected and blood oozing from a clot
call: modelling of the behaviour of a smoker picking up a telephone and calling the quitline, and showing the call room and a person responding.
Phase two commenced on 19 April 1998 in Melbourne and 26 April 1998 in Sydney. This was preceded in each city by World No Tobacco Day (WNTD) on 31 May. The phase two campaign was of 11 weeks’ duration in Melbourne and four weeks in Sydney. Sydney had a total of 369 TARPs (weekly average just less than 100), whereas TARPs for the first four weeks in Melbourne totalled 574 (weekly average just less than 150). Later weeks in Melbourne were generally less than 50 TARPs per week.
During phase two in both cities, “call” received the majority of TARPs: Sydney 254 v 115 for “brain”; Melbourne: 384 v 170 for brain (first four weeks). That is, brain received approximately only 30 TARPs per week in Sydney and 40 per week in Melbourne for the four weeks of the campaign.
The advertisements launched in phase three were:
tar: a lung being sliced open and a year’s worth of cigarette tar being poured into it from a beaker
eye: blood vessels in the retina of a smoker bursting and leading to blindness.
Phase three commenced on 31 May 2000 (WNTD) in Adelaide, Melbourne, and Sydney and continued for a total of seven weeks. The campaign advertising distribution was similar in all three cities with respect to “tar” (aired mainly in the first three weeks) and “eye” (mainly weeks four and five), and all three cities aired all three advertisements (tar, eye, and call) in week seven. Total TARPs were 965 (weekly average approximately 138) for Melbourne, Sydney had 1235 (weekly average 176), and Adelaide had 1827 (weekly average 261), primarily due to Adelaide airing call in all seven weeks (Adelaide call TARPs 985). Excluding call TARPs, Sydney had the highest level of health effects advertising (944; average 135 per week), Melbourne had 790 (average 113), and Adelaide had 842 (average 120).
Phase one involved substantial advertising weight sustained for several months. Phase two involved only four weeks of advertising in Sydney and 11 weeks in Melbourne with significantly lower levels of media weight. Similarly, phase three aired for only seven weeks in Adelaide, Sydney, and Melbourne, and at significantly lower levels of media weight than in phase one. Hence, the results from phase one are more compelling than for the two subsequent phases and as such this paper focuses primarily on the results for phase one.
This paper describes results of the CIT surveys that were undertaken in the three campaign phases, in order to provide insight into the relative effectiveness of different type of advertisements, as measured by smokers’ awareness of and reaction to the campaign, and indicators of interest in smoking cessation.
METHOD
Sample selection process for CIT surveys
Phase one tracking was undertaken for 27 weeks in the city of Melbourne in 1997. Phase two of the campaign was tracked in Sydney and Melbourne for eight weeks in 1998, and phase three was tracked for eight weeks in 1999 in Adelaide, Sydney, and Melbourne.
For each phase of the campaign, a random sample of telephone numbers was generated by the research agency’s computer assisted telephone interviewing (CATI) system. Unanswered numbers were automatically redialled after a set interval. Three attempts to obtain contact were made before substitution. Only persons in the primary target audience for the campaign were selected for interview, that is, people aged 18–40 years (or 16–40 years in phase three) who currently smoked or who had smoked on at least a weekly basis in the past year. However, asking questions about smoking behaviour in order to select respondents for the survey was thought likely to affect unprompted recall of smoking as a health issue. Hence, information on campaign salience was collected from adult respondents before asking whether or not they smoked.
Following initial questions of campaign salience, all 18–40 year old adults in the household (or 16–40 year olds in phase three) were enumerated who currently smoked or who had done so on at least a weekly basis in the past year. Where there was more than one eligible respondent in the household, the “next birthday” technique was used to select one for the tracking interview. If unavailable a further two attempts were made to contact the specified individual before another number was substituted.
In phase one, two weeks of baseline data were collected prior to the launch of the campaign (base week one n=200, base week two n=100). Once the campaign was launched, 100 Melbourne smokers and recent quitters (hereafter called “smokers”) aged 18–40 years were surveyed by telephone each week for the entire 27 weeks duration of the campaign. The pattern of weekly surveying was designed to spread the interviews as equally as possible over the seven days of the week, resulting in around 14 completed interviews each day. For the first week, twice the usual sample (n=200) was taken to help smooth out the initial estimates that are underweighted in a moving average.
In phase two, following one week of pre-campaign surveying to establish a benchmark (n=300 per city), approximately 80–85 interviews were obtained in each of the two cities for the next 10 weeks. In phase three, following two weeks of pre-campaign surveying in the period 16–30 May (n=310 in each city), approximately 75 interviews were obtained in each of the three cities for the next eight weeks. Relatively small weekly samples are acceptable in continuous tracking because the results are plotted as a moving average.
The final samples in each phase comprised an equal proportion of males and females and 85–90% were current smokers. The remainder were smoking less than once per week or had quit within the past 12 months.
Questionnaire measures
The questionnaire contained a number of measures that can be classified into five broad categories. The questionnaire for phase one appears Donovan et al.11
Firstly, tobacco advertising salience relative to other health issues was assessed. To get a response independent of any priming about smoking, the first adult person answering the phone was asked, “In the last two weeks have you seen or heard any advertising encouraging people to do things to improve their health?” Those who said “yes” were asked to identify the topic of the advertising.
Secondly, in order to measure campaign and advertising awareness, respondents were then asked, “During the past two weeks, have you seen any TV advertising about tobacco smoking?” This is known as category cued recall. Those who answered “yes” were asked to describe the advertisements that came to mind. The proportion correctly describing each campaign advertisement is called the validated unprompted recall for each advertisement. This is a measure of advertisement salience and is a function of media weight and the ability of the creative execution to attract attention and be linked to the category cue in memory. That is, two advertisements may receive the same TARPs, but the creative execution that is more vividly linked to the category cue will achieve higher rates of recall.
Later in the questionnaire, respondents were read descriptions of the advertisements and asked whether they had seen each on television, and if so, how many times. This measure of prompted recognition is a measure of whether or not the respondent has been exposed to the advertisement and is a diagnostic check on whether the proposed media schedule achieved its forecast reach.
The third category of interest was salience of thoughts about quitting and was measured as follows, “During the past two weeks, how often have you thought about quitting?” Response categories were recorded along a five point scale from “several times per day” to “not at all”.
Fourthly, beliefs about health effects of smoking were assessed. Respondents were presented with the following two statements and asked which was “nearest to the truth”: “You have to smoke for several years to do any damage to your health” or “Every cigarette you smoke is doing damage to your health.” Respondents were also asked their “likelihood of becoming ill” from their smoking, with responses being recorded along a five point scale from “no likelihood” to “certain”.
Fifthly, attitudes and dispositions about smoking were measured by focusing on reported campaign effects on smoking behaviour and stage of change regarding quitting. Smokers were asked whether the advertising campaign as a whole had made them “more likely to quit”, “less likely to quit”, or “made no difference”. They were also asked a series of questions to determine their stage of change. Smokers who were not seriously considering quitting smoking in the next six months were defined as pre-contemplators, those who were thinking about it, but not planning to quit in the next 30 days or had not set a date to quit were defined as contemplators, and those who were planning a quit attempt in the next 30 days and had made a date to quit were defined as ready for action (fig 2).

Flow chart used to assign stage of change.
Finally, quit attempts and reported campaign effects on household discussion of smoking were assessed. Respondents were asked whether they had attempted to quit smoking in the past two weeks, whether the advertising campaign had caused any discussion in their household about smoking and health, and whether anybody at their house had been trying to get them to quit in the past two weeks.
To gain some idea of overall effects on quitting behaviour and intentions, a composite measure of quitting intentions and behaviour (Quindex) was used.11 The measure includes current smoking status; anticipated smoking status in one year; stage of change and quitting plans; recent quit attempts; and, among non-smokers, the recency of having quit.
Data analyses
In keeping with CIT data analyses, this paper emphasises visual interpretations of plotting TARPs data against the dependent variable measures to identify campaign effects. However, where relevant we report whether a trend is significant and whether an onset effect occurs—that is, a statistically significant change from benchmark in the first weeks of the campaign.
It is important to remember that the baseline for the continuous tracking of phase one (and phase three) started in the week that included WNTD (May 31). It is likely, therefore, that some baseline indices were inflated, which would serve to mask some campaign effects. Hence, any observed desirable increases in output measures over the baseline would be particularly notable.
Three week rolling averages were used for the phase one CIT measures plotted against weekly TARPs, as this provides a smoother pictorial display of the data. The disadvantage of using rolling averages is that it will show a gradual onset of impact for discrete events. As the current report is concerned with both trends and onset effects, a modification of the standard three week rolling averages for the figures was necessary in order to keep the baseline and campaign periods discrete. Thus, the rolling averages are baseline week one and two, campaign week one and two, campaign week one to three, campaign week two to four, and continuing rolling three week averages across the remainder of the campaign period. This principle was also applied to the measures specific to tumour.
RESULTS
Overview of campaign TARPs
TARPs levels for each of the three advertisements in phase one in Melbourne, which comprises the main analyses, are shown in fig 3. Both artery and lung were launched in the first four weeks of the campaign, at approximately equal TARPs levels. Tumour was first shown in July at somewhat lower levels than the initial levels for the two earlier advertisements. It should also be noted that after week 10, TARPs levels fell below 150 TARPs for all weeks, with a common pattern of alternate weeks having very low TARPs.

Phase one weekly TARPs (artery, lung, and tumour).
Tobacco advertising salience relative to other health issues
In response to the initial question about whether respondents had seen or heard any advertising encouraging people to do things to improve their health, the proportion in phase one mentioning anti-smoking as a topic rose from 20% in the pre-campaign period, to a peak of 53% in week three of the campaign. In line with the decline in TARPs, the onset effect was followed by a gradual downward trend for the remaining campaign period, with 19% mentioning anti-smoking in the final three weeks.
In phase two, for the Sydney and Melbourne samples combined, the percentage mentioning anti-smoking as a topic rose from 6% prior to commencement of the campaign, to a peak of 27% at the fourth week of the campaign. In phase three, recall of anti-smoking advertising rose from 20% of all three cities’ samples combined prior to the campaign, to 32% at the end of the third week of the campaign.
The far higher salience of anti-smoking advertising in phase one relative to phases two and three directly reflects the disparity in TARPs between phase one and the later two phases. It is noteworthy that phases two and three achieved similar recall levels although there were far higher TARPs in phase three than phase two. This suggests anti-smoking advertising salience is more than a function of total TARPs, and could be a function of the types of advertisements aired.
Campaign advertising awareness
Cued recall for any anti tobacco advertising in phase one was 13% at baseline, with an onset effect to a peak of 83% around week four of the campaign, followed by a steady downward trend to 51% over the last three weeks (fig 4). In phase two, reported awareness for the combined samples of any anti tobacco advertising was 24% at baseline and there was an onset effect to a peak of 59% around week four of the campaign. In phase three, for the three cities combined, reported awareness of any anti tobacco advertising was 54% pre-campaign (no doubt due to WNTD activity), peaking at 77% in week four.
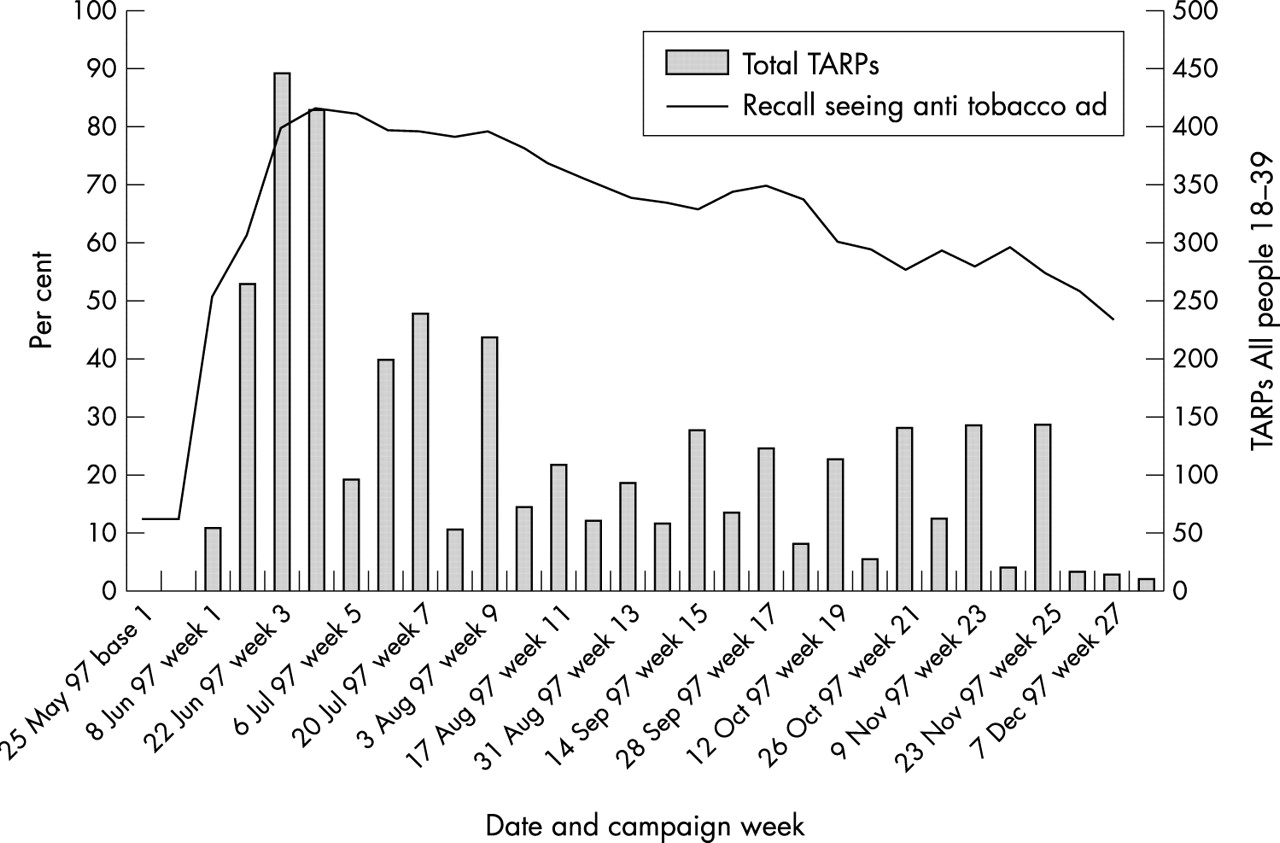
Recall of any anti tobacco advertising.
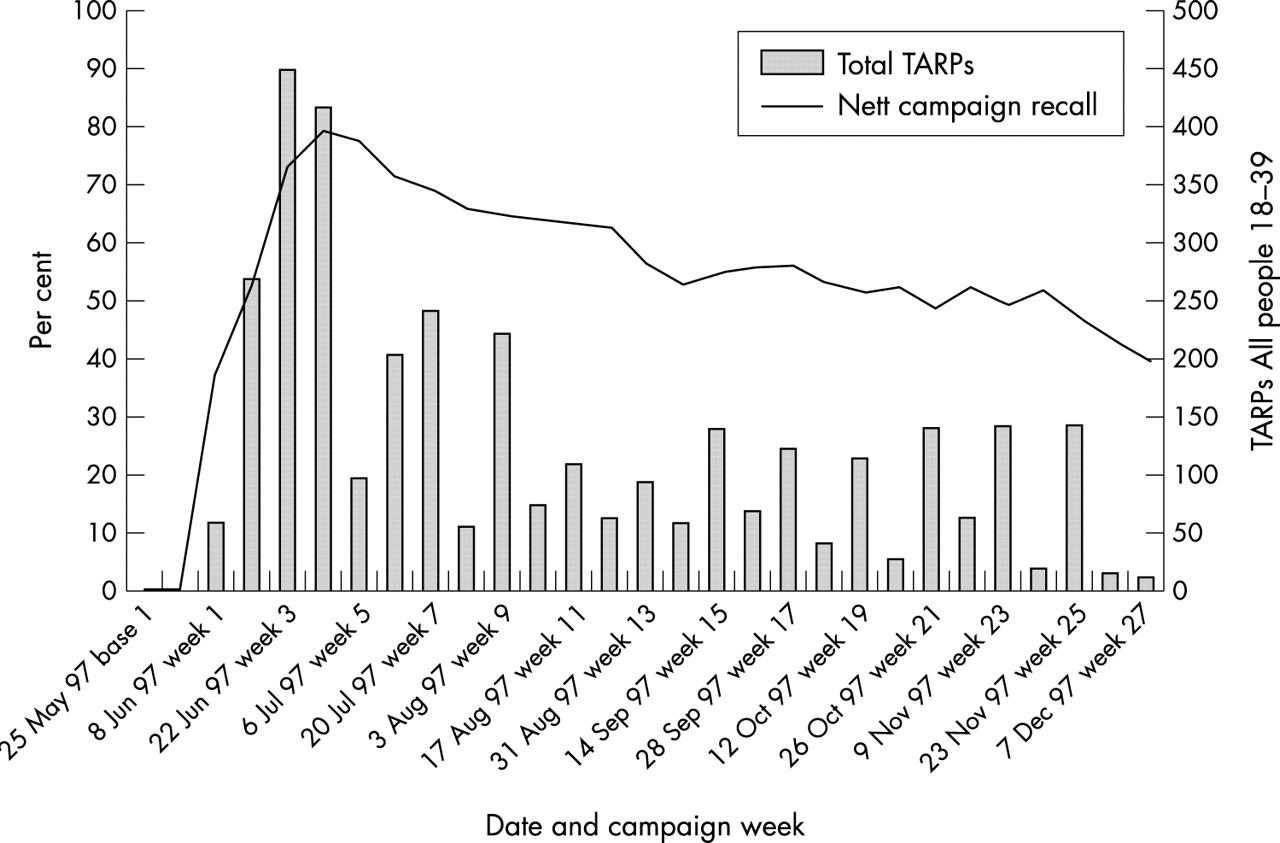
Respondents were asked to describe the advertisement(s) they could recall. These descriptions were analysed to identify those advertisements related to the campaign and those that were not related to campaign advertising. The proportion in phase one correctly recalling any one or more of the campaign advertisements (ie “validated” recall) is plotted against total TARPs levels in fig 5.

Phase one campaign cut through.
Fig 5 shows that validated campaign advertising recall peaked at just under 80% in phase one, and then declined as media weight declined. Ignoring the last few weeks, it appears that 150–200 TARPs every two weeks, maintains about 50% audience cut-through.
Phases two and three showed similar onset patterns, but with far lower peaks reflecting the lower TARPs levels (40% in Sydney and 60% in Melbourne in phase two; 50% for all three cities combined in phase three).
Specific advertisement cut-through
Advertising recall, or cut-through, is a measure of the advertisement’s ability to be readily recalled from memory, and hence a measure of the advertisement’s noticeability or attention getting power and the extent to which the advertisement’s content has been linked to the category cue.
Based on respondents’ descriptions of the anti tobacco advertisement(s) they could recall, fig 6 shows the cut-through for each campaign advertisement in phase one as a function of total TARPs and individual TARPs for each advertisement. Despite approximately equal TARPs levels in the first four weeks of phase one of the campaign, artery was far more salient than lung in smokers’ minds. At its peak, artery was recalled by just under 65% of respondents who claimed to have seen it on television “in the past two weeks”, compared with lung peaking at 40%.
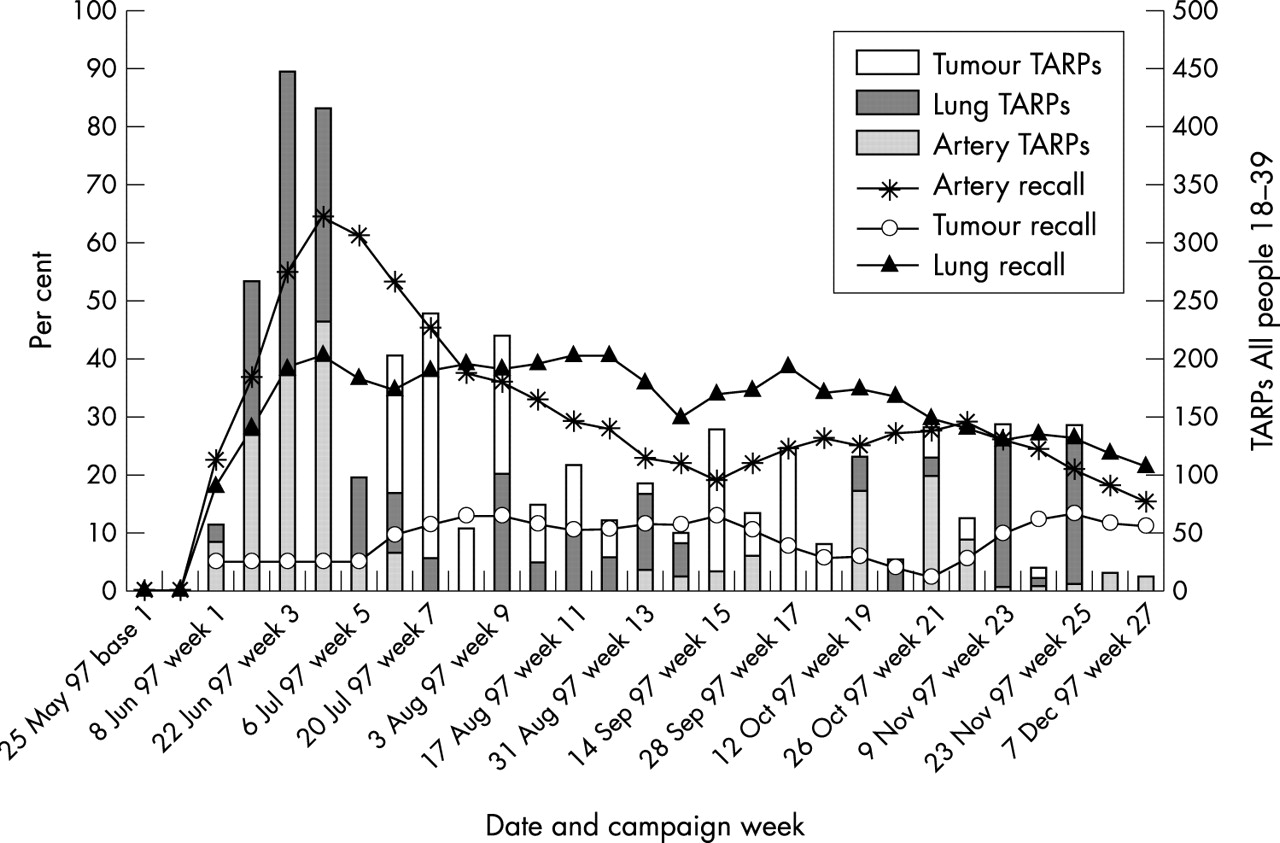
Phase one campaign cut through by advertisement.
Recall of artery declined rapidly with reduced or no exposure but the decline appears to have been reversed by extra TARPs levels in weeks 19–22. However, recall of lung showed very little decline for the first 20 weeks of the campaign, in spite of TARPs fluctuations.
Both artery and lung achieved significantly higher cut-through than tumour, even allowing for lower TARPs levels initially. Tumour achieved a peak cut-through of approximately 15% after its first wave of advertising, but continued to decline through its second wave, before showing some increase even though there was minimal further exposure in weeks 21–25.
The failure of cut-through of lung and tumour to follow TARPs is surprising, suggesting there may have been some confusion and/or mutual reinforcement between the two advertisements, given that both featured lungs. This was confirmed when combined TARPs for the two advertisements were graphed against combined cut-through (see fig 7).11
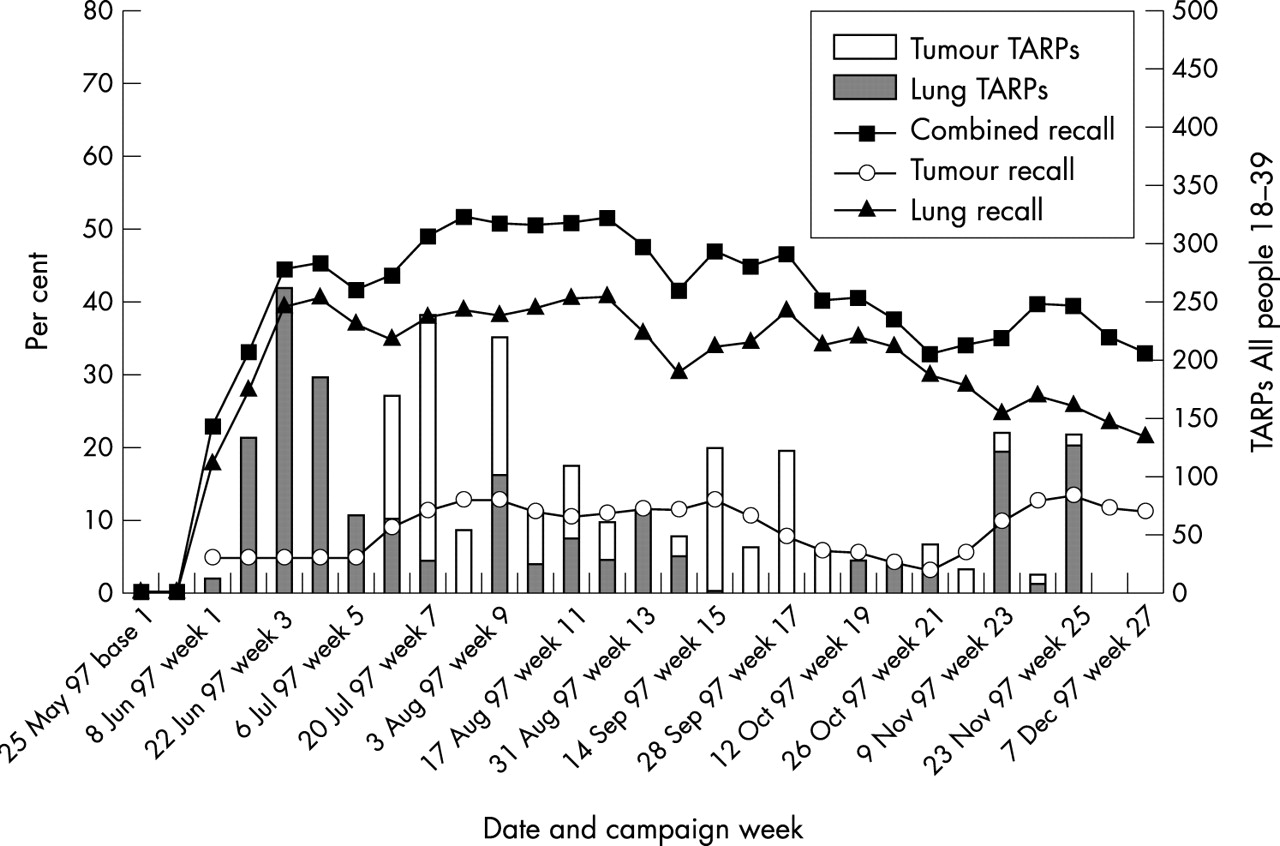
Phase one lung and tumour cut through.
In phase two, in spite of far lower TARPs levels, brain achieved higher levels of cut-through than did call for help in each city: 28% v 10% in Melbourne; 18% v 10% in Sydney. Again, the differences in levels of cut-through in the two cities can be attributed to the difference in TARPs levels. Reflecting the far lower TARPS levels in phase two, these results are far lower than advertisement cut-through results in phase one.
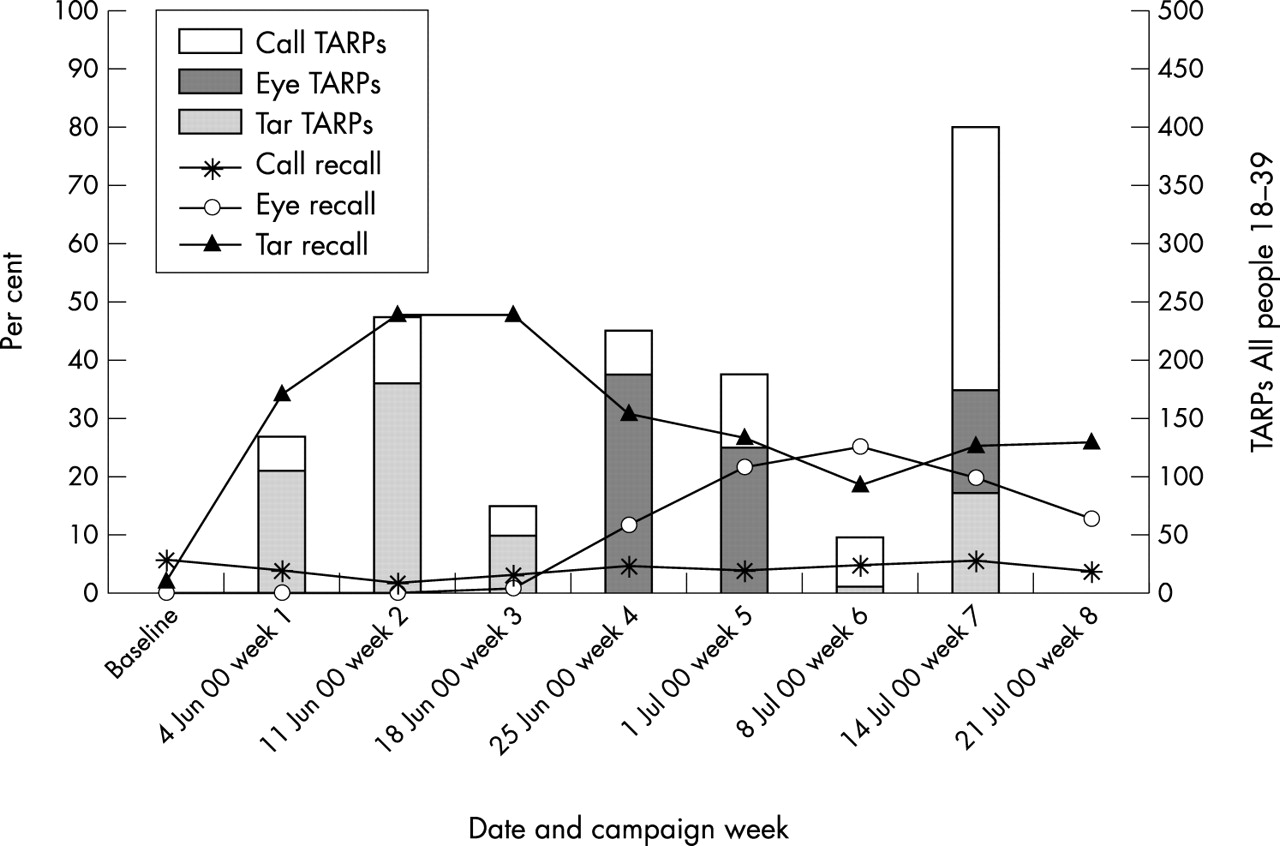
Fig 8 shows the TARPs and cut-through for each campaign advertisement across all three cities combined in phase three. Tar (pre-campaign 3%) achieved substantial cut-through very quickly, peaking at 50% in week three before declining when off air. Eye (pre-campaign 0%), although with slightly greater TARPs levels than tar for the initial two weeks (approximately 310 city average v 286), peaked at only 28%. Call (pre-campaign 4%) varied little throughout the campaign and, in spite of being aired from week one in Adelaide, showed no differences by city. As in phase two, call cut-through was very low, in spite of higher TARPs (fig 8).

Phase three campaign cut-through by advertisment.
It is clear that all of the health effects advertising executions are far more strongly recalled than the call execution. It is also noteworthy that cut-through for brain in Melbourne in phase two (28%) was approximately the same as that for eye in Melbourne in phase three (27%) but with far lower TARPs (40 per week for four weeks in phase two v 289 for two weeks in phase three).
Advertising recognition
Advertisement recognition in phase one peaked at approximately 90% for artery, 85% for lung, but about 60% for tumour. While recognition measures exposure to the advertisement, to some extent it also measures the ability of the advertisement to sustain attention. Advertisements that are attended to more closely are more likely to be recognised than are advertisements that are categorised in the first few seconds by the respondent as “of no further interest”, “seen before”, or “old news” and then ignored. It may well be that artery’s new information and distinctly different execution attracted greater and more sustained attention than did lung and tumour, and hence greater recognition (and cut-through).
In phase two, brain achieved almost 70% recognition in Melbourne and 60% in Sydney, but call achieved only about 50% (in each city), despite far higher TARPs. In phase three, tar achieved 84% recognition, eye 65%, and, with substantially higher TARPs, call achieved 72% recognition.
Salience of quitting
Bearing in mind that phase one (and phase three) measures may have been inflated by WNTD and associated activities in the weeks immediately prior to the campaign, fig 9 suggests some relationship between TARPs and “at least daily” thinking about quitting in phase one. From the baseline level (25%), there was an initial onset effect across about the first four weeks of the campaign in the proportion of smokers (35%) who thought about quitting smoking at least daily. The proportion remained relatively high across the campaign before declining in the last campaign weeks to baseline levels (around 23%). Whether this final decline is due to an onset of end of year lack of interest or reflects campaign burn out is not clear.

Frequency of thoughts about quitting during the past two weeks.
Phase three data showed a similar but non-significant effect for the proportion responding “several times a day”; approximately 15% for the first three weeks of the campaign, versus approximately 20% for three of the last four weeks of the campaign across all three cities combined.
Knowledge and beliefs
In phase one there was a very high pre-campaign endorsement that “every cigarette is doing damage” (90%). None the less there was a significant onset effect that peaked at about 96% around week three of the campaign. However, the initially high level of the belief (in all phases) effectively precludes much change. There was no evidence of a relationship between campaign activity and smokers’ beliefs that they would become ill from their habit in any of the phases.
Attitudes and dispositions
In the phase one baseline period, 31% of smoking respondents indicated that they were more likely to quit as a result of recent advertising they had seen. There was an onset effect to almost 70% by about week 11, followed by a slight downward trend dipping below 50% around week 18, resurging to 63% by week 23, and then dropping back to about 50% by the end of the campaign period (fig 10).

Phase one campaign effect on quitting: more likely to quit.
Phase one respondents were classified in terms of their stage of change. From the baseline (3%) there was an upward trend in the proportion of smokers in the ready for action stage, and this proportion peaked at 10% in the last weeks of the campaign. The trends associated with the pre-contemplation and contemplation stages of change did not reach statistical significance. Nevertheless, the last few weeks of the campaign saw a slight upward trend in the proportion of contemplators, and the proportion of pre-contemplators remained below baseline for the entire campaign period, even as the festive season approached.
A gradual increase in intentions to “not be smoking a year from now” was noted over the course of the campaign, with responses along a five point likelihood measure increasing slightly from the baseline level of just below 3.0.
Intentions and behaviours
There was no significant variation over the duration of any phases of the campaign on whether respondents had attempted to quit smoking. For example, the phase one pre-campaign level was 10%, and averaged 8% across the last three weeks of the campaign. The baseline measures in phases one and three would have been affected by the campaign commencing just after WNTD, and TARPs were probably too low to have any noticeable effect in the sample sizes in phase two.
There was no campaign effect in phase one on respondents reporting that somebody in their home was trying to get them to quit. However, the increase in this measure approached significance during phase three of the campaign, peaking in week three (p = 0.06). Again it is likely that a greater campaign onset effect would have been evident in the absence of publicity leading up to WNTD.
With respect to respondents reporting that anti-smoking advertising had promoted discussion at home, fig 11 shows an onset effect in phase one from a baseline of 27% to a peak of about 63% around week 13. The rate remained relatively high throughout the campaign. However, there was no such effect in phases two or three of the campaign.

Phase one campaign impact on discussion in household.
Composite measure of quitting intentions and activity
It is likely that the pre-campaign baseline measure of the composite measure of quitting intentions and activity, Quindex, would have been affected by WNTD activities. Nevertheless from the pre-campaign baseline level of 3.3 in phase one there was a significant onset effect in week one of the campaign to 3.8. Fig 12 suggests that the Quindex score increased from baseline and had a gradual upward trend over the duration of the campaign.

Phase one Quindex and media weight.
Quindex appears to be a cumulative effect variable, but also shows some variation by media weight. That is, after TARPs levels exceeding 200 in most weeks, Quindex rose to around 4.5 by week seven of the campaign. It then declined as the TARPs levels declined, to about 3.8 at week 15, before slowly increasing towards the end of the campaign period and was 4.4 for the last three weeks of the campaign. On 22 September 1997, the pharmaceutical company Pharmacia & Upjohn launched a television advertising campaign for 2 mg Nicorette gum, as a smoking cessation aid. This corresponded roughly with the start of the second rise in the Quindex measure.
There were no significant effects for the phase two and three campaigns with much lower TARPs.
DISCUSSION
Creative execution, message content, and media weight
Unprompted recall of anti-smoking advertising, cued recall of any anti tobacco advertising, validated recall of campaign advertising, and advertisement recognition appear related to advertising weight. In general, the greater the total TARPs for an advertisement or campaign in total, the greater the recall and recognition. However, advertisement cut-through is clearly mediated by the message of the advertisement and the creative execution.
Given actual TARPs levels, artery clearly performed better than lung and tumour in cut-through and recognition measures. However, there was also some indication that there was respondent confusion between the visually similar lung and tumour advertisements. This may suggest that anti tobacco advertisements, for increased effectiveness, need to be distinctly different in execution from other anti tobacco advertisements, or, that visually similar advertisements should not be aired simultaneously.
Artery is not only different from previous advertisements in both execution and message content, and different from lung and tumour (which are quite similar in execution and hence perceived message), but there is a clear figure ground distinction in artery’s execution (ie the squeezed artery), which may be more easily encoded and later recognised or recalled by the viewer. This figure ground distinction is not a feature of lung or tumour.
Brain and tar are also distinctive in execution and message content, and have clear figure ground formats. Eye, on the other hand, is more like lung and tumour in that there is no human intervention and no clear figure ground distinction. Brain achieved as high a cut-through as did eye with far lower TARPs, and tar achieved far higher cut-through than eye with comparable TARPs. These executional elements need to be investigated further. Another factor influencing cut-through of eye may be that blindness and smoking is less well-established in memory than tar and smoking. Advertisements dealing with a well known health consequence may be more readily recalled than those dealing with a new issue.
Artery was used more often (than the other advertisements) as a graphic in newspapers, posters, and billboards, so this may have contributed to its superior performance over the other advertisements in phase one. However, this is unlikely to be a complete explanation of its superiority. For example, in phase two in Melbourne, although receiving only 20 TARPs, artery achieved a greater cut-through than call for help, and peaked at 20%. In Sydney, artery achieved a cut-through of 10% in phase two without any TARPs. The recall of artery in both cities in spite of low or zero exposure, may be due to a number of factors. It may be that exposure to any of the campaign advertisements generates recall of this high impact advertisement that was the primary launch advertisement of the campaign. However, artery did receive almost 150 TARPs in Melbourne and almost 50 TARPs in Sydney in March 1998—which may account for some of the recall of artery in April and May 1998.
In both phases two and three, the call for help modelling advertisement, in spite of far greater TARPs, had far less impact than the graphic health effects brain, tar, and eye advertisements in terms of campaign salience and cut-through measures. This suggests that health effects advertising has more impact than non-health effects advertising on smokers in general, whereas advertisements like call for help probably act directly on those in the “ready for action” stage.
Optimal media weight and scheduling
It is difficult to draw firm conclusions as to what are the optimal levels of media weight from the data presented here. It is clear that the levels used through the last months of phase one of the campaign generally did not evoke the activity of the earlier period. Whether the size of the drop made the latter less cost effective is presently unclear. There is a need to experiment with media weights and to have more surveying when there is no activity to get a better understanding of possible natural variation.
In this regard it needs to be understood that different advertisements may need different weights to have equivalent effects—the data from the present survey suggest that artery had more impact than the others. Other factors that need to be considered include how the TARPs should be spaced to achieve optimum impact. It is presently unclear whether regular showings on low rating programmes have different effects to fewer showings on high rating shows and to what extent there is decay between viewings. For instance, it is unknown whether 100 TARPs per week for two weeks is equivalent, better, or worse than 200 TARPs one week and none the next.
Dependent measures and media weight
Given the confounding of WNTD activities in phases one and three, and the short duration and low TARPs levels in phase two, conclusions with respect to the relationship between various communication effects and media weight are limited. Nevertheless, some appear to show an onset effect (eg advertisement impact on likelihood of quitting), others a cumulative effect (eg stage of change), and others show both (ie the QUINDEX measure). That is, while there was no discernible short term effect on self reported quitting, there appears to be a clear advertising effect on a number of variables that are precursors of quitting (ie attitudes towards quitting), and variables such as communication with others that facilitate quitting. On the other hand, other variables showed no change (eg likelihood of getting ill from their smoking). It may well be that ill health effects are already well established or that the pre-campaign activity inflated this measure prior to commencement of the tracking surveys. There is a need to identify other measures related to beliefs, attitudes, and behaviours that show sensitivity to media weight and scheduling variables.
A major benefit of CIT is that it allows experimentation with various media weights to assess optimal expenditure of funds. Over time, the relationship between TARPs levels and advertising impact can be measured, as can differences between creative approaches. For example, by varying media weights during the course of a campaign (or over different campaigns), thresholds above which there are diminishing returns—and below which there is a nil effect—can be established for various campaign effects. Similarly advertising cut-through may plateau beyond some threshold of TARPs and may require some minimal TARPs level to even register.
Future campaigns that are tracked via CIT should systematically vary TARPs, flighting schedules, and advertisement type, so as to maximise information about these variables and their interactions. Further, there is a need to explore continuing effects of the advertisements during periods when they are not being broadcast.
CONCLUSIONS
Notwithstanding the confounding effect on various dependent measures of pre-campaign activities, this study shows the merits of tracking campaign effects as they occur, and the potential for gathering insights over time with the accumulation of such data.