Article Text

Abstract
Objective Using data on fine particulate matter less than 2.5 μm (PM2.5) concentrations in smoking and non-smoking homes in Scotland to estimate the mass of PM2.5 inhaled by different age groups.
Methods Data from four linked studies, with real-time measurements of PM2.5 in homes, were combined with data on typical breathing rates and time-activity patterns. Monte Carlo modelling was used to estimate daily PM2.5 intake, the percentage of total PM2.5 inhaled within the home environment and the percentage reduction in daily intake that could be achieved by switching to a smoke-free home.
Results Median (IQR) PM2.5 concentrations from 93 smoking homes were 31 (10–111) μg/m3 and 3 (2–6.5) μg/m3 for the 17 non-smoking homes. Non-smokers living with smokers typically have average PM2.5 exposure levels more than three times higher than the WHO guidance for annual exposure to PM2.5 (10 μg/m3).
Conclusions Fine particulate pollution in Scottish homes where smoking is permitted is approximately 10 times higher than in non-smoking homes. Taken over a lifetime many non-smokers living with a smoker inhale a similar mass of PM2.5 as a non-smoker living in a heavily polluted city such as Beijing. Most non-smokers living in smoking households would experience reductions of over 70% in their daily inhaled PM2.5 intake if their home became smoke-free. The reduction is likely to be greatest for the very young and for older members of the population because they typically spend more time at home.
- Secondhand smoke
- Environment
- Advocacy
Statistics from Altmetric.com
Introduction
There is clear evidence that exposure to secondhand tobacco smoke (SHS) is associated with a wide range of adverse health events, including respiratory and cardiovascular morbidity.1 Many governments have introduced measures to restrict population exposure to SHS within workplace and leisure settings, and in Scotland, the first national policy with an aim of reducing children's exposure to SHS by 50% by 2020 was recently announced.2 Smoke-free (SF) legislation in many countries has seen considerable focus on quantifying SHS concentrations within indoor workplace settings. Fine particulate matter (PM2.5) has been widely used as a marker for SHS exposure, with data from bars and restaurants3 showing 1 min concentrations of SHS-derived PM2.5 that frequently exceed the US Environmental Protection Agency (US-EPA) 35 μg/m3 ‘unhealthy for sensitive groups’ 24 h limit4 or the 25 μg/m3 24 h (10 μg/m3 annual) WHO5 guidance limits for PM2.5. While researchers and policymakers have used these data to communicate the effects of SHS on indoor air quality, there has tended to be a disconnect between public perception of SHS-derived PM2.5 and the hazard of outdoor air pollution.
Public interest in outdoor air quality is high, particularly when specific weather-related or industrial air pollution events occur.6 National and international air quality guidance is based on substantial epidemiological literature, showing that high concentrations of air pollution can increase the risk of respiratory and/or cardiovascular ill health.7 ,8 PM is a well-recognised component of air pollution and is estimated to produce a global burden of 2.1 million premature deaths each year.9
The main outdoor sources of PM include exhausts from motor vehicles and industrial emissions. Time series studies suggest that an increase in outdoor concentrations of PM less than 2.5 μm in diameter (PM2.5) of 10 μg/m3 is associated with an overall population increase in cardiopulmonary mortality of about 5–10%.8
Most epidemiology has focused on outdoor PM2.5 measurements with much less known about the concentrations of PM2.5 within indoor microenvironments. Data indicate that we tend to spend a majority of our time indoors.10 In most households, exposure to PM2.5 arises from infiltration of outdoor pollution, with indoor levels of PM2.5 in non-smoking homes typically being about 60–70% of those outdoors.11 There are also sources of PM2.5 within the indoor setting, and a significant contributor to domestic PM2.5 concentrations is smoking activity since cigarette/tobacco combustion produces a substantial aerosol of fine PM with a median diameter of about 0.2 μm12; PM2.5 concentrations in smoking homes can reach 1 min peaks of several 1000 μg/m3.13
Despite airborne PM being a heterogeneous mixture arising from various sources and having a wide range of chemical and physical properties, there is a remarkable consistency in the epidemiological data; recent work argues that it is reasonable to assume that fine PM will act in a broadly similar way on the cardiopulmonary system whether it is produced from tobacco or diesel combustion.14
Given that a substantial proportion of human activity takes place at home and that SF laws now mean that exposure to SHS in leisure and workplace settings is often prohibited, there is a need to better understand SHS-PM2.5 exposures in homes and how these compare to exposure to outdoor air pollution. This paper describes data from four studies (two previously published), where SHS was measured in homes in Scotland, and presents a highly novel consideration of the potential intake of PM2.5 under typical exposure/lifestyle scenarios for a number of population subgroupings. These figures are compared with PM2.5 intake estimates for those living in SF homes and those living in heavily polluted urban environments in order to provide scientists from the air pollution and tobacco control communities with data that may help each learn from the other.
Methods
Recruitment and source of data
Data on PM2.5 were brought together from four studies carried out in Scotland between 2009 and 2013. Details of two of these projects (Indoor Air Pollution and Health—IAPAH; and Reducing Families’ Exposure to Second-hand Smoke in the Home—REFRESH) have previously been published.13 ,15 ,16 IAPAH was carried out from October 2009 to March 2010, while REFRESH data were acquired from July 2010 to March 2011. The other two data sets come from a cross-sectional study based at the Royal Aberdeen Children's Hospital (RACH) carried out in June and July 2012, and a small feasibility study based within a health board in central Scotland (SCOT) where sampling was completed between December 2012 and March 2013. Recruitment methods for IAPAH and REFRESH are described in detail elsewhere,13 ,16 but in summary, IAPAH included participants who responded to posters and press adverts seeking volunteers to allow measurement of air quality parameters in their home. Participants had to have one type of household combustion source (a coal fire, a peat fire, a wood fire, gas cooking or smoking activity), and it is worth noting here that most participants were elderly and no children were resident in any of the IAPAH smoking homes. REFRESH was a pilot study of an intervention to provide smoking mothers, with a child <6 years old, with air quality feedback as a way of encouraging behavioural changes towards a SF home. REFRESH participants were recruited through primary healthcare providers.
The RACH study recruited households through parents attending a children's respiratory clinic at a regional hospital in the North East of Scotland. A subset of those who completed a questionnaire on their child's exposure to SHS were invited to have PM2.5 measured in their home.
The SCOT study was a feasibility study of a new air quality monitoring instrument17 to deliver an air quality-based intervention similar to REFRESH. SCOT was embedded within an early intervention programme that works with young mothers and their families in need of support. One or more authors of this paper were involved in data collection in each of the four studies presented here. SHS-PM2.5 data from the SCOT and the RACH studies have not been previously published.
In all four studies, homes where there was likely to be a significant additional source of PM2.5 (eg, coal or solid-fuel fire) were excluded. It is worth noting, however, that data from the IAPAH study (and not included here) show that coal, peat and wood burning homes in Scotland did not have significantly higher PM2.5 concentrations compared with gas-heated homes,13 suggesting that these sources are unlikely to substantially increase PM intake profiles.
Measurement of PM2.5 in households
The IAPAH, REFRESH and RACH studies all used the same method to assess PM2.5 concentrations. A Sidepak AM510 Personal Aerosol Monitor (TSI Inc, Shoreview, Minnesota, USA) was placed in the main living area of participants’ homes for a period of 24 h. The device uses light scattering to measure and log concentrations of PM2.5 every minute. It has been widely used in studies measuring SHS in the hospitality industry with a correction factor of 0.295, which is typically applied to correct for differences between SHS aerosol compared with the device calibration standard of Arizona Road Test Dust.3 Prior to each use the instruments were cleaned, zero-calibrated, set at a flow rate of 1.7 L/min and positioned, where possible, at a height of approximately 1 m and away from doors or windows.
The SCOT study utilised a new, low-cost, particle-counting device, the Dylos DC1700 (Dylos Corporation, Riverside, California, USA). This device uses similar light-scattering technology to count particles across two size ranges: >0.5 and >2.5 μm in diameter. Previous work comparing measurements of SHS aerosol from the Sidepak and Dylos instruments has enabled the generation of a calibration equation to convert Dylos data to an equivalent PM2.5 mass concentration as measured using a Sidepak.17 For the SCOT study, Dylos devices were again placed in the main living area of participants’ homes. Devices measured and logged PM2.5 levels every minute for up to 7 days.
In all four studies, ‘smoking households’ were defined as households where one or more adult residents were smokers. Data from non-smoking homes (defined as homes where all residents were non-smokers) gathered as part of the RACH study were used to provide comparisons between smoking and non-smoking homes.
Response rates, numbers recruited and duration of sampling
A total of 11 smoking households were recruited from the Scottish arm of the IAPAH study. Recruitment was via response to local adverts and limited to this number due to the study design; therefore, a response rate cannot be calculated. Fifty-three smoking households were recruited and measured from a total of 1693 invited to take part in the REFRESH study, a response rate of 3.1%. Twelve smoking households took part in the SCOT feasibility study, 80% of the 15 who were invited to take part. Recruitment to the RACH study was a two-stage process: 390 parents took part in our questionnaire study on SHS from 1000 who were invited (39%). Of those who completed the questionnaire, 131 (34%) indicated an interest to have air quality measured in their home, and of these, 47 were randomly contacted in order to recruit 17 smoking and 17 postcode matched non-smoking homes. Where an intervention was carried out (REFRESH and SCOT), the data presented are only the air quality measurements made at baseline (ie, before any SHS-related educational feedback had taken place). In total, the four linked studies produced air quality data from 93 smoking homes with a further 17 non-smoking households. The majority of sampling was for a 24 h period with the exception of the SCOT study data, which was generally carried out over a period of 6–7 days; in addition, two homes in REFRESH and two in IAPAH were sampled for less than 24 h. The total duration of 1 min resolved PM2.5 data gathered from the smoking homes was 3,957 h with 414 h from the non-smoking homes.
Inhaled PM2.5 intake estimates
Inhaled PM2.5 intake was modelled for four types of non-smoking male residents living in either smoking or SF homes: a 2-year-old child; an 11-year-old school-aged child; a 40-year-old working adult and a 70-year-old house-bound adult. Male data were used as the higher breathing volumes to provide the worst-case values. Intake is defined as the mass of PM2.5 inhaled, but it should be noted that a proportion of this is likely to be exhaled with a fraction being trapped in the airways or crossing the absorption barrier of the lungs.
To take account of variability, model parameters were assigned distributions based on available data and best estimates. Male respiration rates were assigned triangular distributions with 5th and 95th centile measurements from the US EPA Exposure Factors Handbook18 used as minimum and maximum values, and these were applied to four microenvironments (home-night, home-day, non-home indoor and outdoor) for each of these age bands, assuming a mix of sleeping, sedentary, light and moderate activity to broadly reflect the time-activity profiles presented from the UK Time Use Survey.19 Data for children were estimated using the US Exposure Factors Handbook20 combined with assumptions relating to personal experience. Time-activity model inputs were assigned normal distributions (table 1). To ensure that the variability in time-activity data did not lead to daily durations that did not sum to 24 h, the largest duration component, time at home during the day in all cases, was set to 24 h minus the time allocated to the three other microenvironments.
Time spent in each microenvironment by activity level for each type of resident. All distributions are normal with values in minutes (mean, SD, (upper and lower bound))
The distribution of PM2.5 concentrations in smoking homes was generated from our data set and was log-normally distributed. To reflect temporal variation in household PM2.5 concentrations brought about by smoking activity, the 24 h cycle was split into a 16 h (8:00–midnight) ‘day-time’ period and an 8 h (midnight–8:00) ‘night-time’ period. The overall 24 h PM2.5 average in smoking homes was then corrected to reflect the generally higher PM levels measured as a result of smoking activity during the day as opposed to night-time. This weighting was derived from time-course analysis of the REFRESH data.15 From our combined data set, median day-time levels were 35 μg/m3, a SD of 119 μg/m3 with lower and upper bounds of 5 and 1000 μg/m3; night-time median values were 23 μg/m3, SD 78 μg/m3 with bounds of 5 and 1000 μg/m3.
Non-smoking homes had median PM2.5 concentrations of 3 μg/m3, SD 10 μg/m3 and bounds of 0 and 50 μg/m3. Concentrations in non-smoking homes were assumed to be broadly uniform over the 24 h cycle.
Outdoor concentrations in Scotland were assigned a mean of 8.5 μg/m3, SD 25 μg/m3 and bounds of 0 and 150 μg/m3, based on data for an urban PM2.5 monitoring site in Aberdeen, Scotland.21 For comparison purposes, and given the regular media coverage of air pollution in large international urban cities, we generated an average value for outdoor PM2.5 concentrations using average annual PM10 concentrations reported by the WHO22 for five global cities (Beijing, Bangalore, London, Moscow and Athens). These data were aggregated to give a value of 63 μg/m3. PM2.5 concentrations were approximated to be two-thirds of this PM10 value11 ,21 producing an outdoor PM2.5 mean of 41 μg/m3, SD 40 μg/m3 and bounds of 10 and 500 μg/m3 for a resident living in a polluted urban environment. All work and other indoor spaces were assumed to be SF and without any significant PM sources; for non-smoking settings a mean indoor:outdoor ratio of 0.66 (triangular distribution with minimum of 0.4 and maximum of 1.0)11 was applied to the relevant outdoor PM2.5 value to generate the indoor concentration.
The model and distribution data were set up in Microsoft Excel with a Monte Carlo simulation plug-in (@Risk software V.6, Palisade, Middlesex, UK). The model was run for 10 000 simulations to produce a distribution of: estimated PM2.5 24 h (μg/m3), daily PM2.5 intake (μg/day); the percentage of total PM2.5 inhaled within the home environment; and the percentage reduction in daily intake that would be achieved by switching to a SF home, for each household-resident type.
Box 1 provides an illustration of the model and how the intake (μg/day) estimate was derived for an 11-year-old child living in a smoking home.
Box 1 Illustration of the model and how the intake (μg/day) estimate was derived for an 11-year-old child living in a smoking home (C=particulate matter (PM)2.5 concentration in μg/m3; T=time in hours spent in that microenvironment; BR, breathing rate in m3/h)
 where Chome-night=36 μg/m3, Chome-day=46 μg/m3, Cnon-home indoor=5.1 μg/m3, Coutdoor=7.4 μg/m3, Thome-night=6.4 h, Thome-day=10.1 h, Tnon-home indoor=6.3 h, Toutdoor=1.2 h, BRhome-night=0.332 m3/h, BRhome-day=0.388 m3/h, BRnon-home indoor=0.522 m3/h, BRoutdoor=1.446 m3/h, intake=287 μg/day (parameter values taken from one example simulation within the Monte Carlo model).
Results
Measured levels of PM2.5
Table 2 shows the duration of sampling, time-weighted average and maximum 1 min PM2.5 concentrations across the smoking and non-smoking households. Values are medians with IQR in parenthesis. Overall, the median value across all 93 smoking homes was an order of magnitude higher than the SF homes (31 vs 3 μg/m3). However, there was a wide degree of variation in concentrations between the four studies with the IAPAH and SCOT studies producing concentrations about 10 times higher than those measured in the REFRESH and RACH participants’ homes. Across all smoking homes (n=93) the IQR is large (10–111 μg/m3), indicating that approximately 25% of these homes experience 24 h average PM2.5 concentrations in excess of 111 μg/m3, or more than 11 times the recommended annual limit from the WHO.
Summary statistics for air sampling results by smoking home divided by study and for SF homes
Intake estimates
Generated intake estimates for each exposure scenario are provided in table 3. The table also provides 24 h average PM2.5 concentrations for each resident and age type, and a percentage of daily intake received within the home. The percentage reduction in daily inhaled PM2.5 intake that could be achieved for those living in a smoking home undergoing a change to a SF home is also given.
Inhalation intake estimates for each exposure scenario
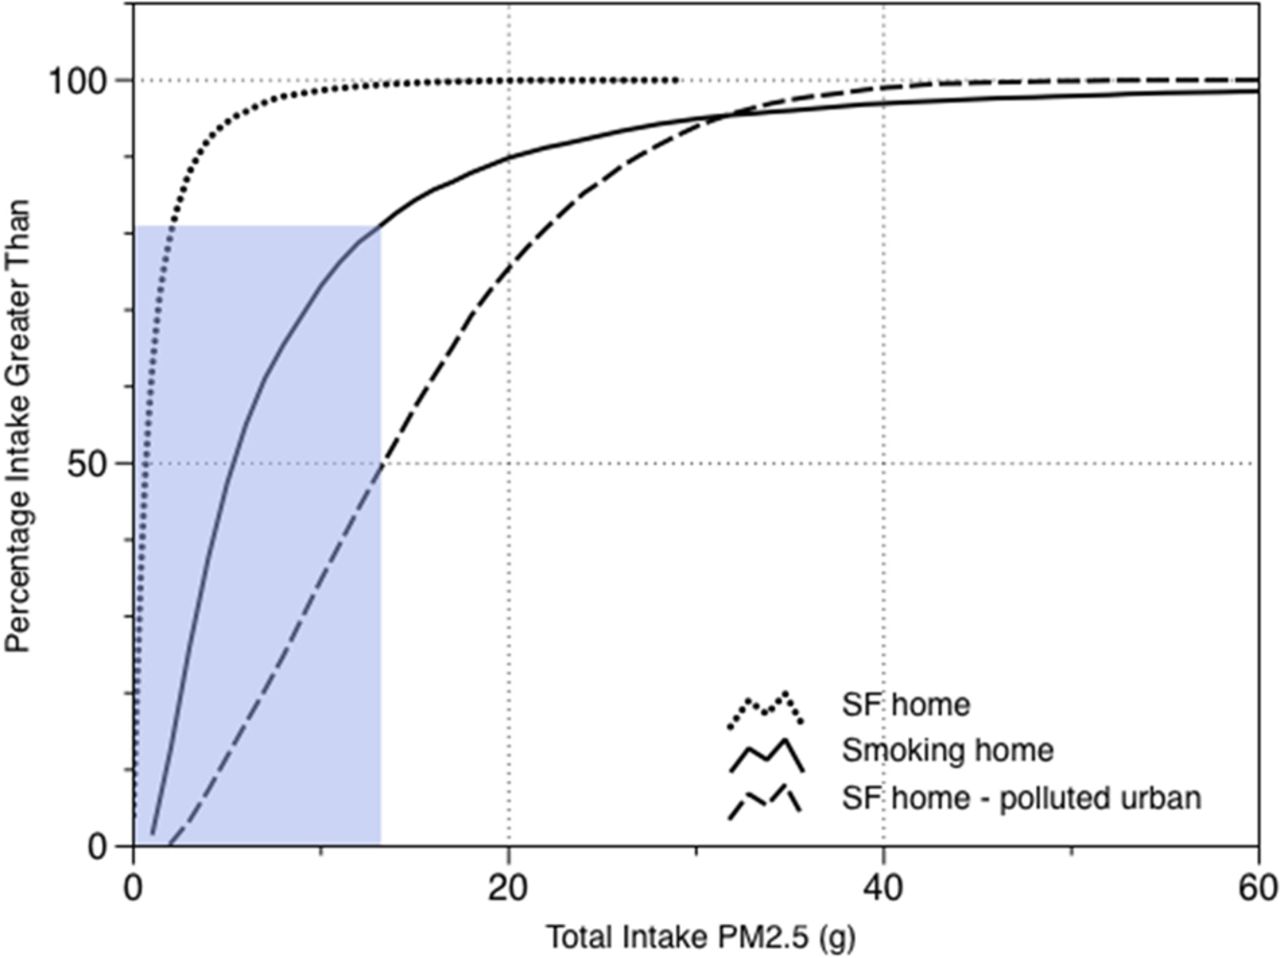
Lifetime inhaled PM2.5 intake estimates were calculated. These used the daily intake calculated for each person type. The 2-year-old child intake value was applied for the first 5 years of life; the value for the 11-year-old child was used for the next 13 years; the working adult intake for a period of 52 years (18–70); and the elderly housebound intake for a further 10 years, to give a very broad comparative lifetime PM2.5 intake for those living in smoking, SF and heavily polluted urban environments. The distribution of these estimates is provided in figure 1. The median value for those living in SF homes in Scotland is 0.76 g of PM2.5 over a typical lifetime, while the median estimate for those living a life in a smoking home (but not smoking themselves) is more than seven times that amount at 5.82 g. Figure 1 illustrates that approximately 20% of those living in smoking homes in Scotland will inhale a lifetime mass of PM2.5 greater than the median value predicted for a non-smoker living in a heavily polluted urban setting.
Cumulative probability plot showing estimated lifetime particulate matter (PM)2.5 intake for non-smokers living 80 years in a smoke-free (SF) home (dotted), living in a smoking home (solid) or living in a SF home within a highly polluted urban environment (dashed). The shaded box illustrates that approximately 20% of those living in a smoking home will have a lifetime intake equal or greater to that of the median level of a non-smoker living in a highly polluted urban environment.
Discussion
This is one of the largest studies to look at measurements of PM2.5 within smoking homes in the UK. Concentrations of PM2.5 in smoking homes are clearly much higher than those measured in non-smoking homes: all four groups of smoking homes produced median values that were at least three times higher than the value for the SF homes. There are wide differences in the concentrations measured between the studies, and this is likely to be due to differences in the populations from which the samples were drawn. The highest median was measured in the IAPAH study (198 μg/m3), and participants in that study were generally elderly and with no children living within the smoking homes sampled. PM concentrations were much lower in the REFRESH and RACH studies and this may reflect either selection or recruitment bias. For REFRESH, smoking participants were invited to be involved in an intervention study to reduce SHS concentrations in their home, while in the RACH study adult participants were recruited while attending a children's hospital clinic where many of their children would have had respiratory conditions. It is possible that having a child with a condition such as asthma may modify household smoking behaviour and reduce PM concentrations at home, although Diette et al23 found no evidence for differing PM levels homes of 2–6-year-old children with and without asthma. Deprivation is also likely to play a role in the amount of smoking activity and the existence of household smoking rules.24 The high concentrations that we report in the SCOT study from a socially deprived area suggest that households containing children are not uniformly lower than adult-only households in terms of SHS concentrations. The SCOT sample of homes produced a broadly similar median value of PM2.5 to the IAPAH group (150 vs 198 μg/m3), despite having infants resident in these homes. Again, there is a potential for recruitment bias within this study because field workers were asked to identify smoking households to test the feasibility of using a new air quality monitor, and so may have sought to recruit those homes where they perceived higher SHS exposures during their home visits. Overall, taking the PM data and sample groups from across the four studies, there is a suggestion that homes where unrestricted, heavy-smoking activity takes place produce SHS concentrations that are, on average, about 10 times higher than homes where efforts to reduce or restrict SHS exposure may be more common. From our observations, it seems possible that smokers living with children are more likely to restrict their household smoking behaviour to reduce their children's exposure to SHS, and this certainly reflects the views and attitudes expressed by many of the parents who took part in the qualitative interviews of the REFRESH study.25
The PM2.5 results presented here can be compared with those in the literature. Data from the US26 examining air quality in inner-city homes of children with asthma indicated that smoking households had PM2.5 concentrations 37 μg/m3 higher than non-smoking homes. Similar work by Breysse et al,27 again in a cohort of US inner-city asthmatic children, suggested that smoking homes had PM2.5 concentrations 33–54 μg/m3 higher than non-smoking homes. McCormack et al,28 from the same group, report smoking homes with an average PM2.5 concentration 26 μg/m3 higher compared with those measured in non-smoking homes. Recent work in Syracuse in New York29 presented data for infants at risk of asthma and found that in the 70 homes with a household smoker, the geometric mean PM2.5 concentration was 26 μg/m3. It is worth noting that our study did not consider the possibility of SHS ingress from neighbouring homes within multiunit housing. There is some evidence to suggest that SHS can be transported through ducting, house fittings and ventilation systems,30 although this is unlikely to have produced substantial bias in this data set.
Our study used measured household PM concentrations to provide some estimates of inhaled PM intake for a range of exposure scenarios. Across all scenarios, the median percentage of total daily PM2.5 inhaled within the home is typically between 84% and 100% for those living in smoking homes. Unsurprisingly, young preschool children and elderly housebound adults receive the highest proportion of their PM2.5 intake at home, with a 2-year-old child living in a smoking home receiving as much as 91% of all of the PM2.5 they breathe in a typical day within their home environment. For this child, improvements in outdoor air quality will have negligible impact on their PM2.5 intake, while targeted intervention programmes that encourage his or her parents to implement SF household rules will clearly produce a step change in the mass of PM2.5 they inhale.
Extending these data to a simple model of lifetime intake of PM2.5 provides information on how much additional PM2.5 is inhaled by those living in homes where smoking takes place. These lifetime estimates of mass intake are likely to be much easier for lay populations to understand compared with the complex concept of airborne concentration and may prove a useful tool for those involved in tobacco control activity to present information on the impact of smoking at home on the air we breathe. The overall mass of PM2.5 inhaled over an 80-year period for a person living in a typical SF home is about 0.76 g compared with a similar person living in a smoking home, who would inhale about 5.82 g. This 5 g lifetime difference represents the additional PM inhaled by a non-smoker living with a smoker and, by epidemiological data,1 is associated with clinically meaningful increases in risk for a wide variety of disease processes. Assuming an average of 14 mg of PM2.5 inhaled per smoked cigarette,31 a non-smoker living in a smoking home inhales a similar mass of fine PM that a person would inhale if they smoked 1 cigarette every day for about 1 year of their life. It is worth noting here that a smoker with a 20 cigarette per day habit over a 62 year (18–80 years) period has a lifetime mass intake of 6.3 kg PM2.5.
Examining the 24 h average PM2.5 exposure experienced by those living in smoking homes is also informative. In all SF home scenarios, the median 24 h average value of PM2.5 exposure is below the WHO annual guidance limit of 10 μg/m3. Conversely, all scenarios for those living in smoking homes exceed the WHO annual guidance, often by several times. A 2-year-old child living in a median smoking home experiences a 24 h PM2.5 exposure of 38 μg/m3, almost four times the WHO annual guidance limit.
There are clearly major issues about the representativeness of the population of smoking households within our sample. Selection and recruitment bias are possible, and to this we must add the possible behavioural bias that may be introduced by placing measurement equipment in a home over a single 24 h period. It is possible that participants may modify their behaviour by smoking less or smoking outside in order to produce results that they consider to be more ‘acceptable’ to the researcher. We note, however, that there was no evidence of lower PM2.5 concentrations on the first day compared with the other days of measurement in the SCOT study data set, suggesting that short-term behavioural changes were not made, at least in this group. It is also worth noting that our simplistic modelling assumed no other exposure to SHS beyond that experienced in home settings. Exposure to SHS in cars could be considered in future work, although we think that those exposed to SHS in cars are also likely to be exposed at home, and due to the greater time spent at home, the additional intake from short car journey exposure is likely to be small.
The inhalation rates used to generate the PM2.5 intake by different age groups within different microenvironments are estimates based on broad assumptions of time spent in each and the typical level of activity undertaken within that environment. While these assumptions will have introduced some degree of error, they are applied evenly across participants living in smoking and non-smoking homes, and so while the absolute values may be subject to error, the relative differences should not be influenced by any underestimation/overestimation of inhalation rates. Our work also assumes that PM2.5 concentrations in homes are spatially uniform throughout the home due to high-levels of air mixing throughout the living space. There is a need for more data to determine spatial variability in SHS-PM2.5 in homes where smoking takes place and how this may vary depending on the type and age of home construction. Similarly, we have assumed that the life course can be split into a small number of life eras that are uniform in terms of activity. This is clearly a broad assumption designed to provide manageable models of lifetime exposure. Again, it is worth noting that these assumptions are applied equally to participants in smoking and non-smoking homes, and so, relative differences between the groups are unlikely to be influenced by such methods.
Conclusions
Fine PM concentrations in homes where smoking takes place are considerable, and from the data presented here from more than 90 homes in Scotland, the average smoking home has PM2.5 concentrations 28 μg/m3 greater than measured in non-smoking households. The range of PM2.5 concentrations measured in smoking homes is large, with approximately 25% of these homes having 24 h average concentrations in excess of 111 μg/m3, more than 11 times that recommended as an annual average concentration by the WHO. For the substantial proportion of the Scottish population exposed to SHS at home, indoor air pollution from smoking activity dwarfs that from outdoor sources. All age groups of the population who currently live in smoking homes are likely to experience reductions in their total daily PM2.5 intake of over 70% if their domestic arrangements became SF. These findings ultimately support the need for efforts to reduce SHS exposure in the home, mostly notably through the implementation of SF home rules and SF multiunit housing policies.
What this paper adds
Particulate matter (PM)2.5 concentrations in smoking households in Scotland are about 10 times those found in non-smoking homes.
Many non-smokers living in smoking homes inhale similar quantities of PM to non-smokers who live in smoke-free homes in a heavily polluted urban environment, such as Beijing or London.
Non-smokers living in smoking households would experience reductions of over 70% in their daily inhaled PM2.5 intake if their home became smoke-free. The reduction is likely to be greatest for the very young and for older members of the population.
The additional mass of PM2.5 inhaled by a non-smoker who lives with a smoker is about 5 g over a lifetime; yet the epidemiological evidence suggests that this small mass increase has significant implications for health.
Acknowledgments
We would like to thank all participants who took part in the various studies. We also thank Carole Garden who collected the household data in the IAPAH project and the First Steps workers who assisted with data collection for the SCOT project. We also acknowledge Karen Galea and Laura MacCalman of the Institute of Occupational Medicine and Heather Morgan of the University of Aberdeen for their critical reviews of the manuscript.
References
Supplementary materials
Press release
Files in this Data Supplement:
Footnotes
Contributors SS wrote the first draft of the manuscript and is the guarantor for this study. All authors were involved in the study design, data analysis and interpretation, and made contributions to the final manuscript.
Funding Some of the data collected and described here were from studies funded by the following sources: the Big Lottery Fund, the Irish Environmental Protection Agency and a small grant from the Tobacco Control group of the Scottish School of Public Health Research.
Competing interests None.
Ethics approval The various studies were approved by the North of Scotland Ethics Review Committee and the University of Aberdeen College of Life Sciences Ethics Review Board.
Provenance and peer review Not commissioned; externally peer reviewed.
Data sharing statement The @Risk Monte Carlo modelling file is available on request. Users will require a licence for @Risk to be able to run this file in Microsoft Excel.