Article Text

Abstract
OBJECTIVE To use geographic information systems data and analyses to describe locations and characteristics of tobacco billboards in a large metropolitan area, and to assess the extent to which tobacco companies are locating billboards in close proximity to minority neighbourhoods and schools.
DESIGN Observational study of billboards in a large metropolitan region.
SETTING City and county of St Louis, Missouri.
PARTICIPANTS All stationary billboards in the city and county of St Louis were eligible to be observed, with the exception of bus stop and street side retail advertising signs (for example, cigarette advertising at gas stations). A total of 1239 non-blank billboards were observed. All data were collected in early 1998.
MAIN OUTCOME MEASURES Tobacco and non-tobacco billboard geographic distribution; billboard type and product brand frequencies; and billboard neighbourhood characteristics.
RESULTS Almost 20% of the billboards contained tobacco advertising. Four of the top five and nine of the top 22 brands displayed on billboards were tobacco products. Billboards were located in all areas of St Louis except for the communities with the highest average incomes. Tobacco billboards were more likely to be found in low income areas and areas with a higher percentage of African Americans. Images of African American figures on tobacco billboards were concentrated in the most heavily African American populated regions of the city. Approximately 74% of all billboards in the city of St Louis were within 2000 feet (700 metres) of public school property.
CONCLUSIONS Tobacco products were the single most heavily advertised type of product on billboards in St Louis. The geographic distribution of tobacco billboards, as well as the types of images found on these billboards, is consistent with the hypothesis that tobacco companies are targeting poor and minority communities with their advertising. Methods employing geographic information systems are a powerful technique for examining outdoor tobacco advertising.
- tobacco advertising
- billboards
- maps
- geographic information systems
Statistics from Altmetric.com
In early 1999 a dramatic change occurred in the urban landscapes throughout the United States. As a result of the agreement between the tobacco industry and various state attorneys general, all outdoor billboard advertising of tobacco products was removed. This represents a seismic shift in the manner that tobacco products are advertised, matched only by the restriction on television advertising implemented almost 30 years earlier. Although almost everybody in the public health and political arenas agreed that outdoor advertising needed to be restricted, there has been surprisingly little hard data on how billboards have been used to sell tobacco products to various markets in this or other countries. The purpose of this study is to provide an empirical description of billboard advertising in a large metropolitan area shortly before the billboard ban went into effect, and to assess the extent to which tobacco companies used billboards to target poor and minority populations.
TOBACCO AND ADVERTISING
Cigarettes are one of the most heavily advertised and promoted products in the United States.1 According to the Federal Trade Commission, cigarette advertising and promotion totalled US$5.3 billion dollars in 1996.2 Outdoor advertising spending totalled $292.3 million, an increase of $18.6 million dollars from 1995 and representing 5.7% of total advertising and promotional spending. Advertising on tobacco products has more than doubled in the past decade, and many have linked the increasing rates of teen smoking with this pattern of increased advertising.3 4
Tobacco companies continue to claim that the intent of cigarette advertising is to encourage brand loyalty and brand switching among adults.5 However, a large body of empirical literature now exists that links tobacco advertising and promotion to adolescent cigarette smoking.4 6-12 Taken together, these studies demonstrate that: (1) children and youth are directly targeted by tobacco advertising13 14; (2) adolescents and children are aware of and recognise specific images and characters used in tobacco advertising campaigns15; and (3) children with the greatest awareness and most positive attitudes towards cigarette advertising are more susceptible to smoking.6 9-14Furthermore, youth buy the most heavily advertised brands, and youth brand preference change in synchrony with corresponding national advertising campaigns.16-18
BILLBOARD ADVERTISING
Billboards have provided the tobacco industry with a relatively low cost method for cigarette advertising and are used to reach either a broad audience or specific targeted population.19 In 1997, national billboard revenues totalled $2.1 billion dollars. Tobacco billboard sales ranked third among the top 10 industry categories.19 20 Because of the static location of billboards, and the fact that many people use the same travel routes to work, school, shopping, etc, billboard advertising has what the advertising industry calls a high “impression rate”. Billboards are viewed over and over again by the same people, increasing their effectiveness.
Efforts to restrict tobacco billboard advertising have been mounted in local communities with some success.21 22 Campaigns to restrict or ban tobacco billboards are a response to the perception that billboards are a form of environmental pollution,23 24 an attempt to target vulnerable populations,19 or simply that tobacco billboards are advertising a product that is a threat to the public health of the community.21 22 25 These grassroots efforts served as a springboard for provisions to ban outdoor advertising in the national settlement between attorneys general and tobacco companies in November 1998.
The national settlement provision on outdoor advertising of tobacco products bans all outdoor advertising, including: billboards, signs and placards that are in arenas, stadiums, shopping malls, and video arcades, any additional advertisements placed outdoors or in a window facing the outdoors, and transit advertising. Exceptions include advertisements on the outside of stores that carry tobacco products and ads at adult only facilities (certain time restrictions apply). This restriction on outdoor advertising is important, but it obviously only applies to the United States. Billboard advertising is likely to remain an important part of tobacco product marketing in other parts of the world.
Although the positive public health implications of tobacco advertising restrictions seem evident, there is actually minimal data showing how tobacco companies have used billboard advertising. A number of studies have described billboard placement and content in urban areas, including Chicago, San Diego, Los Angeles, and San Francisco.19 21 26-28 In Chicago investigators found that the average number of billboards in minority neighbourhoods was 150 compared to an average of 50 in white neighbourhoods.21 Los Angeles data showed a 4.6 times greater concentration of billboards in the city compared to the suburbs.26 An informal survey conducted by a community newspaper in 1994 found that in St Louis tobacco and alcohol billboards accounted for 56% of all billboards in black neighbourhoods and only 23% in white neighbourhoods.27 These results show a pattern of targeted tobacco billboard advertising in poor, minority neighbourhoods.18
Few, if any, studies have examined how billboard advertising may be used by the tobacco industry to target children and youth. In addition to the use of specific images and themes designed to appeal to children and youth, the placement of billboards in specific locations is likely to affect youth in different ways. Before the national settlement, most discussion in this area focused on the proximity of tobacco billboards to schools and daycare centres.29
These previous studies have suggested that tobacco billboard advertising is omnipresent in urban settings, and that there seems to be significantly higher concentrations of tobacco billboards in poor and minority neighbourhoods. However, these studies have tended to look at only certain parts of larger cities, and have only examined the relationship to class and race in very simple ways. By collecting data from a much larger metropolitan area, using more data from the billboards such as the type of visual images found on the billboards, and by using state of the art geographical information systems (GIS) analyses, a more detailed picture of tobacco billboard advertising can be produced.
Specifically, the goals of our study were to collect data on all billboards in the city and county of St Louis in order to examine characteristics of tobacco billboard advertising. These data would then be used to address two research questions—what are the basic characteristics of tobacco billboard advertising in St Louis, and is there evidence that tobacco billboards are used to target specific vulnerable populations in St Louis?
Methods
BILLBOARD IDENTIFICATION
Billboards were defined as outdoor stationary structures upon which advertising or public service announcements were posted. This definition included elevated signs and signs that were attached to the sides of buildings, and excluded ads on the sides and tails of buses, highway department signs, banners, posters, advertisements painted on the sides of buildings, and bus shelter advertisements. This definition corresponded to the types of billboards that were most likely to be restricted under the terms of legislation being considered in 1998.
COVERAGE AREA
Billboard observation was limited to St Louis city and county. Unlike most other cities, the city of St Louis is not a part of the county. They are separate political and economic entities. The observation area covers a majority of the St Louis metropolitan region, and within it there is enough economic and sociodemographic diversity to allow examination of location patterns of tobacco billboards. The observation area had a combined estimated population in 1997 of 1 345 500, based on current US Bureau of the Census data. In St Louis city 50.9% of the population is white and 47.5% is African American (2.8% other). Eighty four per cent of St Louis county's population is white and 14% is African American (2.8% other). In 1993 the median household income for St Louis county residents was $42 328, while it was $21 441 for the city. Twenty four per cent of the city's population is below the poverty line whereas 5% of the county's population falls under the poverty level.30 31
ROUTE IDENTIFICATION
Pilot work by the research team indicated that greater than 99% of all the billboards in the St Louis area were located on highways and major thoroughfares. Therefore, data collection occurred on four types of highways as defined by the National Department of Transportation. The four types of highways analysed were: (1) divided highways with controlled access; (2) divided highways with uncontrolled access; (3) primary state undivided highways; and (4) secondary state undivided highways and primary arterials. Secondary arterials and streets were excluded from the study. Essentially, this excluded residential areas while including all commercial and industrial zoned areas.
Routes were then planned to cover the entire observation area. Each route was covered twice, once in each direction. Overall, the study area covered all parts of St Louis city and county. All the routes together added up to over 1230 miles of road.
INSTRUMENT DEVELOPMENT
Based on pilot work, a billboard observation form (BOF) was developed to record billboard information. The BOF was designed to ensure ease of use on the road and in the office, reliability, and comprehensive information coverage. The billboard variables recorded on the form included the category of the billboard (that is, tobacco, alcohol, local, etc), brand of product or organisation name, the type of figure (sex, group, or animal), the style (text or picture), and whether the shape of the billboard was standard (rectangular) or not.
DATA COLLECTION
Routes for data collection were assigned to an observation team consisting of a driver and data recorder. As the team drove through each route the data recorder used an 8 mm video camera to record the billboards visually. The data recorder also recorded verbal information regarding billboard location and attributes. After completing a set of routes, the investigators viewed the tapes and recorded billboard observational data using the BOF. The location of each billboard was also recorded on a detailed map of the St Louis area.
ARCHIVAL DATA
In addition to the billboard data collected by the research team, the study used archival data obtained from the US Census and the Missouri Department of Transportation. Mapping data were obtained from TIGER/Line 1995 files. The TIGER (topologically integrated geographically encoding and referencing) system is the Census Bureau's national spatial data base. These files contain geographic information describing roads, political boundaries, and census boundaries (for example, block groups), among other things.32 These data are originally from the 1990 census, but have been updated by the US Bureau of the Census as well as the Missouri Department of Transportation.
Sociodemographic data describing residents of St Louis city and county were obtained from the summary tape file 3A of the 1990 US Census. The census variables used in this study are percent African American residents, and median family income by census block group. A census block group is the smallest geographic entity for which the Census Bureau tabulates sample data.33 Block groups are useful for multivariate geographical analyses, because they are small enough to contain relatively homogeneous populations, and there are enough of them in an urban area to facilitate relatively powerful statistical analyses. St Louis city and county are made up of 1307 different block groups. The median population per block group for St Louis is 801, and the median area is 0.13 square miles.
The addresses for all 103 public schools (K-12) in St Louis city were used to locate each school for the GIS analyses. To determine proximity of billboards to schools, a buffer region was calculated for each school. The buffer regions were created with a half mile radius because they are drawn and calculated based on the centre point of each school location. However, because school properties take up thousands of square feet of actual space, it is impossible to draw exact boundaries using only school address information. Therefore, we estimated that a half mile radius around the school centroids would approximate a 2000 foot (approximately 700 metre) boundary.
DATA ANALYSIS
MapInfo Professional, version 4.5, was used to create the billboard maps and perform geostatistical analyses.34 The location of each observed billboard was input into the MapInfo database so that each billboard was associated with a particular geographic position on the TIGER St Louis road maps. The accuracy of this positioning is approximately 50 feet (15 metres). Once the TIGER files and billboard data are input, they were connected with the census data using SQL programming language. This allows both geographic and statistical analyses relating billboard locations to sociodemographic factors. SPSS version 8.0 was also used for some traditional statistical analyses.
Results
DESCRIPTIVE CHARACTERISTICS
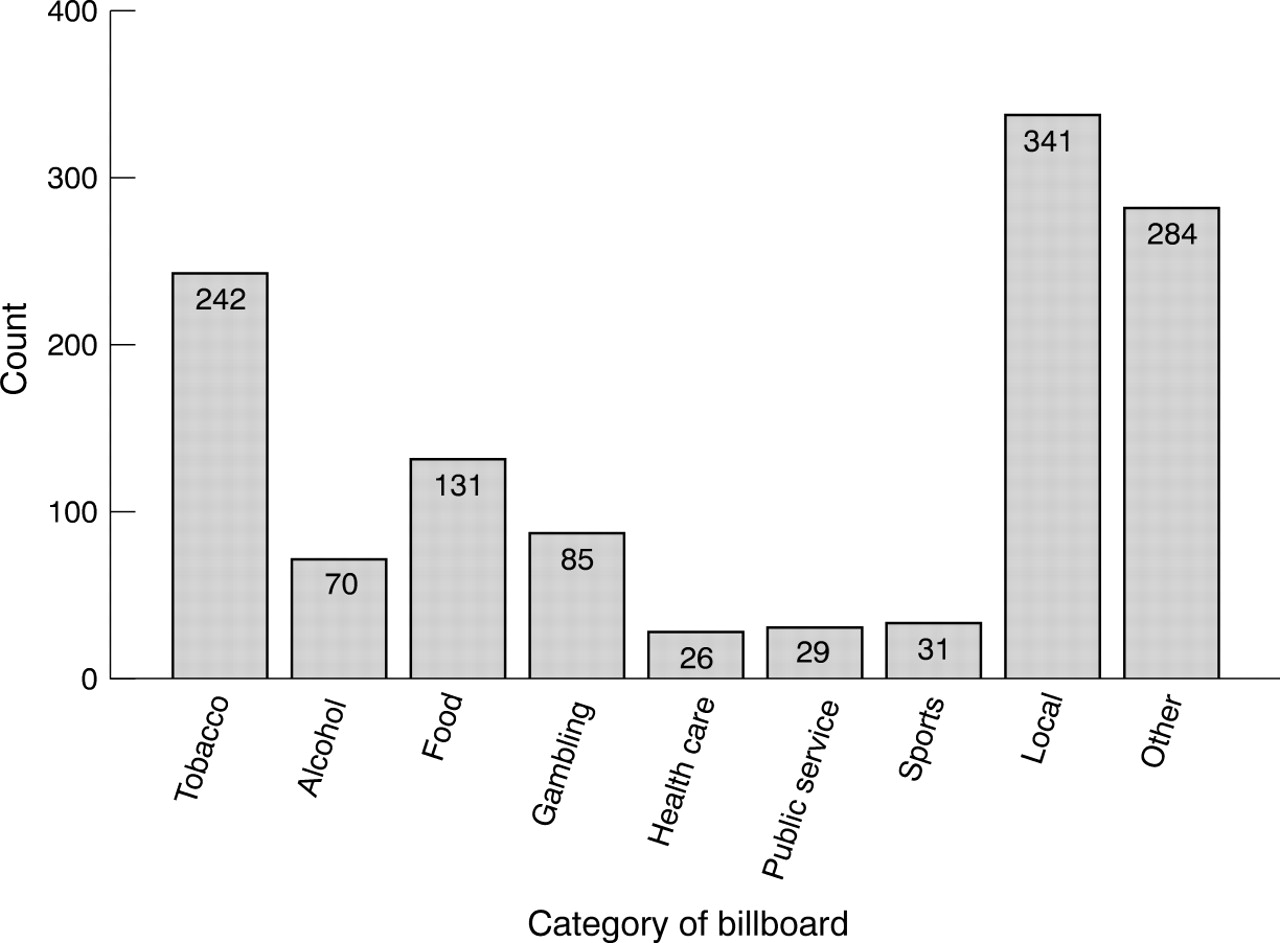
In early 1998, the research team identified and collected data on 1309 billboards in St Louis city and county, 70 of which were blank and dropped from subsequent analyses. We estimate that this probably accounts for almost all billboards located in this area, since during the period of pilot testing and data collection, we did not find a single billboard on non-highway (that is, residential) roads. Of these 1239 non-blank billboards, 242 (19.5%) advertised tobacco products, by far the largest single category of products advertised (fig 1). The next closest single product categories were food (10.6%), gambling (6.9%), and alcohol (5.6%).

Billboard product category frequencies
Not only are tobacco products the single largest product category, but individual tobacco brands dominate the outdoor advertising in St Louis. Table 1 lists the most frequently advertised individual brands in St Louis. These 22 brands account for 37.4% of all billboard advertisements in St Louis. Tobacco brands make up four of the top five, and nine of the top 22 advertised brands. All tobacco billboards appear in the top 22 brands.
Most frequently advertised brands
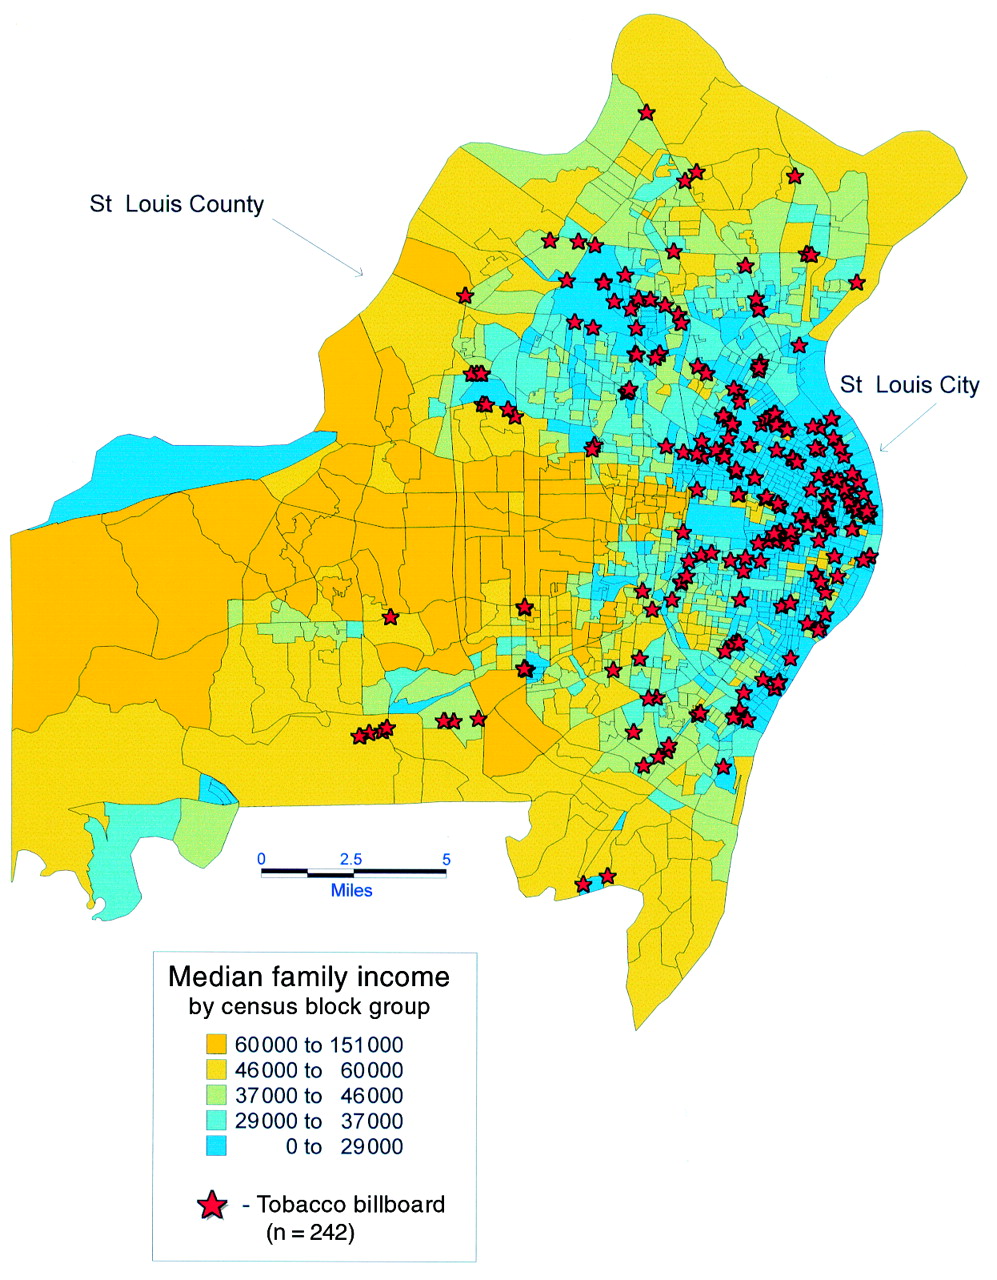
Figure 2 is a map that shows where tobacco billboards are located in St Louis city and county. The map also shows median family income by 1990 census block groups. It is immediately clear that tobacco billboards are located in poorer sections of the city and county. However, a map of all billboards in St Louis shows a similar pattern of locations in poorer areas. (This map is available from the authors.) In particular, no billboards of any type are found in the “central corridor” that runs east to west through the middle of the county, and where the most affluent suburbs are located. More focused statistical and geostatistical analyses are required to determine if tobacco billboards show any discernible location patterns.

Location of tobacco billboards in St Louis city and county. Census block groups are shaded according to median family income.
EVIDENCE FOR TARGETED MARKETING
City/county
To examine evidence that tobacco billboards are used to target particular populations, more focused analyses were performed. First, the relative distribution of billboards in St Louis city versus county was examined. St Louis city is relatively poorer and has a larger minority population (mainly African American) compared to the county. This presents a convenient opportunity to examine the relation between tobacco billboard advertising and certain sociodemographic population characteristics.
Table 2 shows that there is a significantly larger proportion of tobacco billboards located in the city than in the county (χ2 = 7.91, df = 1, p < 0.01). The table also shows that the density of tobacco billboards in the city compared to the county is one and a half times higher than that for non-tobacco billboards (12.32/8.19). In other words, while people who live or work in the city see many more billboards than if they were in the county, they are even more likely to see tobacco billboards. (It is important to note that billboard viewing is based on travel patterns as well as billboard density. However, it is not unreasonable to assume that the more billboards there are, the harder it will be to avoid seeing them.)
Comparison of billboard distribution for St Louis city and county
Income and race
The city/county differences described above are only a crude assessment of targeted marketing. By combining the billboard data with available census data via a modern GIS system, we can examine in a much more sophisticated manner the relationship of tobacco advertising and sociodemographic characteristics such as income and race.
The 1990 census provides data on income and race broken down by census block groups. This allows us to see if tobacco billboards are located in neighbourhoods that have different income and race characteristics than those of non-tobacco billboards. Table 3 shows the results of regression and correlation analyses relating block group characteristics (that is, percentage of African American residents and median family income) to the proportion of tobacco (to non-tobacco) billboards found in the block group. Both ethnicity and income are significantly related to the proportion of tobacco billboards—specifically, block groups that are poorer and have higher concentrations of African American residents are likely to have a greater proportion of tobacco billboards relative to non-tobacco billboards. This relationship becomes even stronger when only block groups with more than three billboards are included in the analysis. (This second analysis was performed because a proportion variable is fairly crude and unstable when the denominator is a small number.)
Relationship between block group characteristics and proportion of tobacco billboards
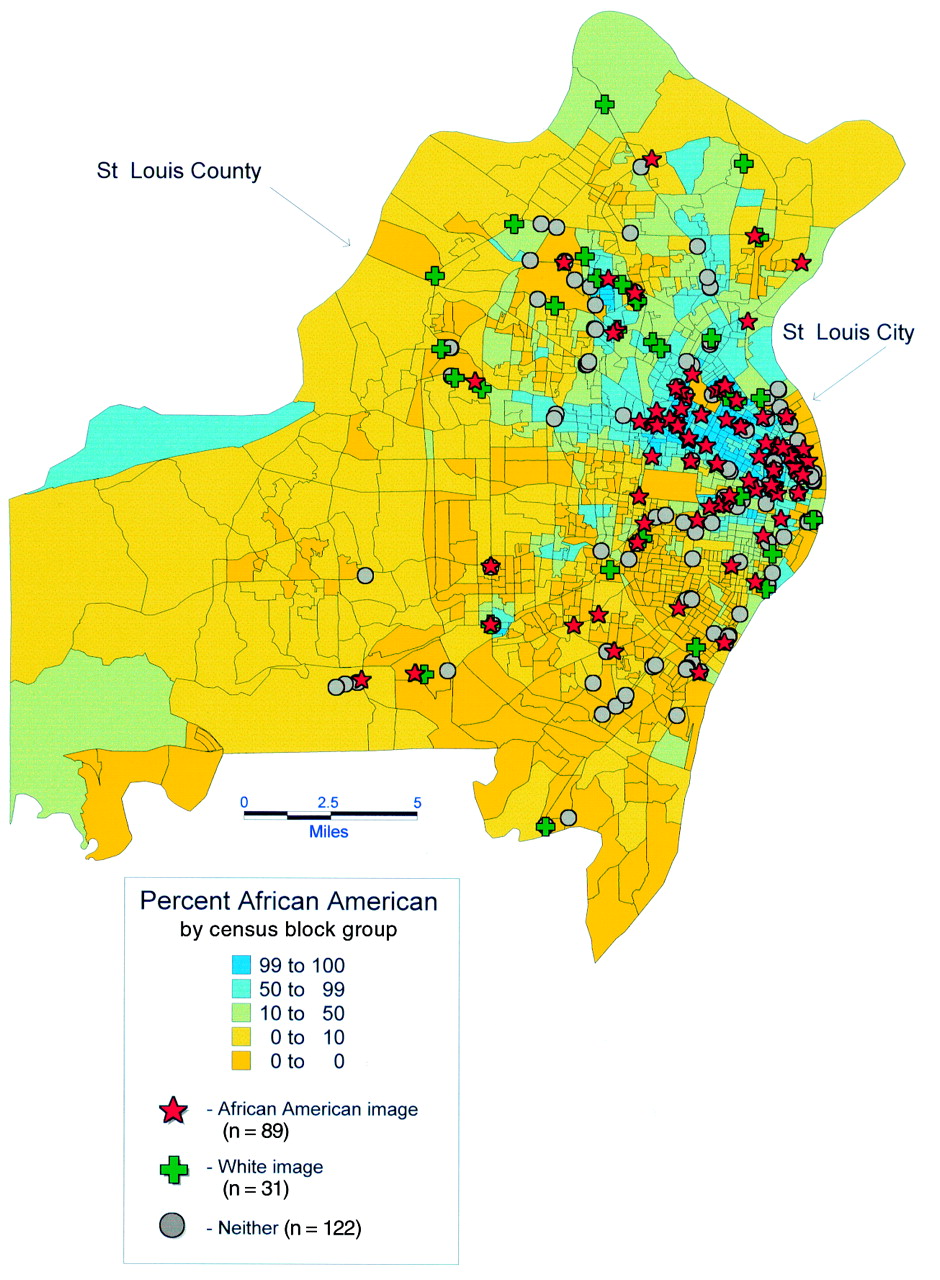
In addition to looking at the location of tobacco billboards, the characteristics of billboard content were analysed for further evidence of targeted marketing. Figure 3 is a map that shows the distribution of tobacco billboards by type of image found on the billboard. Specifically, each tobacco billboard was categorised by type of image: an African American figure or figures, white figures, or neither (a billboard that contains text or pictures, but no images of people). The map also shows the percent African American population by census block group. The map reveals a striking pattern. Although tobacco billboards with white figures, or no human figures at all, can be found throughout the city and county, billboards with images of African American figures are concentrated predominately in a part of the city called the north side. The north side is the most heavily African American populated region of the city.

Targeted placement of tobacco billboards with African American images. Symbols indicate type of image found on the tobacco billboard. Census block groups are shaded according to percentage of African American residents.
Statistical analyses confirm the visual impression suggested by the map in fig 3. Table 4 presents the results of a χ2 analysis of the pattern of tobacco billboard images. Using MapInfo, tobacco billboards were categorised by location according to whether they were in St Louis county, or the north or south sides of the city (east to west running Interstate 64/40 was used as the boundary for the north/south side of the city). Billboard location is highly significantly related to the type of image found on the billboard (χ2 = 32.65; df = 4, p < 0.001). Examination of standardised residuals indicated that on the north side of the city, tobacco billboards with African American images are found much more than expected, and white images much less than expected.
Relationship of geographic location and type of images found on tobacco billboards
Proximity to schools
The proximity of tobacco billboards to schools, daycare centres, malls, and other places where children and youth congregate has been an important part of the past debate on billboard restrictions. GIS data and techniques allow actual proximity analyses to be done to determine how close tobacco billboards really are to schools.
Figure 4 presents a map of the city of St Louis with overlays of tobacco billboards and public school locations. Buffer zones with half a mile radii around each school were used. Close examination of the resulting map reveals that approximately 74% (108 out of 145) of the tobacco billboards in the city fall within 2000 feet (700 metres) of public school property.
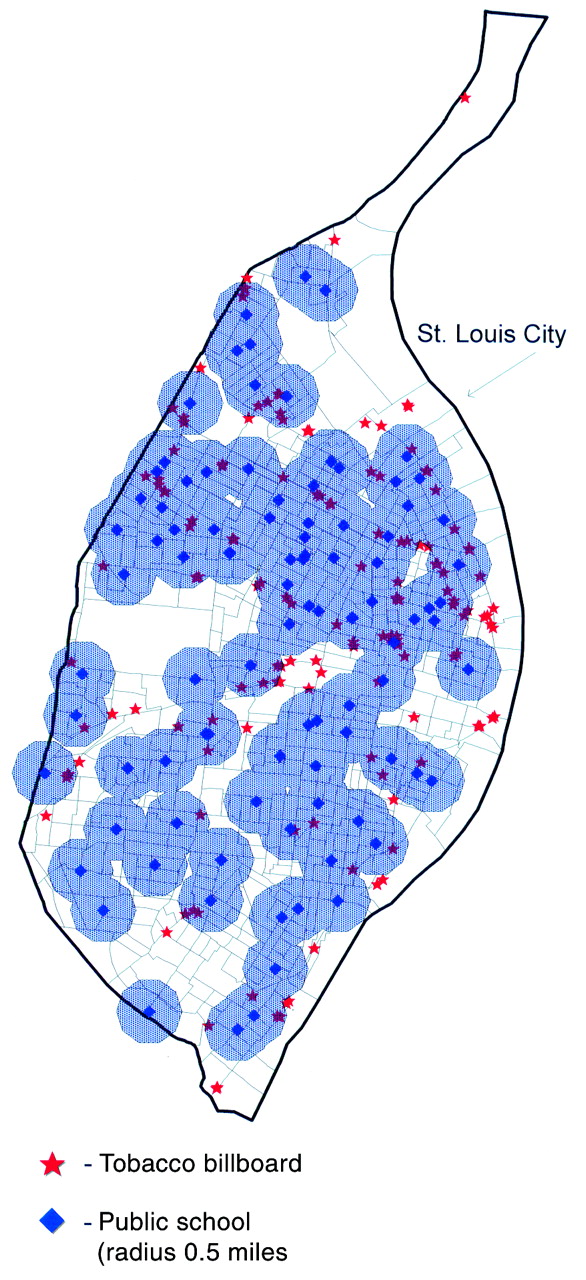
Locations of tobacco billboards and public schools in St Louis city. Buffer zones have half a mile radius.
Discussion
BILLBOARD SATURATION
It is essentially impossible to avoid billboards as soon as one ventures onto the roads and highways in St Louis. Ads for cigarettes, beer, cars, casino gambling, fast food, and the St Louis Rams clamour for the attention of anybody who steps outside, especially in the city. Billboards saturate the city and many parts of the county. The lack of billboards in the central corridor, where the newer and more affluent suburbs are located, is probably due to a variety of factors, including stricter zoning regulations, more organised political opposition, and other historical and political factors.
If billboards dominate the urban landscape of St Louis, tobacco billboards are truly the king of the outdoor advertising world. As our data show, tobacco billboards make up the single largest category of advertised products—one out of every five billboards advertises a product and activity that is the single most preventable cause of premature death in this country. The tobacco industry has proven time and again that given the opportunity they will saturate any marketing channel with ads and promotional activities so that citizens and consumers can never get away from the images.
This billboard saturation has particular implications for children. Almost three out of four billboards in the city of St Louis were within sight of a public school. Furthermore, analyses presented as part of a 1998 lawsuit brought by the city of St Louis against the Missouri Retailers Association attempting to enforce a restriction on billboard advertising showed that when daycare centres and private schools were considered along with public schools, then every single tobacco billboard in the city of St Louis fell within 2000 feet of a school or daycare (Yates C, St Louis city attorney, personal communication, April 1998).
NOT IN MY BACKYARD: TARGETED MARKETING TO POOR AND AFRICAN AMERICAN NEIGHBOURHOODS
One of the legacies of the environmental activist movement started in the late 1970s is a recognition that poor and minority communities often bear the brunt of environmental pollution. “Not in my backyard,” a saying popularised by Lois Gibbs of the Center for Health, Environment and Justice, has become a rallying cry in the fight against environmental injustice and racism.35 Our results suggest that, similar to toxic waste dumps, tobacco billboards are more often found in neighbourhoods that are poorer and more African American. This corroborates findings from several other studies in other urban locations.21 22
Moreover, the GIS maps and analyses clearly indicate that tobacco billboards are not only located in different types of neighbourhoods, but that the types of images used in these billboards vary according to neighbourhood (figs 3 and 5). One may say that this use of African American images in African American sections of the city is just good marketing. However, the tobacco industry has always vigorously denied targeting minorities or other groups, despite evidence to the contrary.36 Much of this evidence comes from the tobacco companies themselves; documents obtained from Brown & Williamson and RJ Reynolds in the last few years show how the companies ran advertising campaigns in magazines, on billboards and buses, and in other media to attract African Americans.37 Our data confirm this and show very specifically how the tobacco companies are aware of geographic and sociodemographic characteristics of neighbourhoods and use that information not only to place the tobacco billboards but to tailor the messages on those billboards to the residents of those neighbourhoods.

Kool billboard located on the north side of St Louis.
PUBLIC HEALTH IMPLICATIONS
The use of cutting edge GIS techniques is a powerful way to reveal a rich and interesting picture about outdoor tobacco advertising. The results of this study clearly show that before the restrictions on outdoor advertising were put into place in early 1999, tobacco billboards were omnipresent in St Louis. It is reasonable to assume that this picture was not that different for other large cities in the US. Now that tobacco billboards are no more, there are three important questions that future public health researchers, practitioners, and policy makers will need to address.
First, how does the removal of tobacco billboards affect tobacco advertising in general, and outdoor advertising more specifically? Tobacco companies are not likely to reduce advertising budgets, so it will be important to track how the industry “fills in” the hole left by the billboard removal. Will these advertising funds be shifted to existing traditional media such as magazine ads? Or will the industry develop new types of promotional activities that get around the restrictions in ways that the public health community has not anticipated? Also, the settlement left a few loopholes that will allow some outdoor tobacco images to remain. In particular retail establishments can use advertising that is viewable from the street, tobacco manufacturing plants can use outdoor advertising, and there is no restriction on outdoor tobacco advertising that is smaller than 14 square feet.
The second question is how is tobacco billboard advertising used in other parts of the world? Despite the revolutionary change in outdoor advertising due to the settlement, it is a simple fact that for the rest of the world tobacco billboards will be an important component of tobacco marketing for some time to come. It is important to look at how billboards are used in other countries, to examine the success or failure of formal or informal efforts to restrict billboards in other parts of the world, and to describe how the tobacco industry used outdoor advertising to target specific sociodemographic groups.
This study is simply a snapshot of one type of tobacco advertising at one point in time in one metropolitan region. It is important to have empirical research which covers more types of advertising in different parts of the United States and different countries. Furthermore, tobacco advertising can change so quickly that longitudinal research is clearly needed. For example, after RJ Reynolds decided to stop using Joe Camel in their advertising campaigns, billboards with the Joe Camel image were changed within weeks.
The GIS methods and analyses used in this study, although relatively new, can be easily used in other countries.38 High quality geographically tied data are being collected in most parts of the world, and in many cases these data go beyond simple demographics and include variables of interest to public health professionals. Mapping data (for example, political boundaries, streets, addresses, etc) are increasingly available at low cost for all developed nations, and most developing countries.39 Also, collecting data on outdoor advertising can be done relatively quickly, reliably, and cheaply.
This leads to the final important question. What is the effect of removing tobacco billboards on smoking behaviour in this country? Given what we know about the epidemiology and aetiology of smoking, it is extremely simplistic to assume that removing one type of advertising is going to have a dramatic effect on smoking rates. However, it may have an important effect on how smoking is viewed by youth and adults. In addition to recruiting new smokers and ensuring brand loyalty, tobacco advertising is used to “normalise” the perception of smoking as a common and desirable behaviour. The tobacco industry tries to surround every child and adult in this country with this positive image of smoking. Billboard advertising plays a very important role in this attempt, because it is much harder to “turn off” billboards compared to other forms of advertising. Television channels can be turned off or muted, magazine ads can be turned past, etc. In St Louis before 1999 almost every adult and child was exposed to tobacco ads multiple times per day on their way to work, to school, to the mall or park. In St Louis, as across the United States, everybody is now free of this risk. We must now closely examine how this changes perceptions of smoking, anti-smoking policies, and even smoking behaviour.
Tobacco billboards are indeed smoke signs. They pollute the air, exposing viewers to toxic images of a toxic substance. The air has cleared in the United States with the removal of tobacco billboards, but it remains to be seen how tobacco advertising will change over time, and how the rest of the world may deal with outdoor advertising.