Article Text

Abstract
Objective: To support tobacco control policies in Korea by providing the estimated annual economic burden attributed to cigarette smoking.
Methods: The following two different approaches were used to estimate the cost: “disease specific” and “all causes”. In the disease specific approach, we focused on estimating direct and indirect costs involved in treatments of cardiovascular, respiratory, and gastrointestinal diseases, and cancer as a result of smoking, by using an epidemiologic approach—the population attributable risk (PAR). To compute PAR, the relative risks of smoking in terms of physician visits, hospital admission, and death were estimated using the Cox proportional hazard model. In the all causes approach, we examined the differences in direct and indirect costs between smokers and non-smokers for all conditions and types of disease. The major data source was the Korea Medical Insurance Corporation cohort study, which had complete records of smoking status as of 1992 for 115 682 male and 67 932 female insured workers.
Results: By the disease specific approach, the estimated costs attributable to smoking in 1998 in Korea ranged from US$2269.42 million ($4.89 million per 100 000 population; 0.59% of gross domestic product (GDP)) to $2956.75 million ($6.37 million; 0.78% of GDP). The all causes approach yielded a minimum cost of $3154.75 million ($6.79 million; 0.82% GDP) and a maximum of $4580.25 million ($9.86 million; 1.19% GDP).
Conclusion: The study confirms that smoking places a substantial economic burden on Korean society. In light of this, our study provides evidence for a strong need to develop a national policy to effectively control tobacco consumption in Korea.
- economics
- policy
- Korea
- GDP, gross domestic product
- KMIC, Korea Medical Insurance Corporation
- PAR, population attributable risk
- PYLL, potential years of life lost
- RR, relative risk
Statistics from Altmetric.com
- GDP, gross domestic product
- KMIC, Korea Medical Insurance Corporation
- PAR, population attributable risk
- PYLL, potential years of life lost
- RR, relative risk
The prevalence of smoking in Korea is among the highest in the world, making Korea an important target market by multinational tobacco companies. In 1999, about 66.6% of men and 3.3% of women over the age of 20 were smokers in Korea.1 Considering that secondhand smokers were barely protected at worksites or public places by any sort of relevant regulation, the size of the population exposed to smoking related risks would be much greater than the estimates that are based on the reported smoking rate.
Despite the high prevalence of smoking, and especially that of unprotected secondhand smoking in Korea, Korea lacks effective national policies to reduce its smoking rate. This is partly due to the special circumstance between the Korean government and the tobacco industry, in which the government holds the reins of the tobacco industry, from cigarette production to its distribution, and the profits generated from sales are transferred to the national treasury. The government displays two faces in regard to cigarettes: as the main producer of cigarettes in Korea, it needs to maximise revenues from cigarette sales, but at the same time it has the responsibility to reduce the smoking rate to improve public health. Because these dual roles are obviously in conflict with each other, the government has been ineffectual in improving anti-tobacco policies. In addition, the public holds the prevailing perception that national policies on tobacco control, whether through an increase in cigarette sales tax and/or restriction of smoking in designated areas, violate smokers’ rights rather than protect non-smokers’ rights.
With the obvious conflicting role of the government and public misconception, an effective mechanism to convince the negative impact of smoking on our society must be established to provide a persuasive support for the need of tobacco control policies in Korea. While the impact of smoking on public health has been well documented by a number of studies,2–5 no attempt has ever been made to estimate systematically the economic impact of smoking on Korean society. Thus, our study was conducted to provide an estimate of the costs imposed on our society as a result of smoking to justify the establishment of tobacco control policies.
METHODS
Study subjects and data source
The major data source was the Korea Medical Insurance Corporation (KMIC) cohort data, consisting of 115 682 male (a 25% random sample) and 67 932 female insured workers (100%) of KMIC. KMIC provides health insurance to civil service workers, teachers, and their dependants, representing 10.7% of the entire Korean population. All insured employees are required to participate in biennial medical examinations performed by KMIC. The examination is optional for dependents. The cohort data included the medical examination records for their smoking status as of 1992 and information on health care utilisation and mortality during the follow up period (January 1993 to December 1998), which was based on insurance claims data and vital statistics. The age distribution of the study cohort was from 35–59 years in the baseline year of 1992 and extended to a maximum of 64 years during the follow up period.
Study subjects were classified as current smokers if they had been smoking for at least one year as of the date of the medical examination, ex-smokers if they had smoked but had quit, and non-smokers if they had never smoked. About 57.5% of the male participants were current smokers and 21.3% were ex-smokers. These proportions were very similar to the national average for the same age group.1 For female subjects, the current smokers and ex-smokers were only 0.4% and 0.5%, respectively, which were considerably smaller than the national average of 2.4% and 1.5%.1 To control for the potential bias resulting from the phenomenon that smoking associated risks change with age (that is, aging effect) and accumulate (that is, calendar effect) during the follow up period, the number of medical utilisations, deaths, and person years were stratified by age and one year calendar period for males and females separately.6
To examine the excess risk among smokers ⩾ 65 years of age, we used the cross sectional data of 1997 medical examination report for a random sample of the elderly dependents of the KMIC enrollees, which consists of 57 061 male and 78 436 female dependents. Their health care usage and mortality in 1998 were examined to estimate relative risks of elderly smokers.
Younger smokers under the age of 35 were excluded from the analysis because of the general tendency that the cumulated effects of smoking on morbidity and mortality rarely appear before the smokers enter middle age.7,8
Cost estimation
The total cost of smoking was assessed as the sum of direct and indirect costs related to smoking. Direct costs included medical costs for hospitalisation and outpatient visits, costs of transportation to health providers, and expenses for caring for the patients by caregivers. Indirect costs were the economic loss from absence from work resulting from hospital admissions and physician visits, and opportunity costs due to premature death.9 By combining the separate estimations of cost of smoking for each group of current and ex-smokers, total cost of smoking was computed.
Two different methodologies were employed to estimate the costs: the “disease specific” approach10–12 and the “all causes” approach.8,13 In both approaches, costs were computed according to the prevalence based method, which measured current costs associated with smoking currently and in the past.8,14,15 Table 1 presents the comparison of the two estimation methods. Appendix 1 shows the cost estimation equations.
Comparison of cost estimation methods between the disease specific and all causes approaches
Disease specific approach
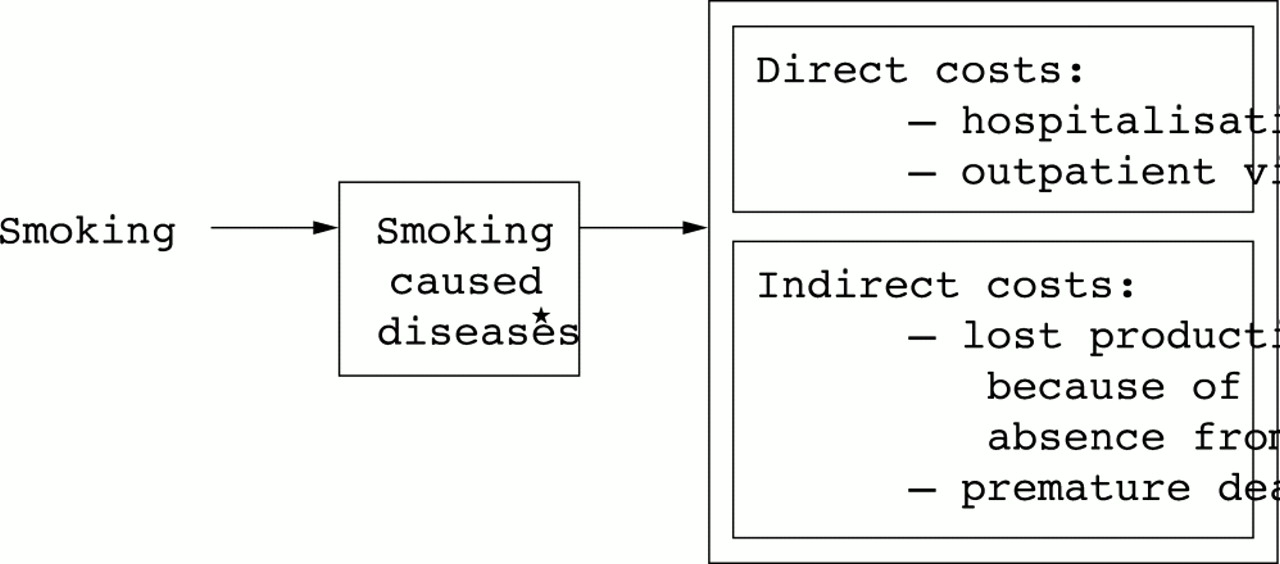
Figure 1 presents the conceptual framework of cost estimation by the disease specific approach. We examined additional costs incurred among smokers to treat four major disease categories (cardiovascular, respiratory, and gastrointestinal diseases, and cancers; see tables 2 and 3) proven to be caused by smoking 10–12,16–18 using epidemiologic methodology of population attributable risk (PAR) to smoking.6 To calculate PAR, adjusted relative risk (RR) of smoking in terms of physician visits, hospital admission, and death were estimated respectively, using the Cox proportional hazard model upon the first event of individual subjects during the follow up period. Each RR estimation for male subjects was adjusted for other risk factors, such as age, body mass index, alcohol consumption, and serum total cholesterol. Because the number of female smokers among the KMIC cohort was too small to obtain stable estimates of RR, the RR of male smokers was used as a proxy measure for female smokers. Diseases showing RR of ⩽ 1 were excluded from the analysis because it implies that smoking does not work as a risk factor for those diseases among the Korean population.
Relative risks and population attributable risks of medical utilisation caused by smoking related diseases in Korea, male, 35–64 years old
Relative risks and population attributable risks of mortality caused by smoking related diseases in Korea, male, 35–64 years old

Conceptual framework for estimating smoking costs by disease specific approach. *Smoking caused diseases include cardiovascular, respiratory, and gastrointestinal diseases, and cancers, which earlier studies had proven were caused by smoking (see tables 2 and 3 for specific diseases included in each disease category).
Direct medical costs for hospitalisation (or outpatient visits) were estimated according to the total number of inpatients (or outpatients) with the disease “i” in the nation in 1998, PAR for hospitalisation (or outpatient visits) with “i” caused by smoking, and average per capita annual hospitalisation costs (or outpatient visit costs) to treat “i”. Transportation costs were calculated on the basis of the total number of outpatients with “i”in 1998, PAR for outpatient visits with “i” caused by smoking, average per capita annual physician visits to treat “i”, and average two way transportation cost of US$4.719 (exchange rate of 1200 Korean Won for US$1) to health care providers. Caregiver’s economic costs were estimated by the total number of inpatients with “i” in 1998, PAR for hospitalisation with “i” caused by smoking, average per capita annual inpatient days to treat “i”, and the average daily rate (that is, market price in 1998) of $25 for professional caregiver’s service.20
Costs of lost productivity resulting from absence from work and premature death were estimated following the human capital approach, which assumes that the monetary value of lost productivity equals the wage rate.21 The costs for absence from work was calculated by multiplying the average daily and hourly wage rates by the duration of absence from work, defined as days hospitalised and hours spent for outpatient visits attributable to smoking.
Premature death costs were obtained from the product of the number of deaths attributable to smoking and the expected value of an individual’s future earnings during the potential years of life lost (PYLL). To account for different earning patterns for different sexes and at different age ranges, sex and five year age specific average yearly wage rate was used in computing forgone future earnings. The PYLL, defined as life expectancy at the age of death, was obtained from sex and five year age specific Korean life tables of 1998.20
According to the human capital approach, the monetary value of the lost productivity for the period after 65 years of age becomes zero because Korean people generally retire from work after 65 and do not earn a wage. However, it is inaccurate and unethical to place no economic value on a person’s life after 65. Therefore, as a proxy measure for the economic value of the years remaining after the age of 65, the average annual wage rate for the age group between 60 and 64 years was chosen. As a sensitivity analysis, the premature death costs were recalculated by applying 50%, instead of 100%, of the average annual wage rate for the group aged between 60 and 64 years of age.
To reflect economic growth on future earnings, the average annual economic growth rate between 1999 and 2001 of 7.73% in Korea was applied.20 In addition, future earnings were discounted to the present values by the rate of 8.42%, which has been the average yield from corporate bonds in Korea between 1999 and 2002.22
All causes approach
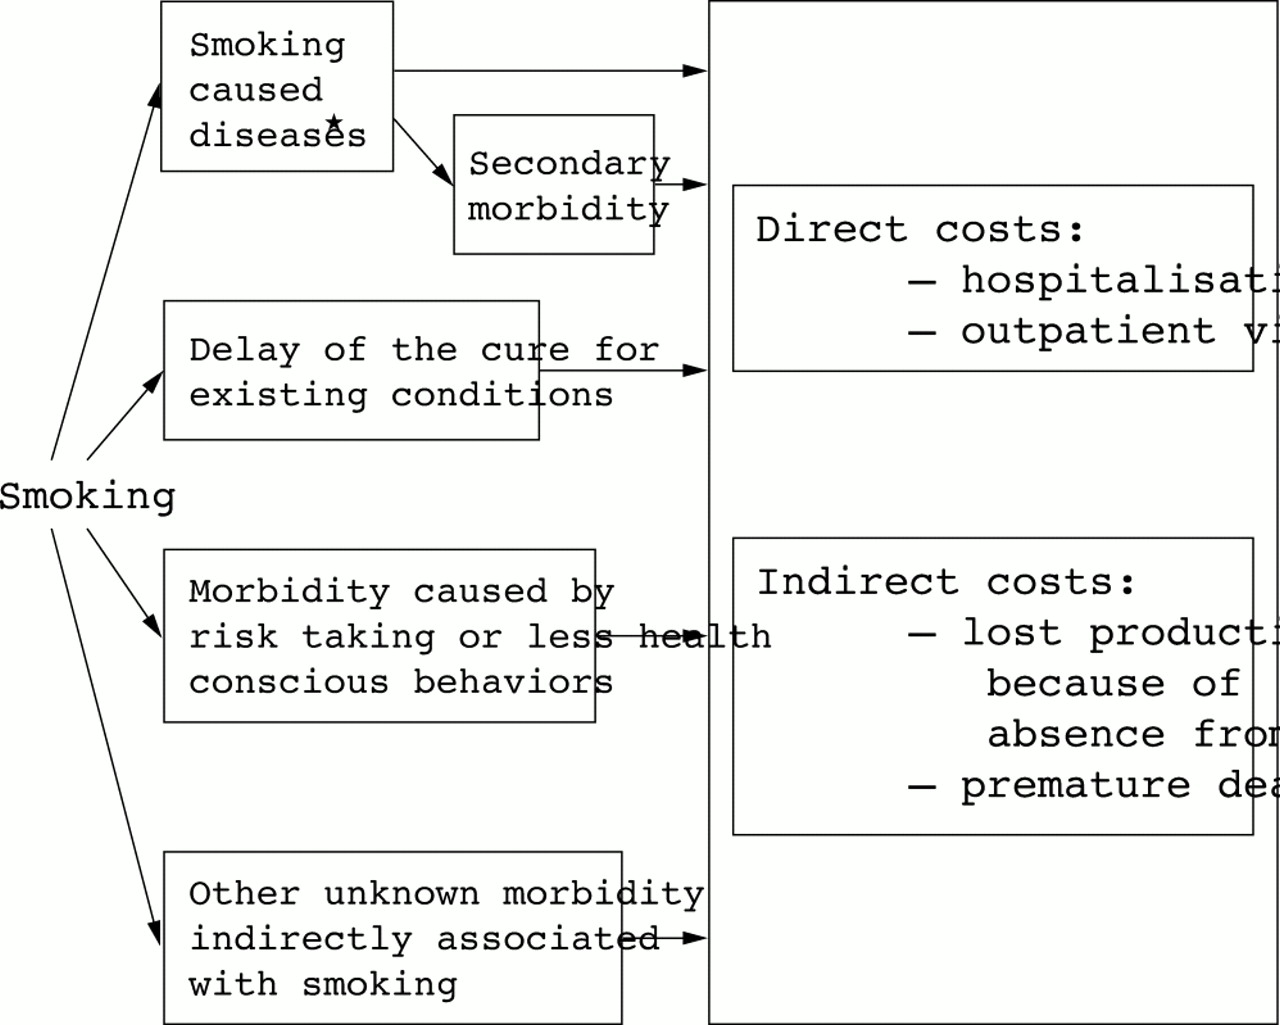
Under the all causes approach, all the extra costs observed among smokers without restricting to certain disease categories were estimated and compared with those of non-smokers.8,13 More specifically, rather than calculating smoking attributable fractions of the costs of treating the major smoking related diseases, we simply examined differences in costs for all conditions, regardless of the types of disease, between smokers and non-smokers. As shown in fig 2, the all causes approach attempts to capture all potential costs, directly or indirectly related to smoking, including costs related to treatments for the following cases: four major disease categories; secondary diseases to the major diseases23; conditions or accidents incurred because of smoker’s risk taking or less health conscious behaviour24,25; existing conditions for which cure was delayed because of smoking23; and other unknown morbidity indirectly associated with smoking.

Conceptual framework for estimating smoking costs by all causes approach. *Smoking caused diseases include cardiovascular, respiratory, and gastrointestinal diseases, and cancers, which earlier studies had proved were caused by smoking (see tables 2 and 3 for specific diseases included in each disease category).
To compute direct medical costs for hospitalisation (or outpatient visits), we first calculated average annual per capita hospitalisation costs (or outpatient visit costs) adjusted for age and sex during the follow up period for each of smoking and non-smoking groups. Multiplying the difference in the average per capita hospitalisation costs (or outpatient visit costs) between the two groups by the total number of smokers in the nation yielded the total amount of extra expenditure for hospitalisation observed among smokers.
Transportation costs were estimated on the basis of the difference in the average per capita annual physician visits between smokers and non-smokers, total number of smokers, and average two way transportation costs to health care providers. Caregiver’s costs were computed by the difference in average per capita annual inpatient days between smokers and non-smokers, the total number of smokers, and the average daily rate for professional nursing care. Costs of lost productivity resulting from hospitalisation and outpatient visits were assessed by the difference in average per capita annual inpatient days and outpatient visits between smokers and non-smokers, the total number of smokers, and average daily and hourly wage rates. Premature death costs were estimated by the difference in the probability of death between smokers and non-smokers, the total number of smokers, and expected value of future earnings during the remaining life years.
RESULTS
Disease specific approach
For current smokers, lung cancer (RR = 4.2), oesophageal cancer (RR = 3.7), and kidney cancer (RR = 2.4) showed the highest RR for hospital admission, but for ex-smokers, oesophageal cancer (RR = 2.5), ischaemic heart disease (RR = 2.0), and pancreatic cancer (RR = 1.8) showed the highest RR for hospital admission (table 2). The estimated PAR percentages of hospitalisation with lung cancer were about 65.8% and 15.4% for current and ex-smokers, respectively. For both of the current and ex-smoking groups, the overall magnitude of RR for physician visits was smaller than that for hospitalisation. Laryngeal cancer (RR = 7.5), lung cancer (RR = 4.0), oesophageal cancer (RR = 3.7), and asthma (RR = 3.6) were the causes of death most highly attributable to current smoking (table 3).
Direct medical costs additionally incurred among the national population over 35 to treat smoking related diseases in 1998 were estimated at about $194.25 million (table 4). Transportation costs to visit health care providers and caregiver’s economic costs attributable to smoking were $4.17 million and $23.00 million, respectively, which are relatively smaller than other types of costs. Approximately 3122 person-years were estimated as absence due to hospital admissions or physicians visits caused by current or ex-smoking, at a productivity loss cost of $57.50 million. The 1998 smoking attributable deaths were estimated at 10 988 (56.00 per 100 000 population over 35), which accounted for 25.70% of the total number of deaths in the nation for the diseases considered in this analysis.20,26 PYLL was estimated as 151 447.8 and 42 967.4 years for current and ex-smokers, respectively (table 5). The economic loss from premature death ranged from $1990.50 million to $2677.83 million, depending on whether using 100% or 50% of the average annual wage rate of the age group between 60 and 64 years as a proxy for the forgone economic value of the life years remaining after the age of 65.
Economic costs of smoking in Korea, population over the age of 35, 1998
Estimates of the potential years of life lost because of smoking in Korea, by disease specific approach, 35–64 years old
Combining all these costs, the disease specific approach yielded a minimum of $2269.42 million ($4.89 million per 100 000 population) to a maximum of $2956.75 million ($6.37 million per 100 000 population) for total economic costs attributable to smoking in Korea in 1998. This is about 0.59–0.78% of the average gross domestic product (GDP) between 1997 and 1999 ($383 728 million).26
All causes approach
A total cost of $3154.75 million ($6.79 million per 100 000 population, 0.82% of GDP) to $4580.25 million ($9.86 million per 100 000 population, 1.19% of GDP) was estimated according to all causes approach. This includes −$88.09 million for direct medical costs, −$19.83 million for transportation costs, $19.42 million for caregiver’s economic costs, $16.50 million for productivity loss costs, and $3226.75 million or $4652.25 million for premature death costs. About 284 260.7 and 61 470.1 years were estimated as PYLL related to current and ex-smoking, respectively (table 6).
Estimates of the potential years of life lost because of smoking in Korea, by all causes approach, 35–64 years old
DISCUSSION
The results of our study show that Korea spent an extra $2269.42 million to $4,580.25 million (0.59 to 1.19% of GDP) in 1998 because of cigarette smoking. This confirms that high prevalence of smoking in Korea not only has a considerable public health impact, but also imposes a substantial economic burden on society. Some people argue that tobacco consumption contributes to our economy by generating earnings for tobacco farms, revenue to all the business involved in production, distribution, and sales of cigarettes, and tax income for the government. However, the revenues generated from tobacco consumption are generally compensated by the price that smokers pay when they purchase cigarettes. Therefore, the economic costs estimated in this study represent the net costs attributable to smoking.
Among the various types of costs, premature death costs accounted for the largest proportion of the total costs, followed by medical, transportation, caregiver’s, and work loss costs. Medical costs represents only 6.6–8.6% (disease specific approach) of the total costs, which is considerably smaller than the case of the USA.7 This could be explained by differences in the level of medical fees and risk for smoking related diseases between the two countries, and the types of health care utilisation considered in the analysis. On average, the medical price for the same procedure provided in the USA is about 5–38 times that in Korea.27–29 In the present study, the amounts spent for nursing home care and home health services were not taken into account because patients rarely or minimally use these types of services in Korea yet, whereas they were included in most of the US studies.13
One strength of this study is that it estimated costs using the two distinct methods to complement the limitations of each method. Traditionally, the disease specific approach has been considered as a state of art to estimate costs of smoking. However, recent studies have revealed that the disease specific approach has a limitation of omitting substantial morbidity and mortality costs by restricting the cost estimation to the treatments of the major four disease categories (respiratory, cardiovascular, and gastrointestinal diseases, and cancers) proven to be directly associated with smoking.8,13,25 For instance, people suffering from smoking caused diseases are at a higher risk of having secondary diseases due to the greater difficulty of managing these diseases, most of which do not appear to be directly related to smoking, and are therefore likely to incur additional health care costs. Also, risk taking behaviours such as more drinking, less careful driving, and less health conscious behaviour by smokers than non-smokers24,25 may induce additional health care use, of which association with smoking is often overlooked. Therefore, if we restrict our analysis to the four major diseases, the full range of the costs attributable to smoking will not be captured. On the other hand, all cause smoking attributable expenditure might give us a risk of overestimation because all the morbidity and mortality costs were reflected in the cost estimation regardless of the strength of the association with smoking.24 In addition, the all causes approach is based on the average annual per capita difference in costs for smokers and non-smokers, whereas the disease specific approach is based on risk ratios. In general, differences are less generalisable than ratios. Thus, to overcome these shortcomings, the present study incorporates the results from both methods.
Interestingly, the current (−$88.08 million) smokers spent a lot less direct medical costs than non-smokers according to all causes approach, while ex-smokers (−$0.002 million) spent slightly less. There could be several explanations for this. Firstly, in general, smokers can remain smokers because the cumulated effects of smoking on their health have not appeared yet. On the other hand, most ex-smokers have quit smoking because they developed chronic health problems. Thus, it is possible that ex-smokers have a higher health care expenditure than current smokers.13 Secondly, it is argued that smokers tend to seek health care less actively than non-smokers because they have less concern for their health.25,30
What this paper adds
While the impact of smoking on public health has been well documented by a number of studies, no attempt has ever been made to estimate systematically the economic impact of smoking on Korean society. Thus, this study was conducted to provide an estimate of the costs imposed on Korea as a result of smoking to justify the establishment of tobacco control policies.
By quantifying the economic burden of tobacco consumption on society, this study provided empirical evidence of potential savings that Korea could achieve by implementing effective tobacco control policies. It is hoped that the results of this study will help to motivate the government to take a more active role in implementing effective non-smoking policies to curb tobacco related illness and economic losses.
The total transportation costs spent by current smokers (−$22.08 million) were less than those by non-smokers according to the all causes method. On the contrary, for caregiver’s costs, current smokers ($9.92 million) spent more than non-smokers. Difference in utilisation patterns between inpatient and outpatient care among current smokers may explain these contradictory results. As mentioned above, smokers are less likely to seek health care than non-smokers. They tend to seek health care only when their conditions become so grave that they require hospitalisation. Thus, considering all types of diseases without restricting to the four major disease categories, we learn that smokers use less outpatient care, but more inpatient care, than non-smokers. Accordingly, transportation costs estimated on the basis of outpatient visit rates showed negative values, while caregiver’s costs based upon hospitalisation rates gave positive values.
Our estimation is subject to underestimation for several reasons. Firstly, to compute the costs of lost productivity, excess absence was defined as time spent during hospitalisation or ambulatory care in treating smoking related diseases. However, it generally takes time to recover normal productivity after discharge or physician visits and smokers have been found to have more short term illnesses and days off work.31 Thus, our definition for excess absence results in underestimation. Secondly, since Korea has an extremely high prevalence of smoking over a wide range of age groups, the rate of passive smoking would be considerable. Moreover, because of the lack of appropriate policies to protect non-smokers either at work sites or public places in Korea, the impact of passive smoking would be much greater than in other countries having appropriate protection policies. However, because data providing the information on the level of exposure of secondhand smoking are not available, it is difficult to estimate the rate of passive smoking. Thirdly, the expenses not covered by medical insurance were excluded from the cost evaluation. In particular, the use of oriental medicine, which is a very popular form of medical care among Korean people that is generally not covered by health insurance in Korea, could not be incorporated into the cost estimation. Lastly, because of the lack of empirical evidence in quantifying costs, many costs that are associated with smoking were omitted in the analysis. These costs include: cleaning buildings and streets, annoying non-smokers, fixing articles damaged by cigarette burns, time and costs spent in trying to quit smoking, implementing tobacco control policies, and smoking research and education programmes.32
There might be a problem in regard to how representative the KMIC enrollees are. Presumably, smokers with chronic health problems would not be in this workplace insurance scheme and this may also bias downwards the smoking related diseases. The working population would also presumably have some different characteristics from the whole population in terms of smoking rates and health care usage.
In conclusion, by quantifying the economic burden of tobacco consumption on society, our study provided empirical evidence of potential savings that Korea could achieve by implementing effective tobacco control policies. Recently, the need for tobacco control has received great attention and various strategies to reduce smoking rates have been developed and applied around the world. However, despite the high prevalence of smoking, Korea lacks effective strategies to reduce its smoking rate. It is hoped that the results of this study will help to motivate the government to take a more active role in implementing effective non-smoking policies to curb tobacco related illness and economic losses.
APPENDIX: COST ESTIMATION EQUATIONS
Disease specific approach
1) Direct medical costs for hospitalisation

where, i = 1,..., nth disease
j = 1 if male, 2 if female
INij = total number of inpatients with “i” in 1998
PAR(I)ij = population attributable risk for hospitalisation with “i” caused by smoking

where, RR(I)ij = relative risk of smoking for hospitalisation with “i”
P(C)j = % smokers among the national population over 35 in 1998
IPij = average per capita annual hospitalisation costs to treat “i”
2) Direct medical costs for physician visits

where, ONij = total number of outpatients with “i” in 1998
PAR(O)ij = population attributable risk for physician visits with “i” caused by smoking
OPij = average per capita annual physician visit costs to treat “i”
3) Transportation costs

where, Vij = average per capita annual physician visits to treat “i”
4) Caregiver’s economic costs

where, Hij = average per capita annual inpatient days to treat “i”
5) Costs of absence from work

6) Premature death costs

where, k = 1 if 35–39, 2 if 40–44, 3 if 45–49, 4 if 50–54, 5 if 55–59, 6 if 60–64, 7 if 65–69,
and 8 if ⩾ 70 years old
Dijk = total number of deaths among national population caused by “i” in 1998
PAR(D)ij = population attributable risk for death with “i” caused by smoking
PYLL jk = potential years of life lost
All causes approach
1) Direct medical costs for hospitalisation

where, IC(S)jk = average per capita annual hospitalisation costs among smokers
IC(NS)jk = average per capita annual hospitalisation costs among non-smokers
T(S)jk = total number of smokers in the nation in 1998
2) Direct medical costs for physician visits

where, OC(S)jk = average per capita annual physician visit costs among smokers
OC(NS)jk = average per capital annual physician visits costs among non-smokers
3) Transportation costs

where, V(S)jk = average per capita annual physician visits among smokers
V(NS)jk = average per capita annual physician visits among non-smokers
4) Caregiver’s economic costs

where, H(S)jk = average per capita annual inpatient days among smokers
H(NS)jk = average per capita annual inpatient days among non-smokers
5) Costs of absence from work

6) Premature death costs

where, D(S)jk = probability of death per year among smokers
D(NS)jk = probability of death per year among non-smokers