Article Text

Abstract
Objectives: California experienced a notable decline in per capita cigarette consumption during its comprehensive tobacco control programme. This study examines what proportion of the decline occurred from: (1) fewer ever smokers in the population, (2) more ever smokers quitting, and (3) current smokers smoking less.
Design, subjects: Per capita cigarette consumption computed from cigarette sales and from adult respondents to the large, cross-sectional, population-based California Tobacco Surveys of 1990 (n = 24 296), 1996 (n = 18 616) and 2002 (n = 20 525) were examined for similar trends.
Main outcome measure: Changes (period 1: 1990–1996; period 2: 1996–2002) in per capita cigarette consumption from self-reported survey data were partitioned for the entire population and for demographic subgroups into the three components mentioned above.
Results: In periods 1 and 2, most of the decline in per capita cigarette consumption for the population as a whole was from current smokers smoking less followed by a reduction in ever smokers. The decline from smokers smoking less was particularly evident among young adults (18–29 years) in period 1. While the portion of the decline due to quitting in the entire population in period 1 was negligible, in period 2 it accounted for 22% of the total per capita decline. The decline from quitting in period 2 was mostly observed among women.
Conclusions: Rather than near-term benefits from smokers quitting, population health benefits from reduced per capita cigarette consumption will likely occur over the longer term from fewer people becoming ever smokers, and more less-addicted smokers eventually quitting successfully.
- per capita cigarette consumption
- smoking cessation
- smoking initiation
- smoking intensity
Statistics from Altmetric.com
Public health programmes to reduce smoking-related disease are a national priority.1 The reduction in per capita cigarette consumption reported in California following the initiation of its tobacco control programme2 will likely result in future population health benefits. In particular, if reductions in per capita consumption stem from current smokers quitting, Doll and colleagues have argued that there will be a near-term reduction in lung cancer rates.3
Per capita cigarette consumption has declined fairly steadily in the United States since the early 1970s.4 We have previously shown that in California the rate of decline following the programme start was more rapid than the pre-programme rate and more rapid than the rate in the rest of the USA before or during the programme.2 From 1988 to 2002, per capita consumption declined by 60% in California compared to 40% in the rest of the USA.5
While the initial goal of California’s comprehensive tobacco control programme was to reduce per capita consumption by discouraging youth smoking initiation and encouraging adult smokers to quit,6 protecting non-smokers from secondhand smoke became another important priority by 1993,7 following the designation of secondhand tobacco smoke as a class A carcinogen.8 Considerable local efforts coupled with media messages focused public attention on this issue and led to the first state law (1995) banning smoking in most workplaces. Smokers accustomed to restrictions at work may also be more agreeable to having them in the home.9 Besides protecting non-smokers from secondhand smoke, smoking restrictions can reduce smokers’ cigarette consumption, promote quitting, and possibly inhibit initiation.9–13
In this report, we first establish that per capita cigarette consumption from sales data and from self-reported data from respondents to the 1990, 1996, and 2002 California Tobacco Surveys show a similar declining trend. Then, we examine changes in self-reported consumption on a per capita basis from 1990–1996 and from 1996–2002, partitioning the proportion of the per capita decline in self-reported cigarette consumption in each period that potentially resulted from: (1) fewer ever smokers, (2) increased quitting, and (3) reduced consumption among current smokers. We examine these changes overall and in different demographic subgroups.
METHODS
Data sources
Per capita cigarette consumption
Tobacco sales excise taxes are collected monthly by both the State of California and the federal government at the wholesale level. In this report, we use bimonthly sales data that combine the financial quarter boundary months (for example, December-January) to reduce variation from retailer-buying patterns.14 To convert sales data to monthly per capita cigarette consumption, the mean number of packs removed from the warehouses in each interval was divided by the total population of California adults ages 18 years and older15; only about 1% of total consumption is accounted for by persons under 18 years of age.16 Annual population totals are interpolated to obtain the population for each bi-monthly interval. To better visualise the trend in per capita cigarette consumption, a statistical smoothing procedure (SABL) was used.17
California tobacco surveys
We use estimates from three large, population-based random-digit-dialled California Tobacco Surveys conducted as part of the evaluation of California’s tobacco control programme in 1990, 1996, and 2002.18 Details on survey design and conduct are available from technical documentation available online.14 Briefly, a household adult enumerates all persons in the household, providing demographics and smoking status for each. Adults are then selected for an approximately 25 minute extended interview, with the selection probability much higher for anyone who smoked in the previous five years. The interview includes questions on current smoking status, cigarette consumption, quitting history, and smoking-related attitudes.
Each sample was weighted to be representative of the population for the year in which the survey took place. Respondents were assigned weights that account for selection probability (base weight) and that adjust for non-response (final weight). Household response rates were 75%, 55%, and 46%, and the extended interview cooperation rates were 75%, 73%, and 63%, in the 1990, 1996, and 2002 California Tobacco Surveys, respectively. There were 24 296 respondents in 1990, 18 616 in 1996, and 20 525 in 2002.
Definitions
An ever smoker reported having smoked at least 100 cigarettes in his or her lifetime. Following previous practice,4,19 the quit ratio was computed as the percentage of ever smokers who indicated that they were not smoking when surveyed. Current smokers are ever smokers who indicated that they “smoked now” (1990), or “now smoked everyday or some days” (1996, 2002). The definition change tends to capture a few more smokers who admit to some-day smoking that might have denied being a smoker with the previous question. Everyday smokers were asked on average how many cigarettes/day they consumed. Some-day smokers were asked the number of days they smoked in the previous month and the usual number of cigarettes consumed on those days. Multiplying these answers and dividing by 30 gives average cigarettes/day. Cigarettes/day for all smokers were then converted into per capita packs/month for comparison with the excise tax data.
Data analysis
Demographics
Adult respondents in the 1990, 1996, and 2002 CTS were divided into demographic subgroups (sex, age (18–29, 30–44, 45+ years), race/ethnicity (Non-Hispanic white and African American versus Hispanic, Asian and other), and education (no college versus some college). Since sample sizes did not permit each racial/ethnic group to be analysed separately, our race/ethnicity categorisation was intended to distinguish relatively static from rapidly growing subgroups of the population (for example, from immigration, particularly of Hispanics and Asians),20 in which women have low smoking rates.21
Variance estimation
A jackknife procedure was used to estimate variance for computation of 95% confidence intervals.22 With this procedure, the analysis is conducted on the full sample and on each of specially constructed replicate samples. The estimated variance is computed based on the difference between each replicate sample estimate and the full sample estimate.14
Decomposition of change in self-reported consumption
The change in total reported cigarette consumption during period 1 (1990–1996) and period 2 (1996–2002) on a per capita basis was decomposed into components that can be attributed to changes in: (1) the percentage of the population that were ever smokers, (2) the fraction of ever smokers who quit, and (3) the consumption level among current smokers. This decomposition is derived as follows:
Total packs/month is equal to the number of smokers multiplied by the average number of packs consumed by each smoker each month,
-
PACKS per month = S*C (equation 1)
where S = number of smokers in population and C = mean packs/smoker/month.
The number of smokers in the population can be computed as:
-
S = P*E*(1 − Q) (equation 2)
where P = population size, E = proportion of population who were ever smokers, and Q = proportion of ever smokers quit when surveyed.
Thus, from equations (1) and (2), the total packs per capita, PACKS/P, is
-
PACKS/P = E*(1 − Q)*C (equation 3)
Differentiating this expression using the chain rule gives:
-
d(PACKS/P)/dt = (dE/dt)*(1 − Q)*C + E*(−dQ/dt)*C + E*(1 − Q)*dC/dt (equation 4)
Multiplying both sides of the above equation by dt, and assuming approximate linearity, the per capita change in packs, ΔPACKS/P, can be approximated in terms of changes in the proportion of ever smokers, ΔE, the proportion of former smokers, ΔQ, and the consumption level of current smokers, ΔC,
-
Δ(PACKS/P) = ΔE*(1 − Q)*C + E*(−ΔQ)*C + E*(1 − Q)* ΔC (equation 5)
The first term in the above equation thus represents the per capita change in packs/month due to the change in the fraction of the population who are ever smokers, the second term gives the change attributable to changes in the proportion of ever smokers who have quit, and the final term gives the change attributable to the change in smoking level among current smokers.
We use available survey data to estimate each quantity above to compute Δ(PACKS/P) from time1 to time2. The quantities, ΔE, ΔQ, and ΔC are estimated by the difference in the respective quantities (time2 – time1), and P, E, Q, and C are estimated by the average of the respective quantities at time1 and time2. These data are presented in Appendix A, with a sample calculation presented in Appendix B. For period 1, time1 is 1990 and time2 is 1996. For period 2, time1 is 1996 and time2 is 2002.
RESULTS
Decline in per capita cigarette consumption (sales data)
Figure 1 shows bimonthly raw data and the smoothed consumption trend line for per capita cigarette consumption from sales data from before California’s tobacco control programme began through 2002. The bars in fig 1 show the self-reported per capita cigarette consumption from the 1990, 1996, and 2002 CTS. In each year, the result is lower (by a factor of 30–35%) than that indicated by the sales data, a very consistent result observed previously.4,23 However, the distinct declining trend in the self-reported data is evident and parallel to the sales data.
Partitioning the decline in per capita consumption from self-reported data
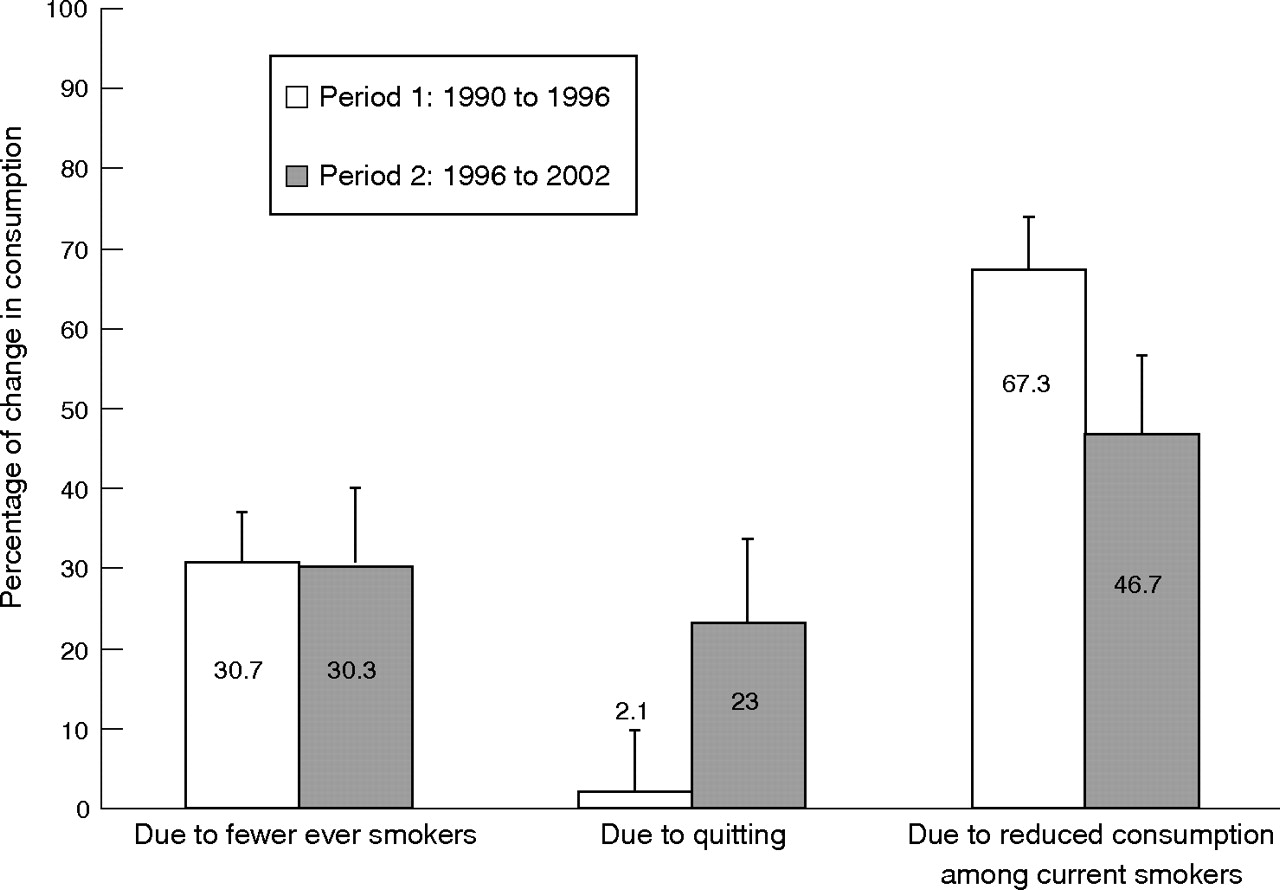
Appendix B presents the partitioning results for per capita changes in consumption as computed from equation (5), using CTS estimates overall and for various demographic subgroups (Appendix A). Figure 2 summarizes the overall results by plotting the percentage of the total per capita change accounted for by each component.
In period 1 (open bars, fig 2), about two-thirds of the per capita consumption decline was from reduced consumption among current smokers, and most of the remainder was from fewer ever smokers. However, in period 2 (shaded bars, fig 2), while the largest component of the per capita decline was still from reduced consumption among current smokers, quitting accounted for almost one-fourth of the total per capita decline in consumption.
Table 1 presents these percentages for demographic subgroups. In period 1, the only subgroups showing appreciable reductions from quitting were those 45 years and older (34% of total per capita change), and non-Hispanic whites and African Americans taken together (12% of total per capita change). Table A1 in Appendix A shows increases in the quit ratios for these groups, from mean (95% confidence interval) 68.2 (1.6)% in 1990 to 71.1 (0.7)% in 1996 for those 45 years and older, and from 56.9 (1.2)% in 1990 to 58.5 (0.7)% in 1996 for non-Hispanic whites/African Americans. The negative percentages in table 1 indicate that the population quit ratios for some groups were actually declining (Appendix A, table A1).
In period 2, however, a number of subgroups showed a substantial portion of the per capita decline from quitting (table 1). For females, 39% of the per capita decline was from quitting, reflecting an increase in the quit ratio from 56.1 (1.0)% in 1996 to 58.8 (1.1)% in 2002 (Appendix A, table A1). The percentage of the per capita decline from quitting was 26% in those 45 years and older, corresponding to an increase in the quit ratio from 71.1 (0.7)% in 1996 to 73.4 (0.9)% in 2002. One-third of the decline in per capita consumption in period 2 in non-Hispanic whites/African Americans was from quitting, with the quit ratio increasing for this group from 58.5 (0.7)% in 1996 to 62.6 (0.6)% in 2002. Finally, 21% of the decline in per capita consumption for those with and 23% of the decline for those without some college was from quitting.
However, for most subgroups, even in period 2, the largest portion of the decline was from reduced consumption in current smokers, followed by fewer ever smokers (table 1). The overall prevalence of ever smokers declined more (5.2 percentage points) between 1990 (48.5 (0.9%)) and 1996 (43.3 (0.6%)), than the 2.9 percentage point decline observed from 1996 to 2002 (39.4 (0.6%)) (Appendix A, table A1). In both periods, males showed a higher percentage of their per capita decline from reduced consumption than females, which is consistent with estimated consumption rates for current smokers in Appendix A, table A1; for males consumption among current smokers declined by 9.1 packs/month (from 26.1 (0.7) packs/month in 1990 to 17.0 (0.7) packs/month in 2002) compared to a 6.7 packs/month decline for females. In period 1, younger people showed a particularly large proportion of their per capita decline from reduced consumption among current smokers, reflecting a decline by 7 packs/month in period 1, compared to a decline of only 1 pack/month during period 2 (Appendix A, table A1).
DISCUSSION
Our results indicate that the notable decline in per capita cigarette consumption observed over the course of California’s comprehensive tobacco control programme was mostly from current smokers smoking less. In both periods, 1990–1996 and 1996–2002, this component accounted for a larger share of the decline than that attributed to fewer ever smokers or to smokers quitting. The percentage accounted for by a lower prevalence of ever smokers was the same (∼30%) in each period. Finally, in contrast to the 1990–1996 period, when quitting accounted for none of the decline, during 1996–2002, quitting accounted for an appreciable fraction of the per capita consumption decline (22%).
The finding that most of the per capita consumption decline can be attributed to current smokers smoking less is consistent with a recent econometric analysis that attributed changes in consumption between 1996 and 1999 to a decline in consumption among current smokers rather than to a decline in smoking prevalence.24 In our study, reduced consumption was observed in all population subgroups (see Appendix A, table A1). Some of the decline among current smokers may stem from an increasing fraction of current smokers not smoking daily.25 Also, younger cohorts of smokers may never reach the high levels of consumption observed in previous generations. Particularly from 1990–1996, smokers in the youngest age group showed a large decline.
While some smokers may maintain their accustomed nicotine level by smoking fewer cigarettes more intensely (compensation),26 some adjust to a lower nicotine level and therefore become less dependent.27,28 Since less dependent smokers are more likely to quit successfully,29–31 interventions that can reduce consumption in the short term may eventually increase quitting in the longer-term.29,32,33 A longitudinal population study found that smokers who reduced their consumption to < 15 cigarettes/day were more likely to successfully quit later.32
Because quitting is so difficult, it may not be realistic to expect that tobacco control measures (including increased excise taxes) will lead to an immediate drop in smoking prevalence from people quitting.24 Indeed, our results appear to support this; we found a high fraction of the per capita consumption decline was due to reduced consumption among current smokers in the earlier period (1990–1996), with an appreciable fraction from quitting activity only in the second period (1996–2002).
In contrast to smoking cessation, the evidence for improved health from smokers cutting their consumption is not definitive.34–38 One analysis of a large Danish cohort showed no advantage with respect to total mortality, cardiovascular diseases, respiratory diseases or tobacco-related cancers.36 More recent analyses of this database showed that a pronounced consumption reduction might lower lung cancer risk,37 but there was no effect on myocardial infarction risk.38
The percentage of the per capita decline (about 30% in both periods) attributable to a reduced proportion of ever smokers likely resulted more from a net migration into the state of non-smokers rather than from fewer people maturing to adulthood as never smokers. A preliminary analysis of total rather than per capita consumption showed a consumption increase from population growth that was overcome by the reductions due to the other components. The fastest growing segments of the California population are Hispanics and Asians (Appendix A, table A1). Since smoking among California adolescents has declined notably,39 we expect that the ever-smoking component will account for relatively more of the total decline in future years. From 1990 to 2002, the percentage ever trying a cigarette declined by 70% among 12- to 13-year-olds, by 53% among 14- to 15-year-olds, and by 34% among 15- to 17-year-olds.39 Smoking in the past 30 days among all ages of adolescents (12–17 years) declined 45% over this period.39 A recent decline in young adult smoking was also observed.39
In the second period (1996–2002), quitting among women was responsible for much of the increase in the fraction of the total per capita consumption decline from this source. While other population subgroups also appeared to show per capita consumption declines due to increased quitting (those ⩾ 65 years of age, non-Hispanic Whites/African Americans), it is possible that it was the women in these groups that accounted for most of the decline. Results from the evaluation of American Stop Smoking Intervention Study (ASSIST) demonstration project, in which 17 states received National Cancer Institute funding to seed tobacco control efforts, also showed an effect for women but not men in ASSIST states.40 A similar result was also observed in the Minnesota Heart Health Program, another population-based intervention.41 These population results are in contrast to the widely-held perception that women have a more difficult time quitting than men.42 Our California results suggest that male smokers in particular appear to be reducing their cigarette consumption rather than quitting.
The use of our decomposition methodology as an evaluation tool is hampered by the times for which data were available. The first California Tobacco Survey (1990) was conducted after the initial excise tax increase ($0.25/pack) that funded California’s tobacco control programme took effect in January 1989, so the expected43 decline (fig 1) due to the tax increase was not included in our analyses. Cigarette prices remained relatively stable from 1990–1996, with a small industry-led decline in 1993, and were stable through 1996.5 During this period, California’s comprehensive programme included an active multi-message anti-tobacco media campaign and community-based projects in the earlier years (1990–1993), but programme funding was reduced in 1994–1996.2 Workplace smoking restrictions took effect in 1995. During the second period (beginning in 1996), funding was restored for the media and community-based programmes. Further, cigarette prices increased sharply due to another excise tax increase ($0.50/pack) and a tobacco-industry-led price increase following the Master Settlement Agreement. The inflation-adjusted increase in cigarette prices was 53% between November 1998 and November 1999.5
What this paper adds
Per capita cigarette consumption has declined notably in California since the start of its comprehensive tobacco control programme. It is unknown what fraction of the decline has occurred from smokers quitting, from having fewer ever smokers in the population, or from current smokers smoking less. If the decline is mostly from smokers quitting, researchers suggest there would be a near-term health benefit to the population. However, if the decline stems mainly from the other two possible sources, most of the health benefit to the population would occur in the longer term.
The results from our study indicate that the majority of the decline in per capita cigarette consumption was from current smokers smoking less (> 50%, particularly among younger smokers from 1990–1996), followed by a reduced proportion of ever smokers in the population (∼30%). Between 1990 and 1996, a negligible fraction of the decline in per capita consumption was from ever smokers quitting, but 22% of the decline between 1996 and 2002 was from this source. Thus, instead of more immediate health benefits from current smokers quitting, benefits are more likely to accrue in the longer term, from there being fewer ever smokers, and from possibly a greater-proportion of less-addicted (and perhaps younger) smokers having an increased chance of future successful cessation.
Our analyses cannot directly attribute any specific intervention (for example, increased cigarette prices, workplace smoking bans, etc) to specific components of the consumption decline; it can only show the net effect. However, large properly coordinated population surveys before (to establish underlying trends from pre-existing conditions) and after a specific new intervention could allow the evaluation of their effects on per capita cigarette consumption. For instance, this approach could be used to evaluate the effect of the widespread distributing of free nicotine replacement products to smokers. It would be expected that the quitting component in the decomposition method would account for a relatively larger percentage of the total per capita decline following the intervention than in the previous control period.
In computing the quit ratio, we used as the numerator all ever smokers indicating that they were not smoking when surveyed. Many recent quitters will relapse to smoking. In fact, at any given point in time, an appreciable fraction of smokers are in the midst of an unsuccessful quit attempt and at least for a while not buying cigarettes. In 1990, 49% of California smokers reported making a quit attempt in the past year, but this percentage increased to 56% in 1996 and to 65% in 2002.5 This increased quitting activity, even if not successful, can decrease overall cigarette sales, and may account for a part of the discrepancy between sales and current smoker self-reported data (fig 1). We chose to include recent quitters in the quit ratio, so that this measure reflects quitting activity, not successful cessation.
In addition to the issues discussed above, there are other limitations to these findings. Self-reported cigarette consumption may not be accurate; smokers often report their consumption to the nearest half pack, and they may tend to round down instead of up. This number preference may also in part be responsible for the discrepancy between per capita consumption from sales data and from self-report (fig 1). Further, low-consumption smokers may report more accurately, so as per capita consumption declines, the discrepancy between sales and self-report might decrease.44 However, since the two trends are parallel, this should not seriously affect our results. Survey sampling errors and the use of averages and differences between survey estimates introduces error in addition to the approximation error (assumption of linearity) of our methodology. Nevertheless, it is unlikely that our results are due to severe artefacts introduced from these error sources. Finally, declining response rates may mean that the population of smokers captured in recent years differs from those in the earlier years. However, a recent analysis of both national and state-level surveys with different degrees of declining responses indicated that smoking prevalence estimates do not appear affected.45
While the most rapid benefit to public health from tobacco control efforts potentially would come from encouraging older smokers to quit,3,46,47 reduced initiation and reduced smoking intensity, particularly among younger smokers, may have greater benefits but in the longer-term. Preventing adolescents from starting to smoke would eventually lower adult smoking prevalence and thus per capita consumption, but it would take many years for the population health effects to become discernable. If younger cohorts of smokers never reach the consumption levels observed in older cohorts, they should experience better health from reduced exposure to harmful toxins. Also, if less addicted, they should be more able to quit successfully. The evidence is not yet definitive about the health benefits of smokers reducing their consumption, so how this factor will affect future health is unknown.
APPENDIX
APPENDIX A: SURVEY ESTIMATES USED IN COMPUTATIONS
Table A1 shows the number of adults in various demographic subgroups in each year, the prevalence of ever smoking, the quit ratio, and the average number of packs/month consumed by current smokers. California’s population is increasing rapidly. It is becoming more ethnically diverse; the number of non-Hispanic whites and African Americans has declined slightly, but the number of Hispanics, Asians, and those claiming another ethnicity has increased by 63% from 1990 (6 889 469) to 2002 (11 246 611). The population is also becoming older. The number of adults under 30 years has declined, while the number between 30 and 45 years has increased slightly, and the number age 45 years and older has increased by 27%, from 8 120 773 in 1990 to 10 288 601 in 2002. The population is also becoming more educated; in 1990 those without at least some college outnumbered those with some college, but the opposite was true in 2002.
Overall, in California, the percentage of ever smokers declined. The decline was evident in all age groups, suggesting that the decline is likely from the racial/ethnic distribution rather than from more people maturing to young adulthood as never smokers. Hispanic and Asian women have low smoking rates.21 An analysis of birth cohorts did not indicate that the prevalence of ever smoking declined when members of the same cohort reported their status in 1990, 1996, and 2002,5 which suggests that underreporting is not increasing as smoking becomes more socially unacceptable.
Females, those between 30 and 44 years of age, and those who never attended college showed the largest declines in ever smoking over the entire period (by at least 9 percentage points). The quit ratio for the entire California population of ever smokers has increased over the entire period from 1990 to 2002, with the greatest increase observed for females. There were also large increases for those aged 45 years and older and non-Hispanic whites/African Americans.
The mean (95% confidence interval) consumption level reported by current smokers declined by 33%, from 24.5 (0.7) packs/month in 1990 to 16.5 (0.5) packs/month in 2002. The steady decline over the entire period was greatest for those with some college experience, those between the ages of 30 and 44 years, and males (by at least 9 packs/month).
APPENDIX B: RESULTS OF COMPUTATIONS PARTITIONING CHANGE IN PER CAPITA CIGARETTE CONSUMPTION
Table B1 (left most column) shows the per capita changes cigarette consumption (in packs/month/person) during periods 1 (top) and 2 (bottom). As an example of how these changes were computed from equation (5) and the data in table A1, we show the per capita consumption changes for females from 1996–2002.
Δ(PACKS/P) = ΔE*(1−Q)*C+E*(−ΔQ)*C+E*(1−Q)* ΔC
E = (0.321+0.361)/2 = 0.341 ΔE = 0.321−0.361 = −0.04
Q = (0.561+0.622)/2 = 0.5915 ΔQ = 0.0622−0.561 = 0.061
C = (17.6+15.7)/2 = 16.65 ΔC = 15.7−17.6 = −1.9
Δ(PACKS/P) = −0.04*0.4085*16.65+0.341*(−0.0621)*16.65+0.341*0.4085*(−1.9)
−0.882 = −0.271+−0.346+−0.265
The results do not exactly match those in table B1 because many more significant digits were carried in the computer computation than in the rounded data from table A1.
Overall, the decline was greater during period 1 than during period 2. The other columns in the table show the changes stemming from the various composite factors: (1) changes in the percentage of ever smokers, (2) changes in the percentage of ever smokers quitting, and (3) changes in amount smoked by current smokers. Where the 95% confidence interval contains zero, the change due to a particular component cannot be considered as statistically different from zero.
The Hispanic/Asian subgroup showed less of a per capita decline in each period than did non-Hispanic whites/African Americans. The per capita decline for the youngest age group was much less in period 2 than in period 1.
All subgroups showed a decline from the component reflecting a lower percentage of ever smokers. This was not the case for the quitting component. During period 1, the quit ratio actually declined in some subgroups (for example, age groups under 45 years, see Appendix table A1), producing an increase in consumption (rather than decline) for the quitting component. Increases may reflect immigration of more ever smokers into the state. Many of the changes are not statistically different from zero. With one exception, the decline due to reduced consumption among current smokers was significant for all subgroups for both periods. The exception was for the Hispanic/Asian/other group over period 2.
California population status in 1990, 1996, and 2002
Changes in per capita packs/month (±95% confidence intervals) overall and as computed for* to demographic subgroups of the California population
Percentage of total change in consumption from each component
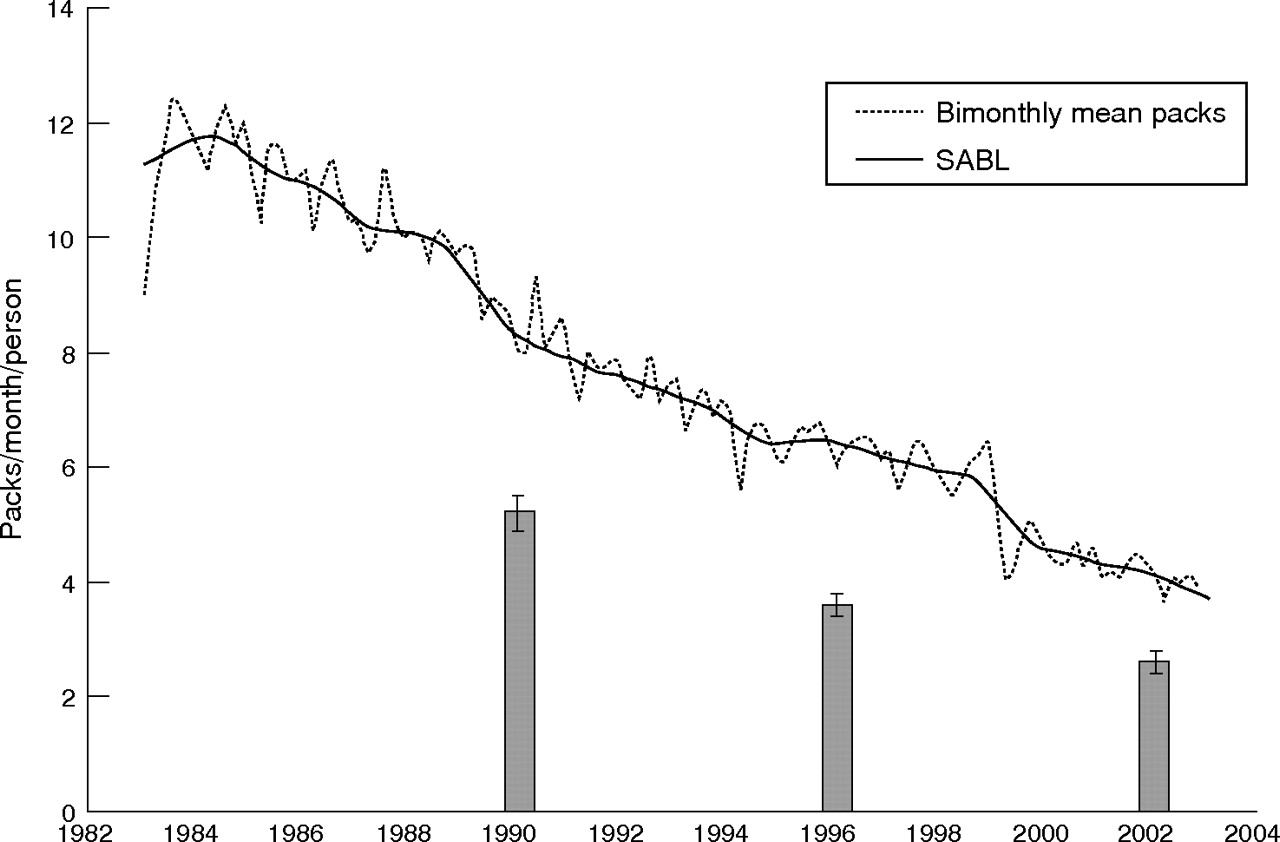
Bimonthly raw sales data and the smoothed consumption trend line for per capita cigarette consumption from cigarette sales data, for the period 1984 (before California’s tobacco control programme began) through 2002. The bars are per capita cigarette consumption from self-report by respondents to the 1990, 1996, and 2002 California Tobacco Surveys.

Percentage change in consumption due to fewer ever smokers, ever smokers quitting, and reduced consumption among current smokers. The open bars show results for period 1 (1990–1996) and the shaded bars for period 2 (1996–2002).
Acknowledgments
This work was supported by the Tobacco Related Disease Research Program grant 12RT-0082 from the University of California. Data for the California Tobacco Surveys were collected under contracts 89-97872 (1990), 95-23211 (1996), and 01-16370 (2002) from the California Department of Health Services, Tobacco Control Section, Sacramento, California.
REFERENCES
Footnotes
-
Competing interests: none declared