Article Text

Abstract
Aim: To measure exposure to second-hand smoke (SHS) in New Zealand bars before and after comprehensive smoke-free legislation enacted on 10 December 2004.
Methods: Cotinine is the main specific metabolite of nicotine and a well-established biomarker for SHS exposure. We measured cotinine levels in saliva of non-smoking volunteers before and after a 3 h visit to 30 randomly selected bars in 3 cities across the country. Two measures of cotinine before the smoke-free law change during winter and spring 2004, and two follow-up measurements in the same volunteers and venues during winter and spring 2005, were included.
Results: Before the smoke-free law change, in all bars and in all volunteers, exposure to SHS was evident with an average increase in saliva cotinine of 0.66 ng/ml (SE 0.03 ng/ml). Increases in cotinine correlated strongly with the volunteers’ subjective observation of ventilation, air quality and counts of lit cigarettes. However, even venues that were judged to be “seemingly smoke free” with “good ventilation” produced discernable levels of SHS exposure. After the law change, there remained some exposure to SHS, but at much lower levels (mean saliva cotinine increase of 0.08 ng/ml, SE 0.01 ng/ml). Smoking indoors in bars was almost totally eliminated: in 2005 only one lit cigarette was observed in 30 visits.
Conclusions: Comprehensive smoke-free legislation in New Zealand seems to have reduced exposure of bar patrons to SHS by about 90%. Residual exposures to SHS in bars do not result from illicit smoking indoors.
- SHS, second-hand smoke
Statistics from Altmetric.com
Before December 2004, smoking was prohibited in most, but not all, workplaces in New Zealand. Bars, restaurants and hotels were not required to be smoke free. This changed on 10 December 2004 when the Smokefree Environments Amendment Act 2003 came into force. Since that time, smoking is not permitted in any indoor place of work. After Ireland, which passed its legislation in March 2004, New Zealand was one of the first countries to introduce national, comprehensive smoke-free legislation.
The purpose of this study was to measure the impact of this legislation on personal exposures to second-hand smoke (SHS) in New Zealand bars. Previous papers1–3 have described exposures of bar workers in Ireland, New York and Scotland before and after legislation. The effects of reduced exposures to SHS on the respiratory health of employees in this industry have also been documented.3,4 However, we know of no other study that has examined the effects of smoke-free laws on exposures of the patrons of bars and hotels. In an earlier publication,5 we have described in greater detail the analytical methods and findings at baseline.
METHODS
This paper reports on two baseline (before smoke-free law change) and two follow-up (after smoke-free law change) measurements of SHS levels in 30 randomly selected bars during winter and spring of 2004 and 2005.
Selection of study regions
Exposures to SHS were measured in bars in Auckland, Wellington and Invercargill. Auckland and Wellington include about 42% of the New Zealand population. Areas within those cities that have higher than average populations of Maori and Pacific Island residents were sampled to ensure sufficient representation of these ethnic groups. Invercargill was chosen to provide representation of a smaller population centre. Rural bars were also chosen from the three regions. The selected bars do not necessarily reflect all bars within the study areas.
Selection of bar venues
Bars were selected randomly from the three regions using lists of licensed premises obtained from the local public health units. The random selection was stratified to include one or more “rural” bars from each area. All venues were visited by one of the investigators before their inclusion. To be included, venues had to be classified as clearly representing bars/taverns, rather than venues that were primarily restaurants with, for example, a side waiting area serving alcoholic beverages.
In addition, venues that had only recently opened (<1 year old), or had changed management in the past year, were excluded from the study for consistency. Venues that had attendance primarily driven by the popularity of particular nightly events (such as music bands) were excluded. Finally, venues had to be deemed to be safe and acceptable places to send groups of volunteers.
Selection of study participants
Volunteer non-smokers living or working in a non-smoking environment were recruited from within Institute of Environmental Science & Research (ESR) Wellington and Auckland offices, and from local public health units in Auckland and Wellington. In Invercargill, participants from a local teacher’s college were recruited through help from Public Health South (the local public health unit). The age range of all participants was 24–45 years. Each group consisted of five individuals (three women and two men). Each group of volunteers visited five different venues on Friday or Saturday nights over an 8-week period; visits were spaced 1–2 weeks apart to ensure that levels of salivary cotinine returned to baseline levels. Occasional substitutes in each group occurred because of various commitments of some participants.
Study design
Fifteen bars were chosen from Auckland, ten from Wellington and five from Invercargill. A power calculation was based on a pilot study conducted in Wellington.6 The results of this calculation were that a sample size of five individuals per venue would suffice to detect differences between pre-cotinine and post-cotinine levels (cotinine is the main metabolite of nicotine). In addition, the power calculation indicated that 30 venues would suffice to detect significant variations between pre- and post-legislation.
Bars were visited (on a Friday or Saturday night for a 3 h stay between 18:00 and 24:00 h) in July/August/September 2004 (winter) and again in October/November 2004 (spring). The average starting time in the study was 19:19 h.
During the visit, participants recorded the time of entry, the number of patrons present and the number of cigarettes lit in three 10 min intervals evenly spaced throughout the 3 h visit. Volunteers attempted to neither seek out nor avoid particularly smoky parts of the bar, but rather to try to capture a representative setting. All five volunteers stayed together throughout each 3 h bar visit.
Saliva (0.5–2.0 ml) was provided into a Salivette plastic tube just before entering the venue, and 5–15 min after exiting the venue. Samples with pre-cotinine levels exceeding 4 ng/ml were excluded (4 of 600 samples). The tubes were stored in a cooler until they could be placed in a −20°C freezer for longer-term storage. Studies in our laboratory show that cotinine in saliva is very stable, losing <10% after 1 week at room temperature (data not shown).
Two follow-up cycles were completed at the same times in 2005. The second half of the study took place in the month, on the night of the week and, as much as possible, at the time of day that the venue was sampled in 2004.
Analytical methods
Non-smokers carried out all extractions and extreme care was taken to ensure that contamination was eliminated. Each saliva sample (0.5 ml) was spiked with 50 μl of cotinine D3 internal standard solution, allowed to equilibrate for 5 min, basified and then extracted with 3 ml ethyl acetate. The ethyl acetate was transferred to culture tubes, glacial acetic acid (30 μl) was added and then the ethyl acetate was evaporated just to dryness in a Savant evaporator. The dry residue was reconstituted in 100 μl 10:90 acetonitrile and deionised water.
Analyses were conducted using a Shimadzu 10AVP high-performance liquid chromatography system prior to an Applied Biosystems API 300 Triple Quadrupole mass spectrometer equipped with a TurboIonSpray ion source. The high-performance liquid chromatography column used was a Phenomenex Synergi 41 μm Polar, 75×2.0 mm2 ID. The mobile phase was a gradient of acetonitrile and 5 mM ammonium acetate. A nine-point standard curve was created by spiking 0.5 ml of Barnstead H2O with cotinine standards over a concentration range of 0–40 ng/ml. A water blank, without added internal standard, was also analysed to ensure that there were no interfering substances. The intraday reproducibility (five replicates) of the standard (0.3 ng/ml) had a coefficient of variation of 9.4%. The interday coefficient of variation (3 days) was 14.5%. The detection limit was at least as good as 0.1 ng/ml of cotinine in 0.5 ml of saliva.
Statistical methods
Initially, descriptive analyses were performed focusing on the increase in cotinine levels following bar visits. To investigate regional and seasonal variations for increase in cotinine analyses, and to assess the association between the increase in cotinine with ventilation and air quality ratings, two-tailed t tests (or two-tailed t tests with Satterthwaite correction for unequal variances), Spearman correlation and analysis of variance were performed. Assumptions and checking of data were carried out before performing these analyses. Statistical analyses were performed using SAS System V.9.1.
Ethics and consent
Consent was obtained from the three centres where this research was conducted. Conditional approval from all three sites was granted by the Wellington Ethics Committee under reference number 04/07/045. All volunteers were given information sheets describing the risks of exposure to SHS, and were required to sign consent forms.
RESULTS
Before the smoke-free law change, the effect of spending 3 h in the selected bars was to increase salivary cotinine levels by an average of 0.76 ng/ml (SE 0.05 ng/ml) in winter and 0.54 ng/ml (SE 0.41 ng/ml) in spring. The mean baseline and pre-visit cotinine levels were 0.25 and 0.17 ng/ml, respectively.
After the smoke-free law change, the visits led, on average, to an increase in cotinine of 0.10 ng/ml (SE 0.01 ng/ml) in winter and 0.07 ng/ml (SE 0.01 ng/ml) in spring. Baseline cotinine levels averaged 0.05 ng/ml in both winter and spring 2005.
Regional variations
The pattern of changes in saliva cotinine across the three regions and two seasons remained similar before and after the smoke-free law change. Invercargill had the highest mean saliva cotinine increase of 1.26 ng/ml in winter 2004, 1.03 ng/ml in spring 2004, 0.12 ng/ml in winter 2005 and 0.10 ng/ml in spring 2005. The lowest mean saliva cotinine increase was in Auckland.
The lit cigarette count totalled 889 and 928 in winter and spring 2004, respectively, with the highest proportion of smokers in Invercargill. No smokers were seen in winter 2005 and only one smoker was seen smoking inside a bar during spring 2005. Smoking outside bars was common, on footpaths close to entrances, and in outdoor areas set up to serve patrons.
Cotinine increases and ventilation
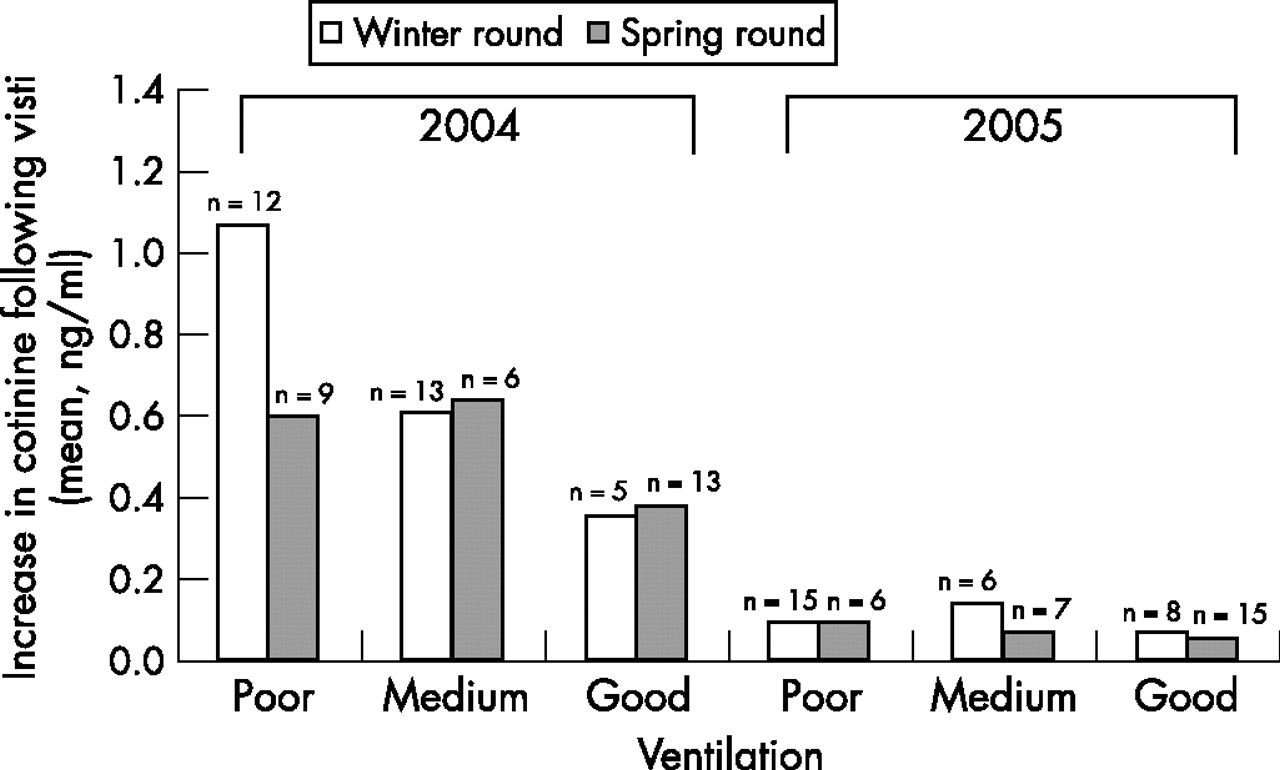
Study subjects filled in a questionnaire rating the ventilation on a scale of 1–3 (poor, medium and good). The number of bars rated in winter 2004 was 30, in spring 2004 was 28, in winter 2005 was 29 and in spring 2005 was 28. Figure 1 illustrates the association between the cotinine increases and ventilation ratings for both seasons before and after the smoke-free law change.

Average increase in saliva cotinine before and after legislation, and perceived quality of ventilation in bars (n, number of bar visits in each category).
Cotinine increases and perceived air quality
The trends across seemingly smoke free, mildly smoky, moderately smoky and severely smoky bars for both winter and spring 2004 seasons are positive and significant (p<0.001). The winter mean cotinine increase was 0.34 ng/ml for seemingly smoke-free bars (8 bars were rated), 0.73 ng/ml for mildly smoky bars (8 bars were rated), 0.96 ng/ml for moderately smoky bars (8 bars were rated) and 1.11 ng/ml for severely smoky bars (5 bars were rated). The spring mean cotinine increase was 0.29 ng/ml for seemingly smoke-free bars (7 bars were rated), 0.52 ng/ml for mildly smoky bars (10 bars were rated), 0.55 ng/ml for moderately smoky bars (5 bars were rated) and 0.69 ng/ml for severely smoky bars (8 bars were rated).
In winter, 13 bars were rated to be seemingly smoke free, with a mean cotinine increase of 0.09 ng/ml, 5 bars were rated to be mildly smoky, with a mean cotinine increase of 0.11 ng/ml, 11 bars were rated to be moderately smoky, with a mean cotinine increase of 0.10 ng/ml, and none were rated to be severely smoky. In spring 2005, 27 bars were reported to be seemingly smoke free, with a mean cotinine increase of 0.06 ng/ml, and one bar was rated to be mildly smoky, with a mean cotinine increase of 0.23 ng/ml.
Overall, the average increase in cotinine resulting from a visit to a bar after the legislation was passed (0.08 ng/ml) was 12% of the average increase observed before legislation (0.66 ng/ml). The difference between these two figures is a measure of the impact of the smoke-free law: we conclude that legislation reduced exposure of patrons to SHS by about 90%.
DISCUSSION
The saliva cotinine analysis provides a quantitative and objective measurement that correlates with subjective measures of air quality in the study. However, it was evident that this test detected exposures to SHS even when individuals perceived venues to be “seemingly smoke free,” and to have “good” ventilation. Thus, cotinine in saliva, measured by this analytical method, provides a highly sensitive identifier of exposures to SHS, and indicates that improved ventilation to clear visible smoke will not be sufficient to prevent exposure to SHS in bars that allow smoking.
Regional variation
The study covered urban, suburban and surrounding rural areas in three centres of New Zealand and found similar relationships between subjective measures of air quality and salivary cotinine at each site. It is noteworthy that the less densely populated areas showed greater exposures to SHS, and exposures tended to be greater in southern centres. The 30 bars randomly selected in this study provided a good spectrum of exposures to SHS and also provided a corresponding range of subjective ratings of air quality and ventilation.
Variation over time
Higher exposures were seen in the winter than in the spring before and after the smoke-free law change, possibly because of open windows and more rapid air circulation. The pre-visit cotinine levels were much lower in 2005 than in 2004 (about 80% down in the winter round, and reduced by close to two-thirds in the spring round). This is not due to changes in laboratory measures. A secular decline in cotinine levels has been reported in the US,7 and our findings may reflect a similar long-term pattern in New Zealand. However, the size of the drop in the space of 1 year suggests that the smoke-free legislation may have influenced exposures to SHS in other settings than just bars and hotels. In some Australian states, the introduction of workplace smoking bans was accompanied by a reduction in smoking in homes. The 2004 legislation may have had similar effects.8
Underestimate of exposure to SHS because of delay in peak cotinine
The half-life of cotinine in saliva has been reported to range from 16 to 19 h.9 On the other hand, nicotine has a half-life of roughly 2 h depending on ethnicity and some physiological states such as pregnancy.10 This means that the patrons in the current study would have had peak salivary cotinine levels approximately 3–4 h after leaving the bar venue—it was not practical to collect samples at this time, however, as many bar visits were late at night. Therefore, the increases in cotinine reported here may underestimate the total exposure to SHS, but this will not affect the comparison of conditions before and after legislation because the time from entering the bar to collecting saliva specimens was constant throughout the study.
Exposure to SHS
Before the smoke-free law change, the increase in salivary cotinine averaged over the winter and spring visits was 0.66 ng/ml at 3 h. This is less than the increases reported previously for bar staff,11 but is consistent with the findings from the Wellington pilot study, in which the average increase in patrons after bar visits in mid-winter 2003 was 1 ng/ml.6 After the smoke-free law change, exposures to SHS were reduced by about 90%, but not eliminated altogether. Cigarette counts indicate that the legislation was effective in almost totally eliminating smoking in bars: only one lit cigarette was observed in 30 visits. (Total numbers of patrons were affected little by the legislation—there was a 2% increase from 2004 to 2005.)
Our findings indicate that where exposures to SHS persist, these result from smoking outside or closely associated with bars. Smoke residues in soft furnishings in bars may result in some continuing exposure to nicotine immediately after smoking bans are introduced, but this effect would not explain cotinine peaks 9 months later. A study of cotinine levels in Irish bar workers similarly found that legislation resulted in cessation of smoking indoors, but exposures to SHS continued.1 In the Irish study, a single cotinine level was taken from each volunteer during their shift, and these levels fell by about 70% after the smoking ban.
The New Zealand study is novel in two respects. It reports exposures among patrons, who constitute the great majority of individuals exposed to SHS in hotels and bars. Moreover, this study reports for the first time the change in cotinine levels associated with bar visits, rather than average levels before and after legislation. In this way we have adjusted for secular trends in cotinine levels in the general population caused by factors other than the smoke-free laws, such as the long-term decline in the prevalence and rate of smoking. (The effect of these changes has been considerable: between 1988 and 2002, for instance, serum cotinine levels in non-smokers in the US fell by 70%.7)
What this paper adds
-
Before December 2004, smoking was prohibited in most, but not all, workplaces in New Zealand. Bars, restaurants and hotels were not required to be smoke free. This changed on 10 December 2004 when the Smokefree Environments Amendment Act 2003 came into force. Since that time, smoking is not permitted in any indoor place of work. After Ireland, which passed its legislation in March 2004, New Zealand was one of the first countries to introduce national, comprehensive smoke-free legislation.
-
The purpose of this study was to measure the impact of this legislation on personal exposures to second-hand smoke (SHS) in New Zealand bars, and it was concluded that the comprehensive smoke-free legislation in New Zealand seems to have reduced exposure of bar patrons to SHS by about 90%. Residual exposures to SHS in bars do not result from illicit smoking indoors.
We conclude that the legislation in New Zealand provided substantial protection of patrons in bars and hotels (and by deduction, workers also), but the legislation has not entirely eliminated exposures to SHS at these venues. Further studies need to determine the contribution of smoke drifting indoors, and the exposures of patrons (and staff) to SHS from designated smoking areas outdoors.
Increases in saliva cotinine levels after visits to randomly selected bars in urban, suburban and surrounding rural areas of Auckland, Wellington and Invercargill, before and after the introduction the of comprehensive smoke-free legislation in December 2004
Acknowledgments
The New Zealand Ministry of Health funded this study. We thank the study participants, and Clare Bear from the Ministry of Health, for their contributions.
REFERENCES
Footnotes
-
Competing interests: None declared.