Article Text

Abstract
Objectives: To examine the impact of health warnings on smokers by comparing the short-term impact of new graphic (2006) Australian warnings with: (i) earlier (2003) United Kingdom larger text-based warnings; (ii) and Canadian graphic warnings (late 2000); and also to extend our understanding of warning wear-out.
Methods: The International Tobacco Control Policy Evaluation Survey (ITC Project) follows prospective cohorts (with replenishment) of adult smokers annually (five waves: 2002–2006), in Canada, United States, UK and Australia (around 2000 per country per wave; total n = 17 773). Measures were of pack warning salience (reading and noticing); cognitive responses (thoughts of harm and quitting); and two behavioural responses: forgoing cigarettes and avoiding the warnings.
Results: All four indicators of impact increased markedly among Australian smokers following the introduction of graphic warnings. Controlling for date of introduction, they stimulated more cognitive responses than the UK (text-only) changes, and were avoided more, did not significantly increase forgoing cigarettes, but were read and noticed less. The findings also extend previous work showing partial wear-out of both graphic and text-only warnings, but the Canadian warnings have more sustained effects than UK ones.
Conclusions: Australia’s new health warnings increased reactions that are prospectively predictive of cessation activity. Warning size increases warning effectiveness and graphic warnings may be superior to text-based warnings. While there is partial wear-out in the initial impact associated with all warnings, stronger warnings tend to sustain their effects for longer. These findings support arguments for governments to exceed minimum FCTC requirements on warnings.
Statistics from Altmetric.com
Tobacco is a very unusual consumer product, given that it is highly addictive and kills around half of its long-term users.1 For these health reasons and for consumer rights reasons,2 there are strong arguments for governments to mandate effective health warnings on tobacco products. Such health warnings cost taxpayers nothing and potentially reach smokers every time they take a cigarette from a pack, buy a pack or otherwise notice one.
The Framework Convention for Tobacco Control (FCTC)3 states that warning labels “should be 50% or more of the principal display areas but shall be no less than 30% of the principal display areas” (Article 11). The guidance on graphic images is less definitive: “may be in the form of or use pictures or pictograms”. Indeed, despite a growing body of research on tobacco warning labels,4 there is still some uncertainty over the relative impacts of warnings using graphics versus just text, for the optimal size of warnings, and for how long the impact persists. The rationale for the potentially greater effectiveness of graphic warnings over text-only, is that they provide more information (a picture tells a thousand words) including the evoking of emotional responses to the images, and that together this is more likely to stimulate concerns.
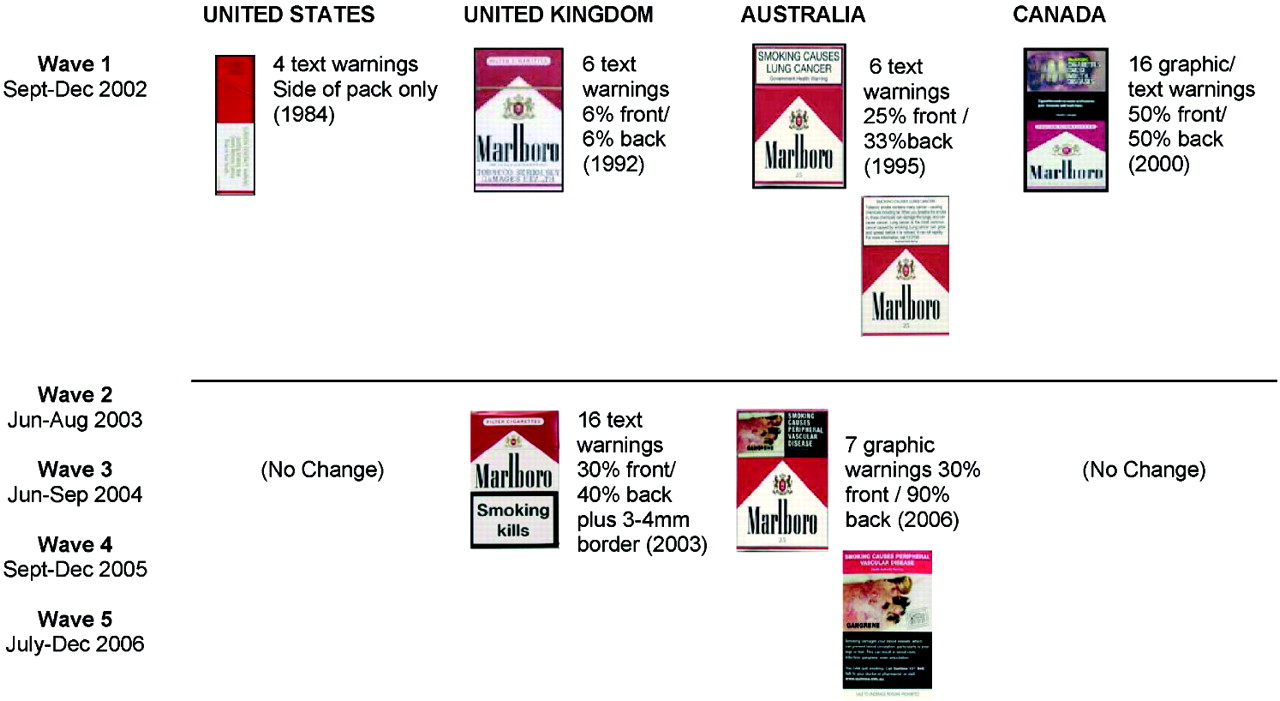
Countries vary considerably in the health warnings they mandate (see fig 1). For example, the US has had a small text-based warning on one side of the pack since 1984. The UK introduced new larger warnings in early 2003, increasing the size from 6% on the front and back to 30% on the front and 40% on the back surrounded by a border of 3–4 mm, which adds approximately 13% to the total size (in response to EU Directive 2001/37/EC). Also the number of warnings was increased from six to 16 (two for the front, and 14 on the back). Positioning on the pack was not specified, but is usually at the bottom. Australia introduced new graphic warnings from March 2006.5 6 Australian warnings went from six black text on white background warnings covering 25% of the front and 33% of the back of the package, to seven graphic warnings covering 30% of the front and 90% of the back. Canada has had graphic health warnings covering 50% of both main faces since December 2000.7 Both Australian and Canadian warnings are mandated to be at the top of the faces on which they appear.

Mandated health warnings on cigarette packets for the countries in the International Tobacco Control four-country survey: 2002–6.
Research indicates greater impact of the larger graphic Canadian health warnings over the smaller US text warnings8 9 10 11 12 and over small text-only warnings in Mexico.13 Similarly, graphic warnings in Thailand have greater impact than text-based Malaysian warnings,14 which are similar to those in the US. There is also evidence that if a country changes from smaller to larger more contrasting warnings, the impact of the warnings is increased like in Australia (which in 1995 changed from four UK pre-2003-like warnings to six of the kind depicted in fig 1 for Australia)15 and the UK (which increased size as well as contrast and content).16
Previous evidence from the ITC Project surveys indicates greater impact on smokers from Canadian graphic warnings relative to text warnings in the US, UK and Australia.16 17 The differences between the impact of the large graphic Canadian warnings and newer larger text warnings in the UK (but still smaller than Canadian warnings) were mixed. Salience (reading and noticing) was higher for the text warnings when controlling for length of time since introduction. However, for cognitive and behavioural reactions the graphic Canadian warnings had more sustained effects. Further, the levels of forgoing cigarettes in reaction to the new UK warnings never reached the levels in Canada on any wave even though the Canadian warnings were more than two years older.16 The most recent ITC Project work18 has strengthened the existing evidence19 20 that reactions to warnings predict subsequent quitting. We found that forgoing cigarettes as a result of noticing warnings and quit-related cognitive reactions to warnings are consistent prospective predictors of making quit attempts, while warning salience and avoidance were also positively predictive in bivariate analyses, but these effects disappeared in multivariate analyses, suggesting that these effects are mediated through some combination of cognitive reactions and/or forgoing.18
The purpose of the current study was primarily to provide new information on the impact of health warnings on smokers by comparing the short-term impact of new (2006) graphic Australian warnings with; (i) the earlier (2003) UK move to larger text-based warnings; (ii) the continuation of (2000) graphic warnings in Canada; and also to further assess the sustainability of effects over time.
Methods
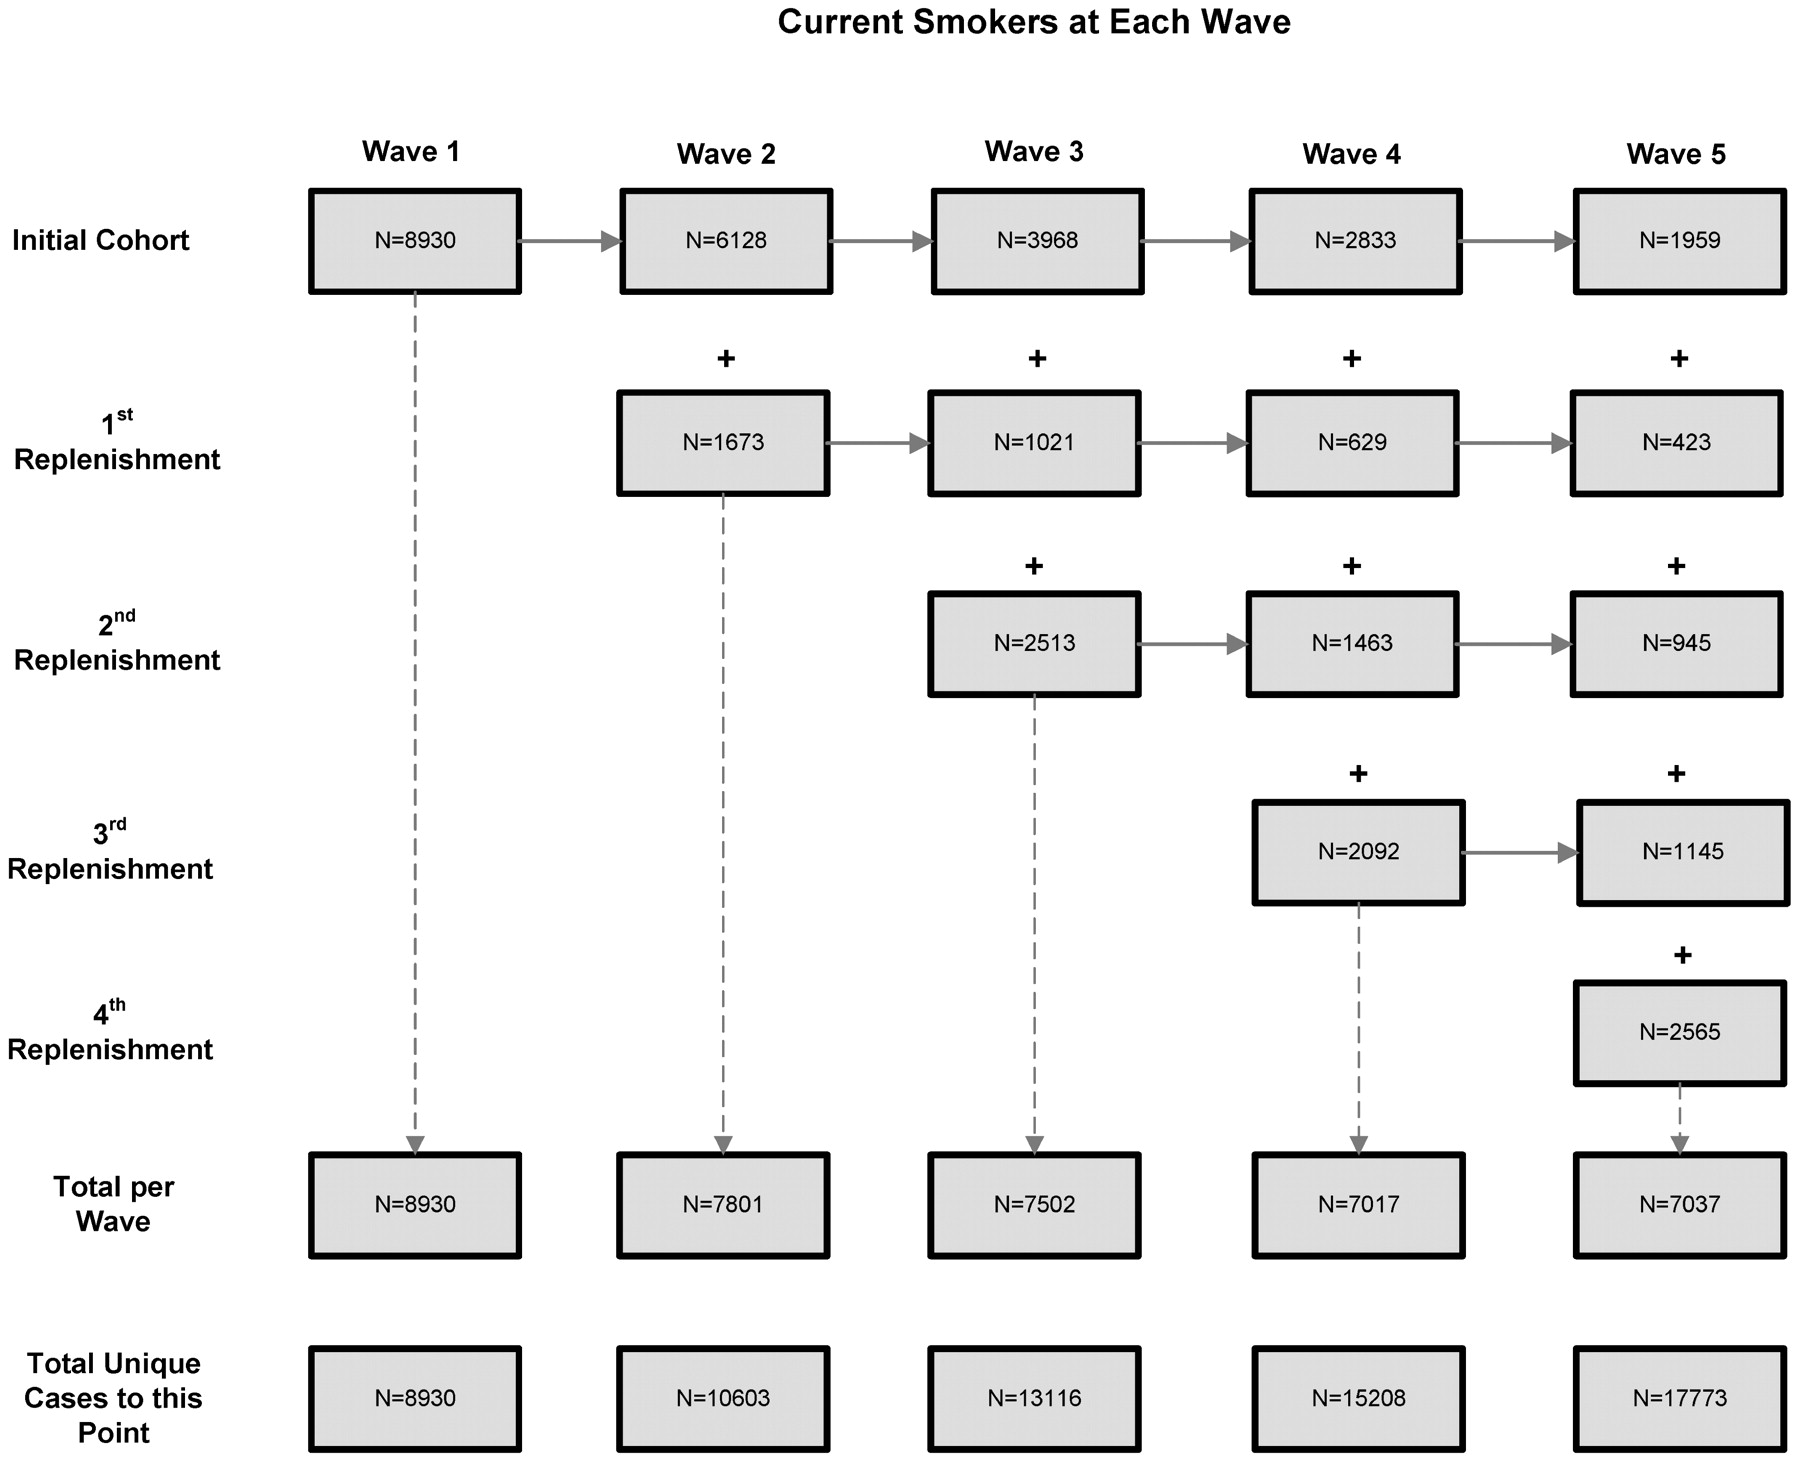
The analyses reported here are based on the answers of smokers who responded to at least one of the five waves of data collection. A full description of the ITC Project conceptual framework and methods have been published elsewhere.21 22 Further details surrounding the ITC Project methods relating to questions on health warnings have also been published.16 To summarise, the ITC Project uses a prospective multi-country cohort design and involves annual telephone surveys of representative cohorts of adult smokers with replenishment each year (to maintain country sample size at 2000 or more, sampled via random-digit dialling). The analyses reported in this paper are restricted to current smokers as ex-smokers have less opportunity to see cigarette packs. Over the five waves of the survey (2002–6) reported here the country-specific samples of smokers are (n = 17 773): Canada (n = 4305), United States (n = 5083), United Kingdom (n = 4274) and Australia (n = 4111). The sample size and the year-to-year replenishment and attrition are depicted in figure 2. In each wave, attrition is largely the result of loss, but also of having quit at that wave (21–30% in waves 2–5).

Structure of the sample showing attrition (lost to follow-up plus quitting) and replenishment across waves for current smokers.
Measures
At each wave, salience of the health warnings was assessed by asking how often over the preceding month respondents had noticed the warnings and read or looked closely at them (both on 5-point scales: never to very often). Using the same time frame they were also asked about two behavioural reactions: frequency (if ever) of forgoing cigarettes as a result of the warnings (coded ever versus never) and about four kinds of avoiding the warnings (cover-up, keep out of sight, use cigarette case or avoid particular labels) from which a binary variable, “no avoidance-any avoidance”, was computed. From wave 2, we also asked about cognitive responses in terms of the extent to which the warnings both made the respondent think about the health risks of smoking, and made them more likely to quit smoking (4-point scales: “Not at all” to “A lot”). Respondents were also asked about various factors that may have motivated them to think about quitting in the past six months, including “warning labels on cigarette packages” with three response options: “Not at all”, “Somewhat”, and “Very much”.
To simplify the analyses, the above measures were factor analysed for each wave and two multi-item factors emerged. As a result, we combined the two salience measures (Cronbach’s α = 0.67–0.81, waves 1–5) and the three cognitive measures (α = 0.78–0.80, waves 2–5). For comparisons that controlled for time since implementation, UK levels in 2003 were compared with Australian rates in 2006 (reflecting the three-year difference in implementation dates), and UK rates were compared with Canadian rates two years and three years earlier (reflecting the 2.5-year difference in implementation dates).
All analyses were conducted using Stata 10 SE. Generalised estimating equation (GEE) models were employed to test between-country differences, as well as any longitudinal changes within countries over the survey waves. The GEE models were conducted on all available data from all waves at which the respondent was a smoker. All-point estimates were weighted to reflect appropriate age and gender prevalence estimates within geographic strata, as well as to account for non-response and the survey design.
Results
New graphic Australian warnings
At wave 5 (2006), after the new (and changed to graphic) Australian warnings were implemented, all four measures of self-reported impact increased significantly among Australian smokers (fig 3). These significant changes in wave 5 occurred relative to the wave 4 survey (all p<0.001), relative to any other wave-to-wave changes and relative to the other three countries over those two waves (all p<0.001). The increase in avoidance of the warnings was particularly marked (fig 3D).

Responses of current smokers to cigarette health warnings between 2002 and 2006. The arrow near the left of each graph indicates the date that new health warnings (text) were implemented in the UK; the one to the right indicates the new graphic warnings for Australia (AU). The bars are 95% confidence intervals. (A) Salience (noticing and reading) of warning labels (range = 1–5). (B) Cognitive response to warning labels (quit related) (range = 1–3.67). (C) Forgo cigarettes (proportion “at least once”). (D) Avoid warning labels (proportion using at least one strategy).
New Australian warnings vs other countries
We next compared the absolute levels and waves 4–5 (2005–6) changes found in Australia with those found in the UK in 2003 (and where possible the 2002–3 changes) (see table 1 and fig 3). Planned comparisons revealed that the salience of the UK warnings both increased more and reached a higher level than the new Australian pack warnings in the survey following their appearance. By contrast, peak levels of cognitive responses were higher in Australia in 2006 than the UK in 2003 (fig 3B), but because two of these questions were not asked in 2002, we were unable to assess change. There were no significant differences in forgoing cigarettes (fig 3C) either for peak values or for change. By contrast, avoidance was much greater for the Australian graphic warnings on both peak and change measures (fig 3D).
Comparison of peak values and where possible, increases in reactions to health warnings in Australia (AU) versus UK
We also compared smokers’ levels of response to three measures in Australia in 2006 with those obtained from smokers in Canada in 2002 (at which time the warnings had been in place for nearly two years). Smokers in Australia reported higher peak salience levels of the warnings and avoiding looking at the warnings compared to their counterparts in Canada (all p values <0.001). However, there was no difference between the two countries in forgoing cigarettes as a result of looking at the warnings. Cognitive responses to the warnings were higher in Australia in 2006 (around 6 months post-implementation) than in Canada in 2003, 2.5 years after implementation (p<0.001).
Warning wear-out
We were also able to extend the comparison of Hammond et al16 between the reactions of UK smokers to their text-based warnings in 2006 (3.5 years after their introduction) with reactions to the Canadian graphic warnings in 2003 and 2004, allowing for the fact that the UK warnings were introduced around 2.5 years after the Canadian warnings. Reported salience of the UK warnings remained higher than the Canadian warnings (both p values<0.001). However, for the other measures a different picture emerges. For both cognitive responses and forgoing cigarettes, when controlling for implementation, levels in 2006 in the UK were lower than for Canada (cognitive reaction: p<0.001, for both two-year and three-year corrections: forgoing cigarettes: p = 0.004 and <0.001, respectively).
Finally, we compared reactions to the warnings in 2006 in the two countries that had augmented warnings in recent years to those in the US, which has the least prominent warnings and has not changed them for decades. All comparisons for Canada showed higher responses than the US levels (all p values<0.001) as did two of the four for the UK (salience and cognitive responses both p values<0.001).
Discussion
Principal findings
Introduction of new graphic warnings in Australia increased their salience, cognitive reactions and behavioural responses to them. Focusing on the two strongest predictors of subsequent quitting, cognitive responses and forgoing cigarettes,18 the Australian warnings produced stronger cognitive responses and a trend towards greater forgoing than the UK text-only warnings, suggesting they are more effective, at least in the short term. Whether this is the result of the graphics or the greater total size is less immediately clear.
Hammond et al16 showed that, controlling for time since implementation, Canadian warnings elicited greater avoidance, cognitive responses and forgoing than the UK ones, and we extended this for one more wave, although the effect for forgoing was no longer significant. We have shown that in the year after implementation the Australian warnings elicited more avoidance and cognitive responses than the UK ones, and non-significantly greater forgoing. Taken together, this suggests that the Canadian warnings are probably the most effective, followed by the Australian ones, then the UK ones.
The crucial policy question is what determines this relative ranking. Identification of even marginal benefits for one form of warning over another is of potential public health importance as the costs of implementing different systems only differ marginally (at least to governments) and the evidence is that warnings can influence subsequent quitting18 and thus any additional benefit is bound to be cost-effective. Warning size is almost certainly critical, but it is less clear as to how to assess it. If it were the total amount of pack warning on the faces, then the Australian warnings, with on average 60% (30% front, 90% back), would be expected to perform better than the Canadian ones (50% of the two main faces) (assuming no impact from the pack inserts in Canada). Consistent with the front of pack being more important, one of us (RB) conducted a survey of how packs (with the pre-2006 text warnings) were displayed by smokers in public settings (tables at restaurants and cafes) in inner Melbourne, Australia. We found that 94% of 160 observed packs were sitting front face up, and only 2% with the back face up (the remaining 4% were standing on one of the smaller faces). Also, it is much easier to remove a cigarette from a flip-top pack when the front face is facing the smoker. All this suggests that it is the size of the warning on the front of the pack that is critical to its immediate impact on smokers (at least for packs with a natural front).
One other factor that might affect warning impact is the degree of difference from the warnings they replace. The UK warnings are much larger and far more prominent than the warnings they replaced, whereas, for the front of pack, the new Australian warnings are only marginally larger, the main difference being the addition of the graphic imagery. This suggests that any contrast effect probably should favour the UK warnings, so cannot explain why they have slightly lower potency.
If the front of pack warning size is critical to warning impact, then the superiority of the Australian warnings over the UK ones is the strongest evidence to date of graphic warnings being superior to text-only ones as they are the same size as the UK ones, or noticeably smaller if the border is taken into account. Additional evidence from this study which favours graphic over text-only warnings comes from the comparison between the Canadian (graphic) and UK (text-only) warnings. Both the cognitive reactions and forgoing cigarettes were larger and more sustained in response to the Canadian warnings, especially when controlling for the difference in implementation time (see also Hammond et al16). It seems unlikely that these benefits could be explained by the marginally smaller size of the front of pack UK warnings, especially given the comparison with the even smaller Australian ones. We also think it unlikely that positioning on the pack (UK bottom of face, Australia and Canada top of face) could account for the difference, but acknowledge that we cannot test this. The evidence is strengthening for the superiority of graphic warnings in areas where it appears to make the most difference to quitting activity.
We have found marked increases in avoidance of warnings, especially to graphic warnings. There has been concern that this might be a net negative.23 However, the evidence shows that such reactions are generally positively associated with quitting,11 18 24 which should assuage these concerns.
The evidence is building that text-only and graphically enhanced warnings have at least partly different routes to effect, with the graphic warnings being associated with greater warning avoidance and the text-only ones associated with greater noticing and/or close scrutiny (for example, from previous ITC Project studies14 16 17 25 and other research26 27 28). The effect may be in part because text needs to be read to be taken in, while pictures can be taken in at a glance, and partly because smokers are more prone to avoid the more confronting graphic warnings. These findings are also consistent with the evidence29 for increased potency of public health campaigns that arouse an emotional response.
This all suggests that the mechanism of effect for the superiority of graphic warnings is that they elicit greater emotional engagement with the information, and that it is this emotional engagement that drives much of the subsequent quitting-related activity.
The overall decline in reactions to new warnings in Canada and the UK over time appears to be only partial given the comparison with levels of reactions to the small text-only warnings in the US. There would appear to be both a multi-year long-term effect of warnings as well as an additional shorter-term effect. This would suggest that there may be health promoting advantages in changing the health warnings from time to time, but failure to do so will not negate all the beneficial effects.
Strengths and weaknesses of the study
The prospective multi-country cohort design used in this study has many strengths for evaluating tobacco control policies.30 Because we can demonstrate both effects on absolute levels and on changes, we are effectively controlling for any differences in characteristics in respondents between the various countries.
The main weakness of the study, as noted in relevant places above, is that the warning systems studied varied on a range of features, so it is not possible to control for some of those effects. Also, the within-country and between-country control effect is only partial, as the magnitude of the difference between old and new warnings may be a factor affecting responses over and above the features of the new warnings.
Responses to questions on warnings in Australia may have also been partly influenced by exposure to tobacco control mass media campaigns using identical imagery to that of some of the new warnings. However, the relevant campaigns run in Australia were conducted several months before the ITC survey months. The fact that graphic warnings on packs lend themselves to be used with complementary campaigns in other media, should not be seen as a limitation for determination of effects, but only a potential additional mechanism for the magnitude of effects.
There are other limitations with such surveys including bias from non-response and attrition, but previous ITC Project studies16 using the first four waves of data found no evidence of “time-in-sample” effects or sample bias due to attrition when analyses were repeated with the “cohort” sample only (that is, only those who completed all waves) and the “repeat cross-sectional” sample (that is, the first wave of data from each respondent only). This study relies on self-reports, but we have no reason to believe that they are not valid indicators. Indeed, we do have independent data that new warnings do have behavioural impacts. There were increased calls to the national Australian quitline after the new warnings were introduced (unpublished national quitline data). Others have found similar effects on quitline calls elsewhere.31 32 33 It is also consistent with reduced tobacco sales in Canada after new warnings were introduced (the biggest decline in a decade34 35). Further, as noted earlier, there is evidence that some of the outcomes we assessed are prospectively predictive of making quit attempts.18 19 20
In our analyses we have not assessed the impact of the actual thematic content of the warnings. It is very difficult to separate out the effects of multiple warnings as we have no control over exposures, so cannot say anything about the relative merits of the specific warnings in the three countries that have sets of warnings. There is other evidence that the more graphically compelling warnings are rated by smokers as most effective,28 but we do not know what effects other aspects of the material might add; for example, what impact provision of quit smoking advice (as in Canada on the inside of the pack) or of the quitline number (as in Australia) might have on overall impact.
Finally this study focuses on reactions of existing smokers, we can say nothing about the potential of strong warnings to prevent uptake, but a benefit is plausible here, also based on other work.8 36
Research implications
Further work is necessary to determine sustainability of warning effects, and particularly the use of two rotating sets of warnings, as introduced in Australia. In this study smokers had only been exposed to a set of seven warnings for around 6 months. We need more research on longer-term effects, and of the impact of having a second set of rotating warnings on warning wear-out (six more were introduced in the months after our survey in Australia and these will rotate year and year about with the seven original ones). Further research is also necessary to help fine-tune the use of warnings in terms of all the components that remain understudied: the mix of graphics and text, the optimal warning size (for example, perhaps up to 90% of the front of the pack), the thematic content, the optimal refreshment rate and the generalisability of the findings to different cultures and stages of the tobacco epidemic.
Implications for health policy
The balance of evidence, to which this study adds, is that larger warnings are more effective; and that graphic warnings evoke stronger cognitive reactions and may produce more sustained cognitive and behavioural reactions than text-only warnings. As there is no additional cost to government of mandating stronger warnings, any benefit, however marginal, should be exploited. Health workers can therefore make evidence-based arguments for their governments exceeding FCTC recommendations (that is, 50% of the front of the pack) rather than just meeting the FCTC’s minimal requirements. They also have evidence to advocate for graphic warnings in preference to text-only warnings, and should encourage a regulatory system that requires frequent updating of the warnings.
What this paper adds
This paper builds on the accumulating data from the ITC study to demonstrate the potency of new graphic health warnings introduced in Australia, and of persisting greater impact of Canadian graphic warnings over UK text-only ones. It also provides more evidence that graphic warnings produce greater levels of emotionally charged reactions. This evidence is used to build the case that graphic warnings are generally more effective than text-only warnings in that they stimulate more quitting activity and that their effects persist for longer than text-only warnings. This strengthens the case for countries going beyond base FCTC obligations and implementing larger graphic warnings.
Acknowledgments
None of the sponsors played any direct part in the design and conduct of the study; the collection, management, analysis, and interpretation of the data; or the preparation, review and approval of the manuscript. RB had full access to all of the data in the study and takes responsibility for the integrity of the data and the accuracy of the data analysis. NW, HHY and WH assisted in statistical analyses and the other authors all helped to design the study and write the manuscript.
REFERENCES
Footnotes
Funding This research was funded by grants from the National Cancer Institute of the United States (R01 CA 100362), the Roswell Park Transdisciplinary Tobacco Use Research Center (P50 CA111236), Robert Wood Johnson Foundation (045734), Canadian Institutes of Health Research (57897 and 79551), National Health and Medical Research Council of Australia (265903 and 450110), Cancer Research UK (C312/A3726) and Canadian Tobacco Control Research Initiative (014578), with additional support from the Centre for Behavioural Research and Program Evaluation, National Cancer Institute of Canada/Canadian Cancer Society.
Competing interests None.
Ethics approval The study protocol was approved by the institutional review boards or research ethics boards of the University of Waterloo (Canada), Roswell Park Cancer Institute (United States), University of Strathclyde (UK), University of Stirling (UK), The Open University (UK) and The Cancer Council Victoria (Australia).
Provenance and peer review Not commissioned; externally peer reviewed.