Article Text

Abstract
Objective The Smoke-free Illinois Act was implemented in January 2008, one month after the beginning of a national recession. In December 2010, the Illinois legislature proposed new legislation that would provide an exemption for casinos from the act until neighbouring states also implement smoke-free casino policies. Lobbyists and gaming commission representatives argued that Illinois casinos were losing patrons to casinos in neighbouring states that allow smoking. This study examined the influence of the act on casino admissions in Illinois and neighbouring states in light of the economy.
Methods A multilevel model was developed to examine monthly casino admissions from January 2007 to December 2008.
Results There was no difference in changes in admissions across the four states over time after accounting for the economic downturn.
Conclusions The Smoke-Free Illinois Act did not have a detectable effect on Illinois casino admissions.
- Tobacco policy
- secondhand smoke
- casinos
- economics
- environmental tobacco smoke
- public policy
Statistics from Altmetric.com
Background
Exposure to secondhand smoke increases the risk of serious health problems including lung cancer and cardiovascular diseases.1 2 According to the US Surgeon General's 2006 report, ‘establishing smoke-free workplaces is the only effective way to ensure that secondhand smoke exposure does not occur’ and ‘exposures of non-smokers to secondhand smoke cannot be controlled by air cleaning or mechanical air exchange’.1 Casino employees are at high risk for workplace secondhand smoke exposure and related health effects3–5 since many smoke-free laws exempt gambling venues.1 6
Delaware was among the first states in the USA to implement a statewide comprehensive smoke-free act—effective 27 November 2002—that covered casinos and other hospitality venues. Before the policy, respirable particles and carcinogens in Delaware hospitality venues greatly exceeded pollution levels at a busy US interstate highway during rush hour.7 Two months after the law took effect, respirable particles and carcinogens in the casinos had dropped significantly, ranging from 2.3% to 4.6% of the previous amounts. Other studies have also found evidence for the positive impact of smoke-free workplace laws on the health of gaming workers.8
Studies have shown that smoke-free policies have no effect on restaurant, bar9–14 and hotel13 15 revenues; however, little empirical evidence exists on the economic impact of smoke-free laws on casinos. Glantz and Wilson-Loots16 found that local smoke-free ordinances in Massachusetts did not decrease profits from bingo and charitable gaming. Mandel et al17 found no detectable effect of the Delaware smoke-free law on total gaming revenue or the average revenue per machine. The validity of these findings was questioned by Pakko18 19 who re-analysed the data and claimed that the gaming revenues in the three racinos declined significantly. Alamar and Glantz subsequently responded that Pakko's conclusion was the result of manipulating model specification and noted that the casino itself attributed the downturn in business to bad weather.20
In light of health and economic evidence, the question remains as to why many smoke-free policies exempt casinos. The answer may lie in the shared lobby work and pressure exerted by the tobacco and gambling industries who oppose such laws by claiming that smoke-free policies in casinos would have a significant negative impact on the gaming industry.21 This lobbying pressure was demonstrated in Illinois in late 2010, when the House Executive Committee of the Illinois legislature voted 9–1 to exempt casinos from the 2008 Smoke-free Illinois Act. House Bill 1846, Amendment 122 subsequently proposed disallowing smoking in Illinois casinos until neighbouring states enact smoke-free casino policies. In support of this amendment, lobbyists and gaming commission representatives argued that Illinois casinos (especially along borders) were losing patrons to casinos in neighbouring states where smoking is allowed in casinos.23 As an example of the difference in foot traffic between smoking and non-smoking casinos, Illinois lawmakers were taken on a tour of the ageing Casino Queen in economically depressed east St Louis, Illinois and the new Lumière Casino in downtown St Louis, Missouri.23 To determine whether the act influenced foot traffic in Illinois casinos compared to casinos in neighbouring states, this study examines casino admissions in Illinois, Indiana, Iowa and Missouri for one year before and one year after implementation of the act.
Methods
Monthly casino admissions figures (number of admissions) were collected from state gaming commission websites for all non-Tribal casinos across Illinois, Indiana, Iowa and Missouri24–27 one year before and one year after implementation of the act. Neighbouring states of Wisconsin and Kentucky were excluded; Wisconsin only had Tribal casinos and no Kentucky casinos were near the Illinois border. To account for the concurrent recession, two state-level monthly economic indicators were collected from the Federal Reserve of St Louis website: number of single family building permits and state unemployment rate.28 These two indicators are considered among the most influential economic indicators in the USA.29 Building permits are a leading indicator that will begin to fall (or climb) prior to a change in the greater economy; unemployment rate is a lagging indicator that will not begin to drop (or climb) until one or two quarters after an economic shift. Although unemployment lags, it has very high market sensitivity.29 Building permits have only moderate market sensitivity, but the housing market is so closely tied to the economy that experts believe housing is the most reliable indicator of economic activity.29 30 Economic indicators were particularly important for this study because the implementation of the Smoke-free Illinois Act in January 2008 coincided with the beginning of an economic recession in December 2007. Like other recessions in US history, this recession began with trouble in the housing sector, indicating that a housing measure was necessary to accurately capture the recession.31 32
To examine differences in admissions patterns near the Illinois border, casinos within 10 miles of the border were categorised as border casinos. Time was included as a continuous variable representing the month of the study with respect to the implementation of the act. The variable began with month −12 (January 2007) and ended with month 11 (December 2008); January 2008 was coded as month 0, the first month of the act. The act was included as a binary variable with the value of zero for 2007 and the value of one for 2008.
Because Missouri reports admissions differently from Illinois, Indiana and Iowa, admissions z-scores were calculated using the mean and SD of admissions within each state over the entire time of the study and were used as the outcome. Indiana, Illinois and Iowa measured admission by turnstile count; every entry through the turnstile counted as one admission. This method did not track separate admissions for each individual—for example, if one individual entered the casino, exited half an hour later and re-entered, two admissions were counted. For Missouri, admission was measured by a combination of turnstile count and time spent on the casino floor. Before entering a casino floor in Missouri, individuals were required to obtain an identification card that was used to track the amount of time spent on the floor. One admission was counted for every 2 hours, plus additional passes through the turnstile during that time period. For example, if one individual spent 4 hours on the floor and left and re-entered during that time, three admissions were counted. Average monthly admissions for the entire two-year study period by state were: 144 270 (SD=55 699) for Illinois; 117 299 (SD=62 786) for Iowa; 200 218 (SD=89 288) for Indiana; and 366 128 (SD=245 114) for Missouri.
A longitudinal model was built to examine the changes in casino admissions over time across the four states. The model sought to explain admissions based on implementation of the act, time and location (border/non-border), while accounting for unemployment rate and building permits (in 100s). We built the model in steps. First, we sought to determine the extent of auto-correlation in the data given that casinos were measured every month and monthly measures on the same casino are likely to correlate.33 This process entailed comparing a null model that did not account for auto-correlation and a model which included a first order auto-correlation structure for the within-subject error terms. From the model with auto-correlation specified, we determined the magnitude of the correlation (Φ) which ranges from 0 to 1, with one being perfectly correlated within-subject error terms. Following Fox33 we also compared the fit statistics between the two null models to determine which of the two models better fitted the data. We found extensive auto-correlation (Φ=0.63) with the model accounting for auto-correlation (p<0.01) having a better fit.33 In addition, using the selected null model, we examined the amount of variation in admissions accounted for by grouping variable (casino). In the null model allowing for auto-correlation, we found a high amount of variability accounted for by the casino grouping variable (ICC=0.90). We proceeded with a two-level model allowing first order auto-correlation. A post-hoc power analysis indicated that our model had adequate power (1−β=0.95) to detect an effect size of 0.05 or greater given the sample size.
Building on the null model, we developed a baseline model including time and economic variables (model 1). Next we examined whether the act influenced states differently by adding the act and state to the model as main effects (model 2) and then adding all two-way (model 3) and three-way interactions (model 4) between the act, state and time. Finally, we examined interactions between state, the act and location to test whether border casinos in Illinois would experience greater reductions in admissions following the implementation of the act than non-border casinos (model 5). The full model (model 5) tested was:
where the subscript i represents time, j represents casino, u represents unmodelled level-2 (casino-level) error and r represents error at level-1. The equation above (model 5) was simplified for interpretation; state was included as a set of dummy variables. Model fit was assessed using the Aikake and Bayesian information criteria (AIC and BIC). The AIC and BIC are relative measures of lack of fit (smaller is a better fit) and are used to compare nested models.34 R version 2.12-1 was used for analyses.35
Results
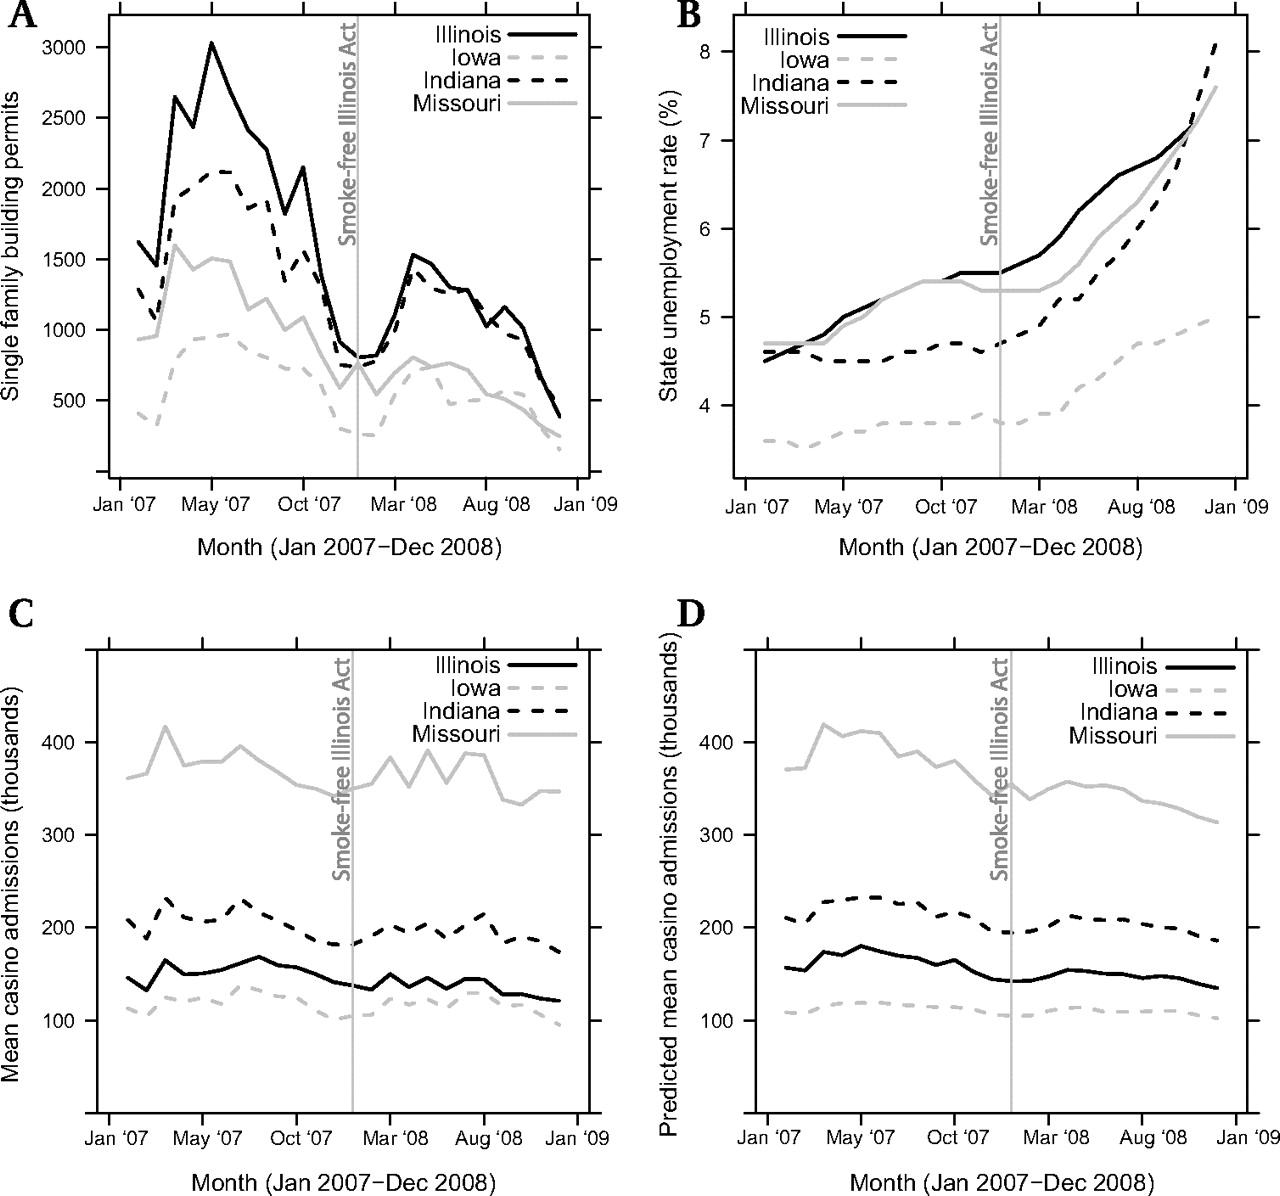
Illinois experienced a steeper recession than neighbouring states, which is demonstrated in figure 1 by the solid black line representing Illinois in panels A and B. Figure 1A shows that Illinois had the greatest decline in single family building permits from January 2007 to December 2008. In addition, figure 1B shows that Illinois also had a steep increase in unemployment over the two-year period. Of the five models tested, model 1 including only time and economic indicators was the best fit; the statistical form of the model and the coefficients are shown below. Building permits was the only significant predictor in this accepted model. Figure 1C and D show observed admissions and predicted admissions based on this accepted model across the four states over the study period. A table showing coefficients for all five models tested is available as an online supplement (table 1).
(A) and (B) show two economic indicators over time across the four states: (A) Single family building permits, and (B) state unemployment rates. (C) and (D) demonstrate (C) the mean observed casino admissions, and (D) the mean predicted casino admissions based on the final model over time across the states. The vertical in the centre of each chart line represents the implementation of the 2008 Smoke-free Illinois Act. All data presented in (A), (B) and (C) are unadjusted (raw data).
Equations A and B gives the accepted model explaining standardised casino admissions across Illinois, Indiana, Iowa and Missouri in 2007 and 2008.
A. The accepted statistical model
B. The accepted model with coefficients
Conclusion
The implementation of the Smoke-free Illinois Act in January 2008 coincided with the beginning of a national economic recession in December 2007. When economic conditions were accounted for, casino admissions in Illinois did not decline significantly relative to neighbouring states, nor did admissions increase in neighbouring states. Reductions reported in revenues in Illinois casinos are therefore not due to patrons leaving Illinois casinos for neighbouring states where they could smoke. This study contributes to the understanding of how comprehensive smoke-free policies influence casino business; additional studies should examine the relation between casino admissions and revenues in light of economic conditions and smoke-free policy.
References
Supplementary materials
Web Only Data
Files in this Data Supplement:
Footnotes
Funding A portion of this study was funded by the Missouri Group Against Smoking Pollution.
Provenance and peer review Not commissioned; externally peer reviewed.