Article Text

Abstract
Objective: Many studies have shown that poor health status and harmful health behaviour occur more frequently in deprived neighbourhoods. Most studies show modest associations between area level socioeconomic factors, the neighbourhood context, and health outcomes. However, estimates for the contextual effects vary. It is unclear if this variation is attributable to differences in methodology. This study examines whether contextual neighbourhood differences in health outcomes really vary between cities or that differences in methodology may account for these differences.
Design: Secondary analysis of data from health interview surveys in seven large Dutch cities in the 1990s comprising 23 269 residents of 484 neighbourhoods, using multilevel logistic models.
Setting: General population aged 16 and over.
Main outcome measures: Self reported health, smoking of cigarettes.
Main results: The socioeconomic context of neighbourhoods is associated with health outcomes in all large Dutch cities. The strength of the association varies between cities, but variation is much smaller in the age group 25–64. Furthermore, neighbourhood differences vary in size between native and other residents. Contextual neighbourhood differences are about two times larger for self reported health than for the smoking of cigarettes, but for native Dutch people they are of similar size.
Conclusions: A comparatively large improvement in health may be gained in deprived neighbourhoods, because of the poorer health status to which the context of these neighbourhoods also contributes. Health promoting interventions should be aimed at the residents and at the context of deprived neighbourhoods, taking differences between ethnic groups and age groups into account.
- health surveys
- neighbourhood
- smoking
- self reported health
Statistics from Altmetric.com
Many studies have shown that poor health and harmful health behaviour occur more frequently in deprived neighbourhoods.1–7 These differences may be caused by factors at different levels. Firstly, they can simply be the result of individual socioeconomic (SE) health differences, as the socioeconomic status (SES) of residents of these neighbourhoods is lower than the average, and lower SES is associated with more unfavourable health and lifestyles in general.8,9 This is also called the compositional effect. Secondly, area level factors, the so called neighbourhood context, may contribute to the unfavourable health position of deprived neighbourhoods (the contextual effect). Examples of such area level factors are an adverse physical environment and poorer community services in deprived neighbourhoods.
In a recent review,1 Picket and Pearl conclude that most available studies show at least some associations between (social-)contextual factors and health outcomes; they are generally of modest size and smaller than the compositional effects. Picket and Pearl only report statistically significant associations, but even then the range of estimates for contextual effects is rather wide. They hypothesise that this wide range may be attributable to heterogeneity of study designs and of analytical methods, or to random variation. However, real differences between cities, regions, and countries may also explain this diversity.10
The aim of this study is to examine the impact of the “city level” on the size of the contextual effects regarding neighbourhood health outcomes. It focuses on neighbourhood level SE differences in health outcomes in big cities in one country, the Netherlands, on the basis of a standardised analysis of previously performed health surveys. Central questions are:
-
does the size of neighbourhood level SE differences in health outcomes vary between cities (after adjustment for differences in age and gender);
-
do these differences persist after adjustment for individual SES—that is, does the size of the contextual effects vary between cities.
METHODS
The study concerned a secondary (multilevel) analysis of data on self reported health and smoking, derived from health surveys that were performed in Dutch big cities in the past decennium, in people aged 16 and over.
Data
Individual data
Individual data came from surveys that were performed in the period 1991–2000 in the larger Dutch cities and met the following criteria:
they contained data on educational level, self reported health and/or smoking, age and gender, and neighbourhood of residence of the respondent;
they covered at least the age range 20–64;
they had a mean of at least 15 respondents per neighbourhood in that age range;
they used the population register of the city concerned as sampling frame (all Dutch residents have to register in the municipality in which they live);
they concerned Dutch cities with at least 100 000 residents (for these cities, the Dutch government has declared a separate policy, which implies that national measures can be taken in response to conditions that are specific for a given city).11
Data from seven cities met these criteria and were made available by the Municipal Health Services concerned. Details of these surveys as well as some characteristics of these cities are presented in table 1. The quality of each survey was assessed by the following criteria (between parentheses the number of points for quality, leading to a quality score):
response (60% and over: 1 point; lower: none);
method of data collection (uniform strategy regarding all respondents: 1 point; otherwise: none);
selectiveness of non-response (shown to be lacking regarding age and gender: 1 point; otherwise: none).
Details of the surveys included in the analysis and characteristics of the cities concerned
After restriction to the relevant age range (16 and over) and to records providing all relevant variables (background characteristics and self reported health and/or smoking), the analysis concerned 23 269 people in 484 neighbourhoods in seven cities.
Health outcomes concerned self reported health and smoking of cigarettes; in the analysis both were dichotomised, and poor health and smoking of cigarettes were predicted in the models. Self reported health concerned three different types of questions. The appendix contains a description of the wording of all questions and the method of dichotomisation. Educational level concerned the highest degree earned, in four levels: primary school, lower secondary school, higher secondary school, post-secondary education.
Area data
Area data concerned the socioeconomic position of the neighbourhood in 1995. Measures were: general practitioner (GP) deprivation score, mean income per earner (further: “mean income”), and proportion of residents aged 16–64 who were dependent on social benefits (further: “social benefits”).
The GP deprivation score was computed as the sum of the standardised scores of each neighbourhood regarding degree of urbanisation, proportion of ethnic minorities, “mean income” and “social benefits”. Regarding the 5% of the population that lives in areas with the highest scores, Dutch GPs receive an additional fee for each patient,13 comparable to the UK Jarman system.14 For this study, I computed a deprivation score per neighbourhood although the original score concerns postcode sectors. The reason for choosing neighbourhoods is that postcode sectors have a logistic origin—that is, adequate post delivery—and were designed at a national level. In contrast, neighbourhoods consist of areas with similar housings, often delineated by natural boundaries. Because of this, they are socio-culturally rather homogenous. In the planning of health and other local services, neighbourhoods are usually the lowest level that is considered; these neighbourhoods are often used as equivalents for local communities. I used a cut off that identifies those 5% of the Dutch population that lives in the most deprived areas according to the GP score. Regarding the analyses on self reported health, 19% of the respondents lived in such areas; regarding the analyses on smoking this concerned 18%. Similar percentages apply to the cities the respondents resided in, which reflects the fact that GP deprived areas are mostly located in the big cities.
The two other neighbourhood measures, “mean income” and “social benefits”, were divided in tertiles in such a way that each category comprised one third of all respondents. All neighbourhood measures were based on data from Statistics Netherlands.15
Analysis
The analyses were performed using multilevel logistic modelling,16,17 because of the hierarchical nature of the data. Characteristics of areas and communities have a potential impact on all residents, whereas an individual characteristic of a resident only affects that individual. This implies that the individual responses may cluster by neighbourhood—that is, their variability attributable to neighbourhood characteristics may be smaller than their variability attributable to individual characteristics. Random variables at both levels were modelled to take this into account.
Firstly, I computed differences in health outcomes for each separate neighbourhood measure regarding all cities combined, after adjustment for age, gender, and their interactions. Secondly, I did the same after additional adjustment for individual educational level. In these models, I also included dummies for each city (using Amsterdam, the biggest city, as reference) to adjust for the methodological differences (as shown in table 1) that would probably affect the overall prevalence of poor self reported health and smoking. To the models regarding self reported health, I added a dummy regarding its operationalisation (SF-3618,19 or other20) because in one survey (from Utrecht), two operationalisations had been used.
Next, I repeated both analyses with the aforementioned models to which the interaction between neighbourhood measures and (dummies for) each city had been added. These analyses yielded odds ratios for less favoured neighbourhoods in a city compared with the most favoured ones in that city, because of the aforementioned inclusion of a dummy for each city. In these models, the statistical significance of differences by neighbourhood SE position between cities was assessed on the basis of the differences in deviances between models with and without the interaction between neighbourhood measure and city.17
All analyses were repeated for three subgroups. The first group concerned surveys with a quality score of 2 or 3, to examine the impact of the quality of the data collection on the results. The second group consisted of respondents aged 25–64, for two reasons. Among the age group 16–24 adjustment for individual SES by means of educational level may be incomplete, as many in this age group are still studying. Among the age group 65 and over, educational level may also have a different meaning because of cohort effects regarding educational attainment.21 Furthermore, some neighbourhood measures, such as unemployment, do not apply to this age group. The third group concerned native Dutch respondents because the various cities strongly differed in the proportion of non-native Dutch people in their population and these people were represented in the surveys in a highly varying degree. Data on country of birth were only available for five cities. Results on this subgroup were therefore compared with those on all respondents from these five cities. As the latter results hardly differed from those that included all seven cities, I do not separately report them. Finally, I examined whether the use of a different cut off point for self rated health in the survey on the Hague (that used marks to rate the own health) would yield different results. This seemed not to be the case, results are therefore not presented.
All analyses were performed with MlwiN,17 using a predictive quasi-likelihood procedure in combination with a first order Taylor expansion series and assuming the random variation at the individual level to be binomially distributed. Random variation was further assessed at the neighbourhood level (because of the inclusion of separate dummies for each city, random effects were not assessed further at that third level).
RESULTS
Self reported health
Respondents from the less favoured neighbourhoods report poor health more often than the other respondents. Adjustment for the educational level of respondents reduces the additional risks (that is, the degree in which the ORs exceed 1) by almost one half (42%–47%) (table 2).
Odds ratios (95% confidence intervals, CI) for poor self reported health after adjustment for city, age, gender, and their interactions, and after additional adjustment for educational level (484 neighbourhoods in seven cities)
In all cities respondents report a poor health more frequently in less favoured neighbourhoods but the size of the neighbourhood differences in health varies between cities. Furthermore, the degree as to which adjustment for educational level reduces differences between more and less favoured neighbourhoods also varies by city and by area measure, from 22% to 72%. Only for Tilburg, the ORs for neighbourhoods with a lower “mean income” become higher after this adjustment. Regarding the measures “mean income” and “social benefits”, neighbourhood differences vary between cities in a rather similar way and both with statistical significance, compare table 2. Results by city for “mean income” are shown in figure 1. After adjustment for educational level neighbourhood level SE differences are smallest in Amsterdam (the biggest city), followed by Tilburg (the smallest city). On the other hand, neighbourhood differences are biggest in Rotterdam regarding the neighbourhood measures that show statistically significant city differences, but the further picture shows a large variety.
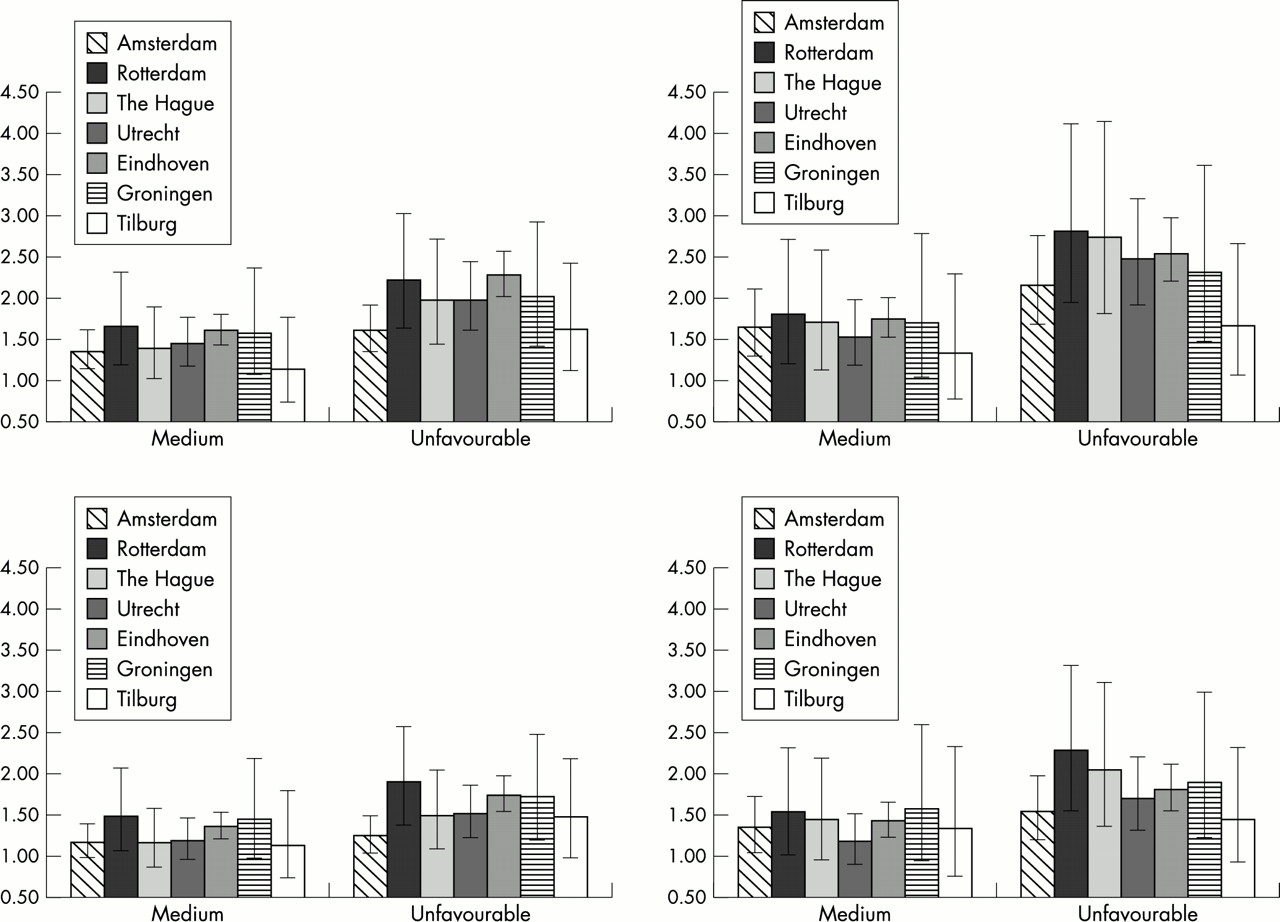
Odds ratios and 95% confidence intervals by city for poor self reported health in neighbourhoods with medium and unfavourable mean income. All respondents aged 16 and over (left) and respondents aged 25–64 (right), both after adjustment for age, gender, and their interactions (upper), and after additional adjustment for educational level (lower).
All analyses were repeated for three subgroups, respondents from surveys with the highest quality scores (2 or 3), respondents aged 25–64 and native Dutch respondents. Results regarding the first subgroup are similar to those on the total group, and are therefore not separately reported. Neighbourhood level SE differences are somewhat larger for respondents aged 25–64, however, whereas adjustment for educational level reduces the excess risks in deprived neighbourhoods to a similar degree as for all respondents (39%–46%). Moreover, for the age group 25–64 the variation by city largely decreases (table 2, final columns, and fig 2). Finally, neighbourhood level SE differences are smaller for native Dutch people than for the total group, but individual educational level explains a similar proportion of the neighbourhood differences (41%–47%; table 3). Variation by city in neighbourhood level SE differences decreases then. Like for all respondents, neighbourhood level SE differences are somewhat larger for native respondents aged 25–64 than for all respondents in that age group, and variation by city is somewhat smaller.
Odds ratios (95% confidence intervals, CI) for poor self reported health after adjustment for city, age, gender, and their interactions, and after additional adjustment for educational level, regarding native Dutch people (370 neighbourhoods in five cities)*

Odds ratios and 95% confidence intervals by city for smoking in neighbourhoods with medium and unfavourable mean income. All respondents aged 16 and over (left) and respondents aged 25–64 (right), both after adjustment for age, gender, and their interactions (upper), and after additional adjustment for educational level (lower).
Smoking of cigarettes
The proportion of cigarette smokers is higher among residents of less favoured neighbourhoods. Neighbourhood level SE differences are smaller, however, than regarding self reported health. Again, individual educational level accounts for almost half (40%–50%) the additional risks for respondents in the less favoured neighbourhoods (table 4).
Odds ratios (95% confidence intervals, CI) for smoking of cigarettes after adjustment for city, age, gender, and their interactions, and after additional adjustment for educational level (447 neighbourhoods in six cities)*
Key points
-
Poor health status and harmful health behaviour occur more frequently in deprived neighbourhoods.
-
The available evidence shows associations of varying strength between the socioeconomic context of neighbourhoods and health outcomes.
-
This secondary analysis shows that these associations are similar across seven cities if analyses are restricted to the age group 25–64.
-
Health promoting interventions should be aimed at the residents and at the context of deprived neighbourhoods.
Assessment by city shows that the proportion of smokers is higher in deprived neighbourhoods in all cities, though again to a varying degree. The degree as to which adjustment for educational level reduces these differences also varies by city and by area measure; especially in Amsterdam, Groningen, and Utrecht some reductions are complete. On average, neighbourhood differences are again comparatively large for Rotterdam, and for Eindhoven. Results by city for “mean income” are shown in fig 2.
Regarding analyses on subgroups, results resemble those on self rated health regarding respondents from surveys with the highest quality scores and respondents aged 25–64. For the first subgroup, results were similar to those on all respondents. For the second subgroup, neighbourhood level SE differences are slightly larger; adjustment for educational level reduces the excess risks in deprived neighbourhoods by 42%–54%, and the variation by city largely decreases (table 4, final columns). In contrast, differences by neighbourhood deprivation are somewhat larger for native Dutch respondents (the third subgroup), whereas the reduction of the neighbourhood differences by adjustment for educational level is smaller (26%–45%; not shown). As a result, neighbourhood level SE differences after adjustment for educational level are almost the same regarding self reported health and the smoking of cigarettes for all native Dutch respondents and for those aged 25–64. In all cases, city differences are much smaller for native respondents of all ages than for all respondents.
DISCUSSION
Neighbourhood level SE differences in health outcomes exist in all large Dutch cities. Differences vary between cities, both after adjustment for differences in age and gender and after additional adjustment for individual educational level. However, this city level variation is much smaller if only the age group 25–64 is taken into account. Contextual neighbourhood differences are about two times larger for self reported health than for smoking of cigarettes. The country of birth of respondents also influences the size of neighbourhood differences in health outcomes. In native Dutch people, neighbourhood differences are smaller for self reported health, but larger for smoking. For the latter outcome, educational level also explains less of the neighbourhood differences. As a result, contextual differences are of almost equal size for poor self reported health and smoking among native Dutch respondents.
Methodology
Methodological factors may have influenced the results of this study in several ways. Firstly, it concerns a secondary analysis of available surveys in which the method and quality of the data collection procedures differed. The results of this study show the importance of differentiating between age groups and between ethnic groups. Other methodological factors, such as the use of different operationalisations of self reported health and selective non-response, may also have led to results that vary by city, even though a restriction of the analyses to the higher quality surveys yielded similar results. The stratified sampling in the Amsterdam survey (table 1) was controlled for by including both stratification variables (boroughs and age groups) in more detailed categories in all models. This stratification is therefore unlikely to have influenced findings, though it gives comparatively much weight to the elderly population in that survey.
Policy implications
-
Health problems in deprived neighbourhoods are so large that specific policies are called for. These policies should first of all aim at improving factors that intermediate the association between deprivation and health status, such as adverse physical and social environments and lifestyles, and a poor delivery of services. Secondly, they should aim at providing additional care to combat the consequences of deprivation. Finally, they should tackle socioeconomic deprivation in itself. For the short-term and middle term, policies aiming at the first two solutions are (comparatively) easiest to implement, though in practice implementation will still be hard.
-
Both local and national governments should be involved in making such policies, as they both have competences regarding relevant policy areas, but implementation should occur locally.
-
The national government should provide financial support for additional care, for instance by general practitioners,13,14 and for other interventions aiming at deprived neighbourhoods, and should facilitate local solutions. In the Netherlands, the government has established a separate urban policy for this purpose.
-
Local government should create specific policies to improve the health status of deprived neighbourhoods, also using them as a setting to contact various deprived groups, and should redistribute financial means to these areas. In the Netherlands, municipal health services can strongly support such policies by providing health promoting and coordinating activities, and acting as health advocates for deprived areas. Similar community based health authorities could play a pivotal part in other countries.
-
Many health problems in deprived neighbourhoods can only be tackled with the additional support of other policy sectors, such as housing, urban development, and employment. Such intersectoral policies should further be developed.37
S A Reijneveld, TNO Prevention and Health, Leiden, Netherlands
F van der Lucht, National Institute of Public Health and Environment, Bilthoven, Netherlands
A second methodological factor that might have influenced my findings concerns the neighbourhood measures used. Regarding neighbourhood data, I used the best databases available for the Netherlands; data are either based on the municipal population registers or on taxation data.13,15 However, regarding GP deprivation, I recomputed the score for neighbourhood instead of postcode sectors. Bias because of this is thus very unlikely as previous analyses have shown results on the size of neighbourhood differences to be very similar for both geographical classifications.2
Thirdly, the method of analysis may have influenced my findings. The statistical significance of differences between cities was measured by a comparison of the deviances of subsequent models. This measure has been shown to be somewhat unreliable in multilevel models. A better alternative is not available,16 but after restriction to the age group 25–64, differences in deviance between models with and without interactions of cities with neighbourhood measures were mostly small and could thus have been affected by such an unreliability. Furthermore, incomplete adjustment for individual SES may have influenced all results on the size of the contextual effects. Previous analyses have shown that remaining neighbourhood differences become smaller if individual SES is adjusted for by the use of several measures instead of only one.10,22,23 This probably applies to this study too, implying an overestimation of the contextual effects. Finally, for each outcome, I computed associations for three independent variables. Some authors would therefore prefer an adjustment for multiple comparisons,24 leading to even lower statistical significance.
Fit with previous studies and explanations
In a review of studies on differences in health outcomes by neighbourhood socioeconomic level, Picket and Pearl concluded that these differences are mostly of a rather modest size, though most studies show at least some statistically significant differences.1 The results of the studies as reviewed by Picket and Pearl varied quite a lot, similar to the variation between cities that I found. Picket and Pearl consider heterogeneity of study designs to be the most probable explanation for this variation. The results of this study show that this is indeed a possible explanation, as variation between cities largely decreases if the analyses are restricted to the age group 25–64. This decrease occurs both without and with adjustment for educational level. It can therefore not be explained by incomplete adjustment for educational level in the lower and higher ages, but indicates that neighbourhood SE position affects people from these age groups differently. For example, students starting out on their own may choose a living address mostly independent of the SE position of a neighbourhood. To a lesser degree, the same holds for ethnic background.
The results of this study further show that contextual factors in deprived neighbourhoods may contribute to the poorer health status in those neighbourhoods. Various area bound factors may explain this contribution, as summarised by Macintyre and coworkers.25 They divided such area bound factors into five groups: physical features, quality of the domestic and working environment, the provision of various services, socio-cultural features, and the reputation of areas.25,27 Factors from each group may contribute to a poorer health in deprived neighbourhoods, such as a higher level of environmental pollution,28 or a poorer provision of health services.13 Available research shows that Dutch cities differ regarding these factors indeed.29 An important result of this study is, however, that the effect of these contextual factors seems to be limited, especially if one examines the same age group in each city. The inclusion of varying age groups may thus explain the somewhat contradictory previous results regarding neighbourhood level SE differences in Dutch big cities, with much larger contextual effects for Rotterdam than for Amsterdam.2,22,23,30 In this analysis contextual effects also remain larger regarding Rotterdam, however, which may indicate real differences between these cities.
In summary, this study shows that residents of deprived (urban) neighbourhoods more often report poor health and to smoke cigarettes. This implies that in such neighbourhoods, a comparatively large gain in health may be obtained. Contextual factors seem to contribute to the unfavourable health situation in these neighbourhoods; the degree as to which varies relatively by city. These contextual effects provide an additional reason to stimulate health promoting interventions in these neighbourhoods. Such interventions may, for example, aim at the reduction of environmental pollution,28 the improvement of the housing,26–28,31 and of the health care in such neighbourhoods,13 or at strengthening the social structure of the communities concerned.32,33 To reach this aim, intersectoral policies are needed.34 Results further show that regarding reported health special attention should be paid to the non-native people in such neighbourhoods.32,35 In the Netherlands, some of these, especially those from Turkey and Morocco, have indeed been shown to have a mostly low educational level and poor health status, but often a comparatively favourable health behaviour.36 Regarding the latter, it might be hypothesised that their uptake of harmful behaviour is still lagging behind, temporarily causing different SE gradients. This has been shown for other population groups as well.37
Additional study is needed to determine whether a similar variation between cities in the size of the contextual neighbourhood differences also exists in other countries and to find routes to tackle the causes. Preferably, such studies should include surveys of high quality and similar methodology—that is, without selective non-response, with similar outcome measures, and conducted in the same period. Notwithstanding, the neighbourhood level SE differences as observed offer a great opportunity to improve the health of urban residents.
APPENDIX WORDING AND DICHOTOMISATION OF ALL QUESTIONS
Self reported health
Self rated health
How is your health in general? Is it: very good; good; fair; sometimes good, sometimes poor; poor.19
Dichotomisation in the analyses was: fair to poor versus (very) good.
General health, SF-36
In general, would you say your health is: excellent; very good; good; fair; poor.17,18
Dichotomisation in the analyses was: fair or poor versus excellent or (very) good.
Health mark
Which mark (from 1, poorest, to 10, best) would you give to your health? . . .
Dichotomisation in the analyses was: 1–6 versus 7–10.
Smoking of cigarettes
Do you smoke cigarettes at least sometimes (self made or from a packet)? yes/no. If yes, how many a day?
Dichotomisation in the analyses was: at least one cigarette/day versus less.
Acknowledgments
Seven Municipal Health Services provided data for this study (GG&GD Amsterdam, GGD Rotterdam, GGD Den Haag, GG&GD Utrecht, GGD Eindhoven, GGD Groningen, GGD Hart voor Brabant).
REFERENCES
Footnotes
-
Conflicts of interest: none.
-
Funding: the Dutch National Institute for Public Health and Environmental Protection financed this study as part of the Dutch Public Health Forecast 2002.