Article Text

Abstract
Objective: To compare tobacco smoke-derived particulate levels in transportation and hospitality venues with and without smoking in 32 countries using a standardised measurement protocol.
Methods: The TSI SidePak AM510 Personal Aerosol Monitor was used to measure the concentration of particulate matter less than 2.5 microns in diameter (PM2.5) in 1822 bars, restaurants, retail outlets, airports and other workplaces in 32 geographically dispersed countries between 2003 and 2007.
Results: Geometric mean PM2.5 levels were highest in Syria (372 μg/m3), Romania (366 μg/m3) and Lebanon (346 μg/m3), while they were lowest in the three countries that have nationwide laws prohibiting smoking in indoor public places (Ireland at 22 μg/m3, Uruguay at 18 μg/m3 and New Zealand at 8 μg/m3). On average, the PM2.5 levels in places where smoking was observed was 8.9 times greater (95 CI 8.0 to 10) than levels in places where smoking was not observed.
Conclusions: Levels of indoor fine particle air pollution in places where smoking is observed are typically greater than levels that the World Health Organization and US Environmental Protection Agency have concluded are harmful to human health.
Statistics from Altmetric.com
Second-hand smoke (SHS) is a complex mixture of the gases and particles from the burning end of a cigarette and exhaled mainstream smoke. Particles emitted from burning cigarettes are in the fine to ultrafine particle size range1 (0.02 μm–2 μm) and have been shown to be inhaled deep into the lungs and to cause an array of adverse health effects that have been detailed in recent reports by the US Surgeon General,2 the International Agency for Research on Cancer3 and the California Environmental Protection Agency.4 In recognition of the health risks posed by second-hand tobacco smoke, the World Health Organization (WHO) has encouraged countries to expand the adoption of smoke-free policies as part of the Framework Convention on Tobacco Control (FCTC).5
Partly driven by the FCTC call for greater second-hand smoke protection policies, several countries have initiatives to implement smoke-free regulations at the national or sub-national level. For example, in 2004, Ireland, Norway and New Zealand became the first countries to enact comprehensive smoke-free indoor air laws. In 2006, Uruguay became the first South American country to implement a 100 smoke-free regulation in workplaces, restaurants and bars. Other countries throughout Europe, Asia, North and South America, Africa and the Pacific have taken action to reduce exposure to second-hand smoke in workplaces and public places.6 While this is encouraging, smoking in indoor public places is still the norm in the vast majority of nations worldwide as they work toward achieving the FCTC standard.
Several studies have demonstrated that smoke-free policies are effective in decreasing SHS exposure and improve health outcomes. Farrelly et al showed a significant decrease in salivary cotinine concentrations and sensory symptoms in hospitality workers after New York State’s smoke-free law prohibited smoking in their worksites.7 Other studies found that respiratory health improved rapidly in samples of bartenders after smoke-free workplace laws were implemented in California8 and Scotland.9 Another study reported a 40 reduction in acute myocardial infarctions in patients admitted to a regional hospital during the 6 months that a local smoke-free ordinance was in effect.10
Some studies have shown that venues that permit smoking in indoor locations have particle levels approximately 10 times greater than in places where smoking is not allowed. In a longitudinal study of 22 hospitality venues in western New York state, Travers et al found a 90 reduction in the levels of particulate matter less than 2.5 microns in diameter (PM2.5) in bars and restaurants, an 84 reduction in large recreational venues such as bingo halls and bowling alleys, and even a 58 reduction in locations where only SHS from an adjacent room was observed at baseline.11 In a recent study in the UK, air quality was found to be poorest in smoky pubs that were located in economically deprived areas.12 A cross-sectional study of 53 hospitality venues in 7 major cities across the USA showed 82 less indoor air pollution in the locations subject to smoke-free air laws, even though compliance with the laws was less than 100.13 Repace et al studied 15 hospitality venues in the state of Delaware and the city of Boston, Massachusetts before and after a state-wide prohibition of smoking in these types of venues and found that about 90 to 95 of the fine particle pollution could be attributed to tobacco smoke.14 15 Others who have examined levels of ambient air nicotine concentrations instead of particle concentrations have obtained similar results.16 While these studies are informative, they are typically small-scale studies performed in small geographic areas, and there is little research in this field in developing countries.
The goal of this study was to provide the latest scientific equipment and methods to practitioners around the world to determine second-hand smoke exposures in a wide range of geographically and economically disparate countries. Hypotheses to be examined included: (1) levels of indoor air pollution will be higher where smoking is observed compared to the facilities where no smoking is observed; (2) levels of smoke pollution will be higher in countries that have weak or non-existent clean indoor air policies compared to places that have comprehensive policies; and (3) levels of smoke pollution will be correlated with smoker density.
METHODS
Overview
Fine particle concentration, an indicator of air quality, was assessed in 1822 venues in 32 countries. Data was collected in most countries from September 2005 to November 2006; however, data collection in Canada took place in 2004, data collection in the USA took place between 2003 to 2006, and data collection in Argentina and Uruguay took place in 2007. The locations tested included restaurants, bars, transportation areas including airports, bus and train stations and train cars, and other types of venue including hotels, shopping malls, offices, casinos and schools. In general, researchers in each country took a convenience sample of venues, although some countries employed a stratified random sampling scheme. Guideline principles for venue selection were to obtain samples from different cities as well as venues of different type and size within each city. Testing was completed in smoking and smoke-free venues on all days of the week and at all times of the day, although generally during busy times for the given establishment. For example, in Germany locations were sampled in 10 different cities from 9 federal states across the country. In each city, visits were made to bars, restaurants, coffee bars, train restaurant cars and discotheques as these were considered the primary public entertainment and transportation venues in Germany. By contrast, in Syria only one city, Aleppo, was sampled but a random sample of the city population of cafés, restaurants and bars was employed. In many countries and cities it was not feasible to identify the entire population of venues to conduct true random sampling.
Selection of countries and coordination of data collection
Countries included in the study were identified first through existing contacts in individual countries with the help of the International Agency for Research on Cancer (IARC). Specific tailored venue sampling frames were developed for each country, taking into account conditions in those countries while striving to maintain comparability across countries. The types of public hospitality venues are not necessarily the same across countries. For example, a bar or pub in the USA, Canada, or Ireland is a readily identifiable establishment whose primary purpose is the sale of alcoholic beverages. The same type of establishment is much less prevalent in Syria or Pakistan, for example, where a sample of cafes serving non-alcoholic beverages was more appropriate. For this cross-country summary, locations sampled were ultimately collapsed into: (1) “bars”, whose primary purpose is the sale of beverages; (2) “restaurants”, whose primary purpose is the sale of food; (3) “transportation” venues, which includes airports, bus and train stations and train cars; and (4) “other” venues, which is a catch-all for those locales not falling into one of the other three categories and includes hotels, shopping malls, offices, casinos, retail outlets and schools.
This report includes data from 1822 air quality assessments conducted in 32 countries that have been divided up for analysis according to WHO world regions:17 the Americas (Argentina, Brazil, Canada, Mexico, USA, Uruguay, Venezuela), Europe (Armenia, Belgium, Faroe Islands, France, Germany, Greece, Ireland, Poland, Portugal, Romania, Spain, UK), Eastern Mediterranean and Africa (Ghana, Lebanon, Pakistan, Syria, Tunisia), and South-East Asia and Western Pacific (China, Laos, Malaysia, New Caledonia, New Zealand, Singapore, Thailand, Vietnam). The data from 25 air quality assessments conducted in Ireland as part of a separate study by an independent group of investigators were included to serve as a reference group to the data in this study.18
Training of data collection staff
Initially, training was performed via face-to-face meetings. One meeting conducted in November 2005 in Paris, France in collaboration with IARC and the French National Cancer Institute involved seven countries (Belgium, France, Germany, Poland, Spain, Cote d’Ivoire (did not ultimately participate in the study) and Egypt), while additional training was conducted in Bangkok, Thailand and Beijing, China in February 2006. Subsequently, we developed a web-based training course (http://www.tobaccofreeair.org). This training module includes step-by-step instructions on the operation of the air monitoring equipment, study protocol and data management. In addition, project staff at Roswell Park Cancer Institute provided telephone and email technical support throughout the project.
Measurement protocol
A standard measurement protocol was used by data collectors across study sites. Establishments were tested for a minimum of 30 min. The number of people inside the venue and the number of burning cigarettes were recorded every 15 min during sampling. Lebanon (n 6), Pakistan (n 1), Syria (n 20) and Tunisia (n 8) had locations with waterpipe smoking in addition to cigarette smoking. A burning waterpipe was counted as the same as a single cigarette in these instances, as a cigarette smoked for a typical duration of about 10 min will emit an amount of particles similar to a waterpipe session lasting 30 min.19 These observations were averaged over the time inside the venue to determine the average number of people on the premises and the average number of burning cigarettes and waterpipes. For most establishments, a sonic measure (Zircon Corporation, Campbell, California, USA) was used to measure room dimensions and hence the volume of each of the venues. When using the sonic measure to calculate room dimensions was not possible, room measurements were made through estimation. Some venues were large and consisted of multiple rooms. If there was a significant physical barrier between different spaces in a venue, such as a normal doorway separating two rooms, the volume and counts were measured only in the room where the aerosol monitor was located.
In each establishment, respirable suspended particles (RSP) were measured using a TSI SidePak AM510 Personal Aerosol Monitor (TSI, St. Paul, Minnesota, USA; fig 1). The SidePak uses a built-in sampling pump to draw air through the device where the particulate matter in the air scatters the light from a laser. The mass concentration of particles is not measured directly, but instead is determined by the amount of light scattering. This portable light-scattering aerosol monitor was fitted with a 2.5 μm impactor in order to measure the concentration of particulate matter with a mass-median aerodynamic diameter less than or equal to 2.5 μm. Tobacco smoke particles are almost exclusively less than 2.5 μm with a mass median diameter of 0.2 μm.1 The SidePak was used with a calibration factor setting of 0.32, suitable for second-hand smoke. This calibration factor was determined in an experiment with the SidePak collocated with another light-scattering instrument that had been previously calibrated against standard pump-and-filter gravimetric methods and used in SHS exposure studies.14 Klepeis et al found a similar SHS calibration factor for the SidePak when compared to a Piezobalance (Kanomax, Andover, New Jersey, USA), which provides direct measurements of RSP mass concentrations.20 This calibration factor has also been confirmed by another researcher who compared SidePak measurements of SHS to gravimetric measurements using a Personal Environmental Monitor (PEM for PM2.5, MSP Corporation, Shoreview, Minnesota, USA) (Kiyoung Lee, University of Kentucky College of Public Health, personal communication, 2006).

The equipment was set to a 1-min log interval, which averages the previous 60 1-s measurements. The SidePak was zero-calibrated prior to each use by attaching a high efficiency particulate air (HEPA) filter according to the manufacturer’s specifications. Sampling was discreet in order not to disturb the occupants’ normal behaviour. The monitor was generally located in a central location on a table or bar and not on the floor, so the air being sampled was within the occupants’ normal breathing zone. For each venue, the first and last minute of logged data were removed because they are averaged with outdoors and entryway air. The remaining data points were averaged to provide an average PM2.5 concentration within the venue. Associates in each country undertook the air sampling, and Roswell Park Cancer Institute staff analysed the data.
Statistical analyses
The primary goal was to assess the difference in the average levels of PM2.5 in venues that were smoke free (no smoking observed during sampling) and venues that were not (smoking was observed during sampling). All statistical analyses were performed using the log-transformed PM2.5 concentrations because these data are log-normally distributed, hence geometric means are compared. The comparison between smoking and smoke-free venues was performed within each country and pooled across all countries. A comparison was also made between the overall geometric mean concentration in the three smoke-free countries with comprehensive non-smoking policies (Ireland, New Zealand and Uruguay) and the other 29 countries. In addition, the comparison between smoking and smoke-free locations was also stratified by type of venue and world region. The four types of venues considered in this study were as outlined above. The generalised linear model (GLM in SPSS V.14.0; SPSS, Chicago, Illinois, USA) was used to test for differences in PM2.5 levels and construct 95 CIs. Multiple post-hoc pairwise comparisons were adjusted using the Bonferroni method, although the choice of adjustment method had no effect on the significance of any results. An alpha of 0.05 was used for all significance testing.
The active smoker density (ASD) was also calculated for each location sampled. This is defined as the average number of burning cigarettes and waterpipes per 100 m3. Spearman rho was used to determine the correlation between the ASD and average PM2.5 levels.
RESULTS
Table 1 provides a summary of the data collected from 1822 places in 32 countries and shows the geometric mean PM2.5 concentrations. The three countries with the highest geometric mean (GM) PM2.5 levels were Syria (372 μg/m3), Romania (366 μg/m3) and Lebanon (346 μg/m3). The geometric mean PM2.5 levels in Ireland (22 μg/m3), Uruguay (18 μg/m3) and New Zealand (8 μg/m3), where there are comprehensive clean indoor air policies at the national level, were lowest. The compliance rate with the smoke-free air laws in Ireland and New Zealand was 100 in the places visited, meaning there was no observed smoking, while the compliance rate was 95 in Uruguay. Across all countries, the PM2.5 levels in places where smoking was observed was 8.9 times greater (95 CI 8.0 to 10.0) than the levels in places where smoking was not observed. The overall PM2.5 levels, including smoking and smoke-free venues, were 7.5 times higher (95 CI 5.9 to 9.7) in the 29 countries without comprehensive clean indoor air policies compared to Ireland, New Zealand and Uruguay.
Table 1 also compares smoking and smoke-free places within each country. While a randomised, population-based sample was not used, the number of places with and without smoking in each country generally reflects the availability of smoking or non-smoking venues within each country. For example, in the USA, where there are many smoke-free air laws in effect, 28 of venues sampled were smoke free, compared to 2 smoke free in Romania where there are minimal smoking restrictions. For the 23 countries where smoking-observed and smoke-free locations were both sampled, table 1 shows the ratio of PM2.5 level in smoking-observed versus smoke-free places. This ratio was significantly greater than 1 in all of these 23 countries except for Uruguay and Vietnam, where there were only three smoking-observed and four smoke-free places respectively for comparison.
Overall, there were 584 venues where no smoking was observed, and the geometric mean PM2.5 level in these places was 21 micrograms per cubic meter (μg/m3), ranging from 0 to 573 μg/m3. The geometric mean PM2.5 level in the 1238 venues where smoking was observed was 188 μg/m3, ranging from 1 to 3764 μg/m3. The PM2.5 concentration was 89 lower in the venues with no observed smoking compared to those where smoking was observed (95 CI 88 to 90). This difference was slightly lower after adding country and type of venue to the model at 85.4 (95 CI 83 to 88).
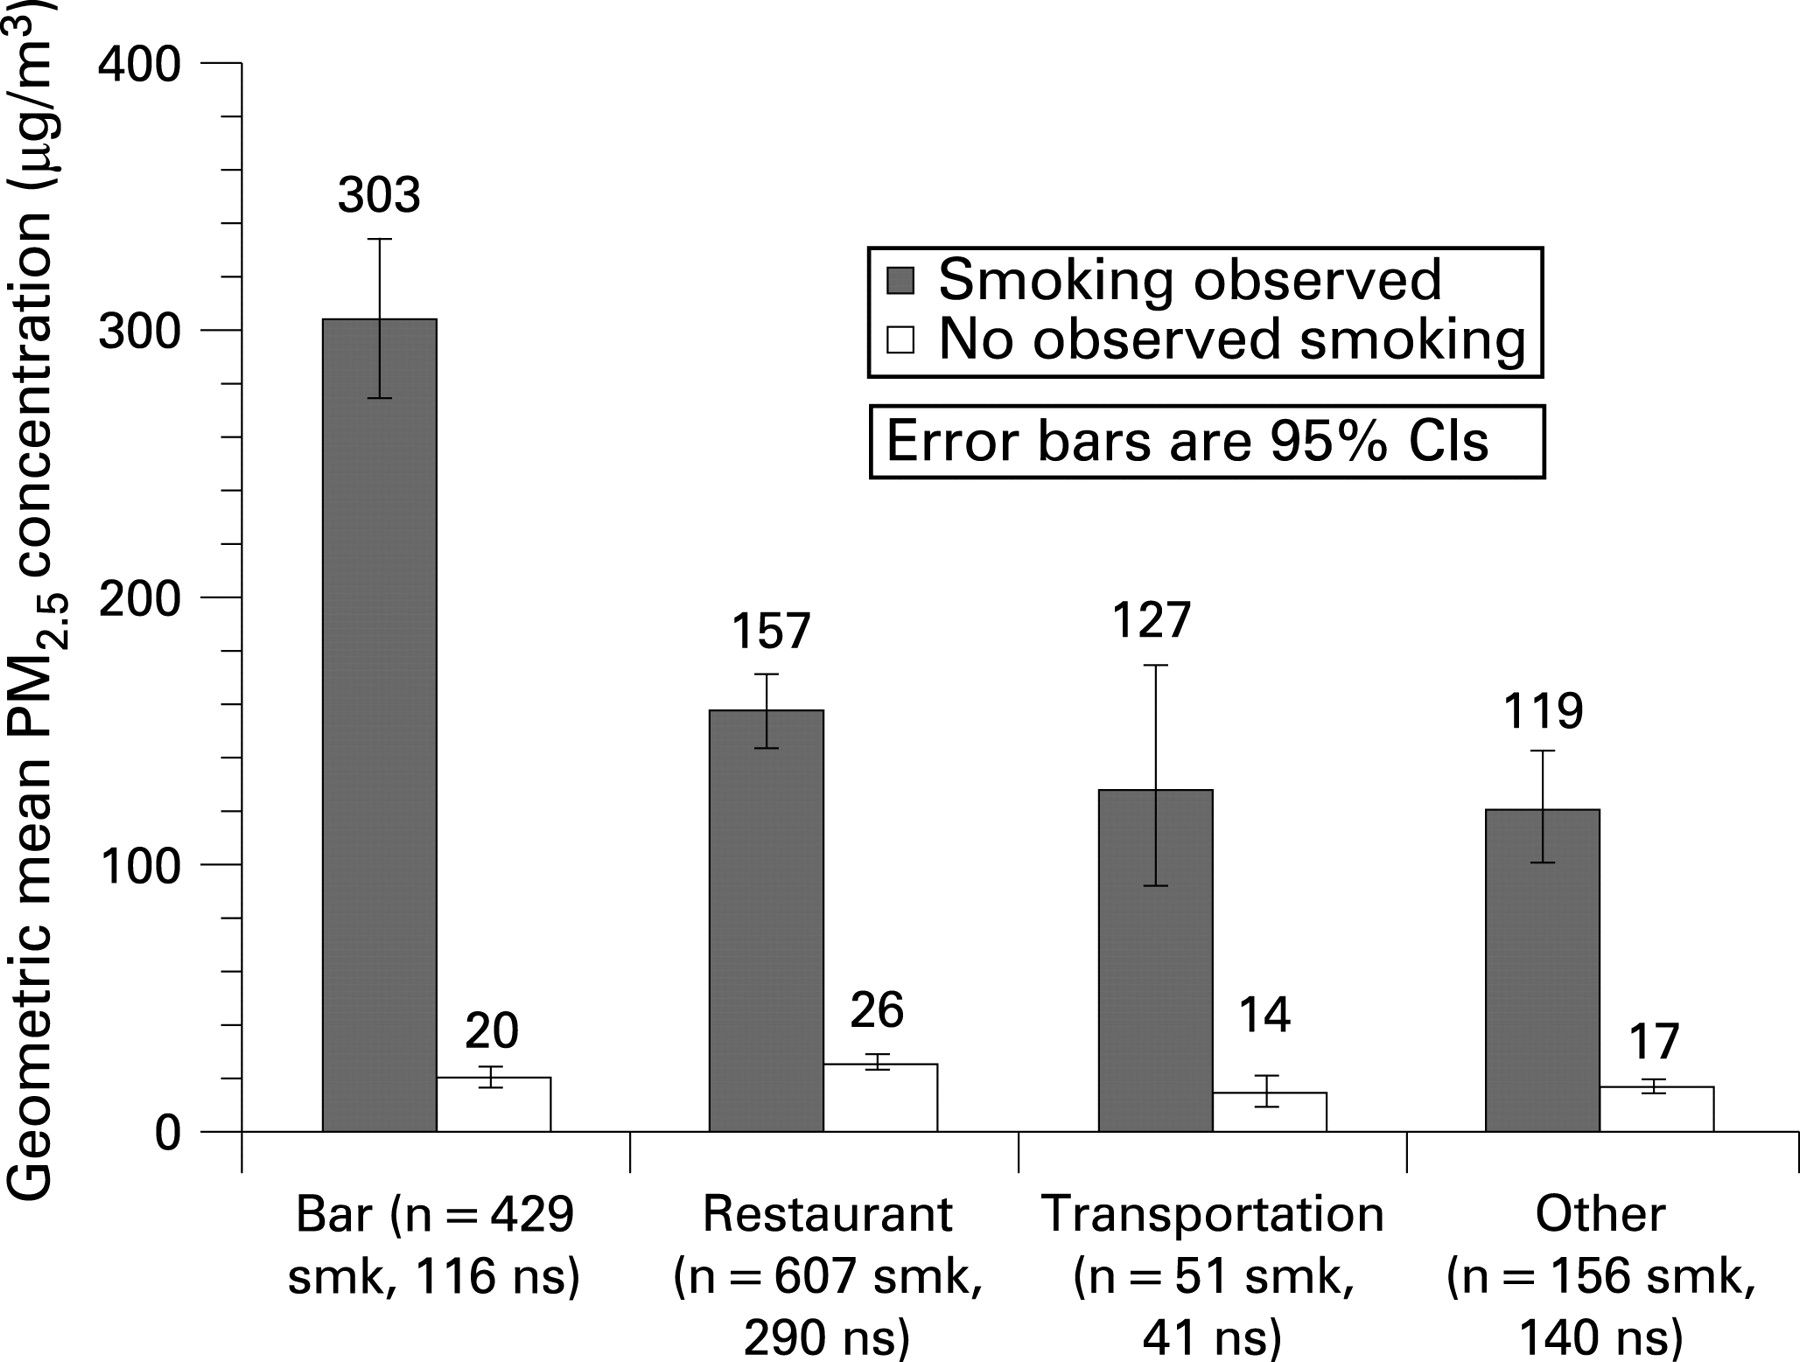
Figure 2 compares the average air pollution levels in places with and without smoking stratified by four types of location; (1) bars, (2) restaurants, (3) transportation venues and (4) other types of venue. Venues with smoking had significantly higher levels of PM2.5 compared with smoke-free places in all four types of location. Bars with smoking had the highest average levels (303 μg/m3) and were 15.4 times higher (95 CI 12.5 to 34.5) than smoke-free bars. The difference between smoking and smoke-free places was 6.2 times for restaurants (95 CI 5.3 to 7.2), 8.8 times for transportation venues (95 CI 5.4 to 14.2), and 7.0 times for other places (95 CI 5.4 to 9.0). The high PM2.5 level in bars is consistent with the high geometric mean active smoker density in these venues of 1.59, compared to 0.81 in restaurants, 0.74 in transportation venues, and 0.71 in other types of venues.

Figure 3 shows the average air pollution levels found across world regions by observed smoking: the Americas, Europe, Eastern Mediterranean and Africa and South-East Asia/Pacific. The average PM2.5 levels in the venues where smoking was observed was fairly consistent across all regions considered and was approximately 10-times greater than the levels observed in the smoke-free venues, although there were some statistical differences noted. PM2.5 levels in smoking observed venues were highest in the Eastern Mediterranean and Africa, followed by Europe, South-East Asia and the Americas respectively. The difference between PM2.5 levels in smoking locations in Americas and South-East Asia was not significant, whereas all other pairwise comparisons were statistically significant. There was no statistically significant difference in PM2.5 levels in venues without observed smoking across regions. The PM2.5 levels in smoking places by region correlates with the active smoker densities, with the highest geometric mean ASD in the Eastern Mediterranean and Africa (4.12), followed by 1.04 in Europe, 0.58 in the Americas and 0.57 in South-East Asia and the Pacific.

The overall smoker density was much greater in the venues where smoking was observed (mean 2.48, GM 1.01 burning cigarettes or waterpipes per 100 m3) compared to the smoke-free locations (0.00 burning cigarettes per 100 m3). Average PM2.5 levels were significantly positively correlated (Spearman rho 0.74, p<0.001) with smoker density. The relation between active smoker density and PM2.5 concentrations is modified by differences in ventilation and differences in emission rates per cigarette. Other sources of PM2.5 and measurement error for venue volumes and active smoker counts will also affect this correlation.
What this paper adds
The Framework Convention on Tobacco Control (FCTC) calls for all ratifying nations to implement stronger second-hand smoke protection policies (among many other provisions). Studies that use quantitative means for assessing levels of second-hand smoke exposure have generally been conducted in selected cities, primarily in wealthier Western nations. Little data exists in non-Western nations to document levels of exposure. Such localised information can be salient to policymakers.
The results from this 32-country indoor air quality comparative study show that fine particle concentrations in bars, restaurants and other locations that allow smoking are typically far greater than levels that the World Health Organization and the US Environmental Protection Agency have concluded are harmful to human health, regardless of geographic location. By contrast, indoor particle concentrations in countries that have implemented comprehensive smoke-free regulations are on average 87 lower than in countries without such comprehensive regulations. These results underscore the importance of comprehensive smoke-free policy adoption in accordance with the FCTC.
DISCUSSION
The results from this study show that levels of PM2.5 in bars, restaurants, transportation venues and other outlets are at higher levels in countries where smoking is permitted in these venues without restriction. By contrast, countries with comprehensive smoke-free regulations, such as those in Ireland, New Zealand and Uruguay, have PM2.5 levels that are about 89 lower than those in countries where smoking is permitted without restriction.
These results are consistent with previous studies examining this topic, although this is one of the only studies to provide international comparisons and, for some countries, provides the first data on the level of indoor air pollution inside venues where smoking is permitted. The general comparability of conclusions across different types of venues and in different countries adds to the generalisability of the finding that fine particle air pollution levels are higher in venues where smoking occurs. Statistically higher particle concentrations were observed in bars and in some regions of the world; however, the main finding is that regardless of the type of venue assessed or its geographic location, the amount of smoking was a major force driving PM2.5 levels. In addition, these findings looking at differences in air quality measurements between countries where smoking is and is not permitted in indoor public venues closely mirror the changes in cotinine levels of New Zealand bar patrons, where a 90 reduction was observed.21
The results of this study stress the importance of governments prohibiting smoking in indoor public places in order to comply with Article 8 of the FCTC. In light of recent evidence indicating that SHS cannot be controlled through improved ventilation or filtration,22 23 and with no evidence that these measures can eliminate the health risk of SHS exposure, only the creation of 100 smoke-free environments is known to effectively achieve the goal of Article 8.
The data from Greece also provides compelling evidence that providing separate sections for smokers and non-smokers does not protect individuals from SHS exposure. Only non-smoking sections of venues that allowed smoking were tested in Greece, and the average PM2.5 level with observed smoking (GM 223 μg/m3) was similar to other countries. The current Greek law calls for 50 of the area of hospitality establishments to be non-smoking, but these data show that it is ineffective in markedly reducing SHS exposure.
To protect public health, the WHO has established air quality standards and an air quality guideline (AQG). The AQG is a measure for reducing the health impacts of air pollution. According to this guideline, an annual mean PM2.5 concentration of 35 μg/m3 or higher is associated with 15 higher long-term mortality risk.24 Many of the venues where data was collected for this study (764 out of 1822 venues, or 42) had average PM2.5 levels that would result in an average annual exposure of over 35 μg/m3 solely from occupational exposure alone for a full-time employee. In all, 60 of venues with observed smoking exceeded this limit compared to only 4.5 of venues with no observed smoking. The WHO’s target air quality guidelines for PM2.5 are much lower: 10 μg/m3 annual mean and 25 μg/m3 24-h mean.
A limitation to be considered when interpreting these data is that second-hand smoke is not the only source of indoor particulate matter. Ambient particle concentrations and cooking are additional sources of indoor particle levels, although smoking is generally the largest contributor to indoor air pollution.13 The level of outdoor particles in a given country and the frequency with which venues were open to outside air impacts the magnitude of the difference in particle levels in venues with and without smoking. In the USA and Canada for example, venues were primarily closed and the only common source of particles was cigarette smoke, therefore there was a large (12- to 15-fold) difference between particle concentrations in venues with smoking compared to those without smoking. In China, however, ambient particle concentrations were much higher, partially explaining the smaller difference in particle levels (twofold) between venues with and without observed smoking. Malaysia and Singapore are close geographically but particle levels in venues with smoking in Singapore are higher than in Malaysia. This can be partially explained by the higher active smoker density in Singapore, but is also likely related to the greater ventilation and dilution of tobacco smoke in Malaysia due to the larger number of venues that were partially open to the outside. In some countries, the level of pollution in smoke-free venues was higher than in other countries. There are a few possible explanations for this discrepancy. The higher levels of indoor air pollution seen in some venues with no observed smoking could be due to other factors, such as cooking, open fireplaces and higher levels of ambient air pollution. Restaurants in Brazil frequently had open fires for cooking, contributing to higher particle levels in restaurants with no smoking compared to countries such as the USA and Canada. In some cases there may also have been residual tobacco smoke particles in the air of these locations from smoking that occurred before the data collection, or tobacco smoke particles that drifted in from adjacent outdoor areas or indoor areas that were not observed.
Restaurants, bars, transportation outlets and other types of venue that are “smoke free” are significantly less polluted than venues where smoking occurs, and this is true around the globe. Comprehensive smoke-free regulations are the most effective strategy to reduce second-hand smoke exposure. These findings underscore the importance of compliance with the FCTC Guiding Principle 4.2 to “take measures to protect all persons from exposure to tobacco smoke”.
Acknowledgments
Special thanks are extended to James Repace, Wayne Ott, Neil Klepeis and Kiyoung Lee for their technical assistance related to the measurement of SHS. The authors also wish to acknowledge the following individuals with appreciation for their contribution to the project. Argentina: Veronica Schoj, Marita Pizarro, Ernesto Sebrié. Armenia: Varduhi Petrosyan, Narine Movsisyan, Marietta Khurshudyan, Arayik Sargsyan. Belgium: Isabelle Convié. Brazil: Paula Johns, Vera Colombo, Marina Selig, Paulo Correa. Canada: Geoffrey T Fong, David Hammond, Taryn Sendzik, Matthew Sendzik, Lindsay Bridgman, Bryanne Gilkinson, Allison Saunders, Tara Elton-Marshall, Zachary Marshall. China: Yuan Jiang, Yan Yang, Qiang Li, Jiming Kang, Zhu Li, Guoze Feng. Faroe Islands: Lynn Reveal, Brynhild Danielseen. France: Sylviane Ratte, Christelle Nieraad, Nicolas Villain. Germany: Martina Pötschke-Langer, Bjorn Seibold, Elmar Jentzsch, Susanne Schunk, Alexander Schulze. Ghana: Wilfred Agbenyikey, John Gyapong, Edith Wellington. Greece: Barbara Kondilis, Constantine I Vardavas, Yiannis Tountas, Elisabeth Petsetaki, Anthony Kafatos, Christine Dimitrakaki, Eleni Moreti. Laos: Onechanh Keosavanh, Keooudom Namsena. Lebanon: Natalia Linos. Malaysia: Foong Kin, Razak Lajis, Rahmat Awang, Maizurah Omar. Mexico: Rafael Anaya Ocampo, James R Thrasher. New Caledonia: Séverine Page. New Zealand: Nick Wilson, Anthony Maher, Jenny Näthe, Rafed Jalali. Pakistan: Kaneez Zehra, Arshad Ali Syed, Shaheryar Khan. Poland: Witold Zotonski, Krzysztof Przewozniak, Jakub Gumkowski, Marta Przewozniak, Barbara Wieteska, Sylwia Kołakowska, Daniel Pokrywczynski, Janina Fetlinska, Małgorzata Zagroba, Pawl Polak. Portugal: Sílvia Menezes. Romania: Florin Dumitru Mihaltan, Ioana Munteanu. Singapore: Heng-Nung Koong. Spain: Maria J Lopez, Manel Nebot, Irene Gonzalez, Isabel Marta. Syria: Wasim Maziak, Fouad M Fouad. Thailand: Stephen Hamann, Naowarut Charoenca, Nipapun Kungskulniti, Sorakom Santhana, Chairat Neramit. Tunisia: Radhouane Fakhfakh, Karim Kammoun, Youssef Slama, Nourredine Achour. UK: Richard Edwards, Christian P Hasselholdt, Kim Hargreaves, Claire Probert, Richard Holford, Judy Hart, Martie Van Tongeren, Adrian F R Watson. USA: Gregory Connolly, Carrie Carpenter. Uruguay: Laura Roballo, Cecilia Caviglia, Gerardo Tucuna, Eduardo Bianco. Venezuela: Natasha Herrera, J Dennis Rada, Ana María Dmytrejchuk, José Felix Ruiz. Vietnam: Nguyen Thi Hoai An, Tran Thi Kieu Thanh Ha, Le Thi Chi Phuong.
REFERENCES
Footnotes
-
Funding: The present work was funded by grants from the Flight Attendant Medical Research Institute (FAMRI) and from the US National Cancer Institute/National Institutes of Health (from the Roswell Park Transdisciplinary Tobacco Use Research Center (TTURC), P50 CA111236).
-
Competing interests: None.