Article Text

Abstract
Context Exposure to secondhand smoke (SHS) has been reduced in the USA by banning smoking in public places. These restrictions have not had the same effect on children's exposure to SHS as adults suggesting that children are exposed to SHS in locations not covered by bans, such as private homes and cars.
Objectives Assess exposure to SHS in the backseat of a stationary vehicle where a child would sit, quantify exposures to fine particulates (PM2.5), polycyclic aromatic hydrocarbons (PAH), carbon monoxide (CO) and nicotine. Estimate the impact on a child's mean daily exposure to PM2.5.
Methods SHS exposures in stationary vehicles with two different window configurations were monitored. A volunteer smoked three cigarettes in a one-hour period for twenty-two experiments. PM2.5, CO, nicotine and PAH where measured in the backseat of the vehicle. 16 PAH compounds were measured for in gas and particle phases as well as real-time particle phase concentrations.
Results The mean PAH concentration, 1325.1 ng/m3, was larger than concentrations measured in bars and restaurants were smoking is banned in many countries. We estimate that a child spending only ten minutes in the car with a smoker at the mean PM2.5 concentration measured in the first window configuration −1697 mg/m3 – will cause a 30% increase to the daily mean PM2.5 personal average of a child.
Conclusions Estimates made using the measured data and previously reported PM2.5 daily mean concentrations for children in California showing that even short exposure periods are capable of creating large exposure to smoke.
Statistics from Altmetric.com
Introduction
Health effects associated with exposure to secondhand smoke (SHS) from cigarettes include increased sensitisation to allergens,1 exacerbation of asthmatic symptoms,2 increased risk for lung cancer, increased risk for coronary heart disease3 and increased risk for respiratory infections.4 The burden of ill health from exposure to SHS placed on involuntary passive smokers, especially children, is unfair and avoidable. Public policy measures have been taken to reduce SHS exposures, such as banning cigarette smoking in restaurants, bars, airplanes and other public places. These bans have been successful in reducing personal exposures of non-smoking adults.5 Serum concentrations of cotinine, a tobacco smoke biomarker, have been monitored in the USA as a part of the National Health and Nutrition Examination Survey (NHANES). Cotinine levels of non-smoking adults have decreased over the last 13 years; levels for the children of smokers have remained relatively constant over the same period of time.6 The differences in the reductions in fine particulate matter (PM2.5) of cotinine levels between adults and children may be explained by the fact that most SHS exposures to children occur domestically in places such as their homes or family vehicles, not in locations where the majority of cigarette bans are targeted. Exposures of children to SHS in vehicles in particular may account for a large fraction of SHS exposures. Currently in the USA and its territories only Arkansas, Louisiana, California, Maine and Puerto Rico ban smoking in vehicles with minors, the earliest of these going into effect in 2006. Internationally only a few countries or subnational jurisdictions have laws that ban smoking in vehicles for children—Australia, Bahrain, South Africa, Canada, Cyprus, United Arab Emirates, and Mauritius.
The 2006 US Surgeon General's Report summarised nicotine concentrations in air for a number of locations. Nicotine concentrations ranged from 1 to 3 µg/m3 in homes, non-detectable to 48.4 µg/m3 in offices and non-detectable to 13.8 µg/m3 in restaurants. A survey of casinos found nicotine concentrations to be among the highest for reported workplace nicotine concentrations, ranging from 6 µg/m3 for personal measurements to indoor concentrations of 65.5 µg/m3. Children are not allowed in casinos or bars, and typically are not present in workplaces, but a child of a cigarette smoker may be exposed to extremely high concentrations of nicotine in SHS when sitting in a car while others are smoking. Previous studies on SHS exposures in vehicles, focused on measuring particle mass (PM)2.5, carbon monoxide (CO), and nicotine, are summarised in table 1.
Comparison of SHS PM2.5 in vehicles in previous studies
These studies present a range of exposures to SHS in a vehicle with an active smoker for differing configurations of windows, vehicle speed and ventilation system usage including stationary vehicles. Exposures to SHS in a stationary vehicle are likely to occur during periods of waiting. As shown in table 1 exposure can be quite significant. For example, a smoking parent with the child in the vehicle may be waiting for a spouse and smoking a cigarette while waiting.
Previous research on tobacco smoke in vehicles has quantified concentrations of PM2.5, CO and nicotine in air.9 ,12 These compounds are among the simplest to measure and comprise a significant fraction of the emitted compounds. PM2.5 has known adverse health effects and nicotine is a good tracer for SHS. However tobacco smoke is comprised of thousands of constituents including polycyclic aromatic hydrocarbons (PAH). PAH exposures have been shown to cause immunological changes,13 and have been associated with wheeze and changes in IQ14 as well as allergic sensitisation.15 The PAH concentrations measured in our study are to our knowledge the first to be reported inside a vehicle with an active cigarette smoker. We quantified concentrations of 16 PAH and four additional constituents (CO, PM2.5, PM size distribution and nicotine) in SHS in the back seat of a vehicle (where a child would sit) with an active smoker in the driver's seat over 1 h. PAHs, as well as PM2.5 and CO are also emitted from other combustion sources including traffic. To quantify the effect of tobacco smoking on invehicle concentrations separately from traffic-related sources we also measured ambient concentrations concurrently and conducted background corrections. The windows were set in two different positions, to investigate the effect of reducing vehicle concentrations by ventilation. The stationary setting also allowed for the quantification of the variability of air exchange rates at different locations inside the vehicle. The measured PM2.5 concentrations in this study are used to estimate the increase in the PM2.5 measured mean daily exposure for a child from spending time in a vehicle with an active smoker.
Experimental methods
Two sets of exposures were conducted; both included a human subject and a volunteer cigarette smoker in the vehicle. Data on human exposure biomarkers will be published elsewhere.16 The first set of experiments used rental vehicles, all of which were four door sedans. The second set used a 1992 Jeep Cherokee Laredo, owned by an active smoker. The rental use rules had changed between the two sets of experiments; at the time of the second study, rental companies in the state of California no longer allowed smoking in rental vehicles. All exposures were conducted in parking in one of the two parking lots associated with the University of California San Francisco.
The engine of the vehicle was off for the duration of the exposure and the vehicle remained stationary. A volunteer smoker sat in the driver's seat for each set of exposures while a volunteer non-smoking subject sat on the right side of the back seat. Two active smokers were used, one for each set of experiments. The cigarettes were smoked over 1 h in each experiment starting at 0, 20 and 40 min. In study 1, the front windows of the rental vehicles were completely open and the rear windows were closed; in study 2 the four windows of the Jeep were open 10 cm. An equipment rack was placed in the middle of the back seat to hold instruments and sampling devices measuring at the breathing height of a child sitting in the back seat. A diagram of the equipment set-up can be found in the supplementary information; the monitors used are listed in table 2.
Listing of all the monitoring equipment used in the study
Pollutant monitoring
Continuous monitoring
Measurements of PM, particle phase PAH and CO concentrations were made on a 1-min basis using the continuous instruments listed in table 2. PM2.5 mass concentrations were measured using a MIE PdR, GRIMM and TSI AM510. The PdR and AM510 are light scattering particulate monitors that use a size selective device to achieve the particle size cut point (impactor for AM510 and cyclone for PdR). The PdR was equipped with a Pall 2.0 µm pore Teflon filter with a ring to collect the measured particles for gravimetric mass calibration. A TSI Sidepak pump was connected to the PdR and operated at 5 Lpm. The filter was presampling and postsampling weighed using Cahn 29 microbalance. Particle phase PAH concentrations were measured using a Personal Air Sampler (PAS) 2000 EcoChem by ultraviolet photo ionisation. Past experience has shown this instrument to have a strong linear relationship with the 4,5,6 ring PAH.17 ,18 CO was measured using a HOBO electrochemical passive diffusion monitor.
For the first set of exposures the GRIMM was located inside the vehicle and the PdR was outside the car with a cyclone and filter. In set 2, the AM510 was located inside and outside the vehicle. The PdR and the GRIMM were also inside the vehicle. The PdR filter was used to correct the AM510, GRIMM and the PdR.
Integrated monitoring
1 h integrated samples were taken during each exposure to measure nicotine concentrations and the concentrations of 16 PAHs (Supplement). Nicotine was sampled on 37 mm PALL EMFAB filters impregnated with sodium bisulphate19 using TSI Sidepak pumps with the flow rate set at 2 Lpm. A ChemComb filter-denuder set attached to a SKC Leland Legacy pump set at 10 Lpm collected integrated gas and particle phase PAH. Due to the high concentration and high volatility of naphthalene (NAP) 200/400 mg XAD-2 sorbent tubes connected to a PAS-500 Personal Air Sampler with flow rate set at 0.2 Lpm were used to sample NAP. All pumps used were calibrated immediately before and after each sampling period.
Background sampling
Background concentrations of CO and PM measured continually and integrated samples of PAH, nicotine and NAP were measured 6.1 m from the vehicle. In addition blank samples were taken for NAP sorbent tubes, ChemCombs, PdR gravimetric filters and ETS filters.
Chemical analysis
PAH standards of 16 priority PAH for gas chromatography mass spectrometry (GC/MS) analysis were freshly prepared for each set of samples analysed of nominal concentrations (ppb): 250, 50, 25, 10, 5, 2. All PAH GC/MS chromatograms and mass spectra were obtained with Hewlett-Packard (HP) 6890 Series GC System; Agilent Technologies Inc. ED-17MS GC column; and HP 5972 Series Mass Selective Detector. The nicotine filters were analysed with an Agilent 7890 Series GC System using a HP5 GC column and a nitrogen phosphorous detector. The quantified limit of detection was 0.04 µg/m3.
Air exchange rates
Air exchange rates (ACH) were calculated using equation 1, modified version of the model presented in Park et al.20 Cmax is the maximal concentration of the CO; Cmin the concentration at the end of time=t. The ACH rate was determined using the third cigarette smoked in each exposure
 1
1
Statistics
To test the differences between measured concentrations within the same set of data and between the data sets, paired t-test with p=0.05 of the ACH were conducted using SAS statistical software (Cary, North Carolina, USA) version 9.3.
Results
Particulate matter
Tables 3 and 4 present the data from each exposure. The concentration inside the vehicle is two orders of magnitude higher than the outdoor concentrations for both window settings. The configuration of the instrumentation was different for each set of exposures, however all PM2.5 measurements were corrected using gravimetric samples making them comparable across sets. Figure 1 shows a minute-by-minute mean concentration of PM2.5 as measured by the AM510 in the back seat of the car with windows at position 2. The mass concentration peaks three times corresponding to each of the cigarettes being lit. It took the smoker approximately 8 minutes to smoke each cigarette, thus the PM concentration peaked as the smoker was finishing a cigarette. Concentrations return to baseline concentrations within 12 minutes of the smoker finishing the cigarette. The mean PM2.5 concentrations inside the car were 746.1 µg/m3 for window position 1 and 1172.1 µg/m3 for position 2.
Exposure data from set 1 with front window of vehicles open and the back closed.
Exposure data from set 2 with all window of vehicles open 15 cm

Mean CO and PM2.5 concentrations for all windows open 10 cm (position 2) experiments over the course of the exposure period. 95% CI are given by the dashed lines.CO, carbon monoxide.
Unlike the PdR and the AM510, the GRIMM size particles used an algorithm based on the light scattering properties of the monitored particles instead of using a physical cut point. Figure 2 shows the per cent of the total PM in each size bin measured over the 1-h exposures with the window in position 2. The majority of the PM was concentrated in particles less than 0.7µm. The mass mean diameter measured for each experiment is listed in table 4. The average mass mean diameter reported is 0.3 µm, however the true value is most likely much smaller. The mean particle diameter of combustion particles has been shown to be less than 0.1 µm. 0.3 µm is reported here due to the minimum measureable particle diameter of the GRIMM, which is 0.3 µm. PM2.5 concentrations between the two window positions were statically different with a p value of 0.05.

Percentage of particle mass in each size bin measured by the GRIMM particle counter for exposures with all windows open 10 cm (position 2).
CO concentrations and air exchange rates
The maximum of the mean CO concentrations measured was 6.0 ppm. 1 min average CO concentrations ranged from 1.5 ppm at the start and between cigarettes to 2.8 ppm when cigarettes were extinguished (figure 1). Although there was variability among experiments, the mean CO was generally greater in the front of the car and greater with the window open 10 cm, than the front window open and back closed (tables 3 and 4). The air exchange rates with the front windows open and back closed were higher than the other configuration (set 2) at the dashboard, however set 2 had higher air exchange rates in the middle and back seat of the vehicle (tables 3 and 4).
Between sets the dashboard monitors reported no statistical difference of ACH rates (p=0.05), but the middle and back seat ACH rates between the sets were statistically different. Within set 1 each location was found to be different from the others. In set 2 the dashboard was different from the other two locations, which were not different from each other.
Nicotine
Nicotine concentrations varied between 5.06 µg/m3 and 411.3 µg/m3 for both window positions inside the car (tables 3 and 4). The mean concentrations for all exposures for window positions 1 and 2 were 9.6 µg/m3 and 65.6 µg/m3 respectively inside the car. The mean concentrations outside the car were usually non-detectable (LOD=0.04 µg/m3), or less than 0.07 µg/m3 ensuring that the concentrations of smoke inside the car were due to the cigarette smoked in the car and not from outside infiltration. No statistical difference was found between overall mean nicotine concentrations of the two window positions.
Polycyclic aromatic hydrocarbons
The integrated PAH data reported in figure 3 is a combination of the PAH mass concentrations measured using the Chemcomb denuders, filters and the NAP tubes. The inside concentrations are much higher than the outdoor concentrations by a factor of 10 for the majority of the PAH. No statistical difference was found between Ecochem particle bound PAH concentrations in the two window positions. The speciated PAH concentrations for each exposure in set 2 are listed in supplementary material.
Discussion
Our study adds to the body of knowledge of SHS exposures in vehicles in several ways. PM2.5, CO and nicotine have all been measured in previous SHS in vehicle studies, however few report them measured concurrently. This study measured four pollutants concurrently inside and outside the vehicle during controlled cigarette smoking exposures. The outside measurements provided background concentrations improving the accuracy of the reported SHS concentrations. PAH have never, to our knowledge, been measured in SHS in a vehicle. Gas and particle phase distributions from 16 chemically speciated PAH are reported as well as real-time particle phase PAH concentration. Gas phase NAP is difficult to measure because of high concentrations in comparison with the other gas phase PAH measured requiring a separate collection technique. The reported values of NAP in this study are among the first in SHS exposure studies. The novel measurements made in this study help to better quantify the composition of SHS exposures.
The ACHs at the three different locations in the vehicles were all different for each window configuration. ACHs have been measured in vehicles in several studies and ranged from 1.4 h−1 to 47.5 h−1 with the windows varying from closed to all open but not using mechanical ventilation. The ACH values in our study are on the low end of the range reported. Ott et al8 reported air exchange rates of 7 h−1 for vehicles moving at speeds between 25–70 miles per hour with the windows closed and the air conditioning system both on and off. When the windows were open and the vehicle was moving the ACH rates were 10 to 20 times larger. It could be assumed that the measured concentrations in the present study would be significantly lower if the measurements were made in a moving vehicle with an open window.
Nicotine and PM2.5 study comparisons
The particle phase nicotine concentrations were statistically significantly different between the two sets of experiments while particle phase PAH and PM2.5 concentrations were not different. One possibility could be due to a difference in the surface areas in the vehicles. The Jeep Cherokee was owned by a cigarette smoker, the amount of nicotine adsorbed to the surfaces may be larger than those of the rented car where smoking may not have occurred at the same concentrations. A higher surface concentration of nicotine prior to smoking of the test cigarettes may act to reduce the amount of freshly emitted nicotine that partitions to vehicle surfaces. The levels of nicotine measured in this study are comparable to Jones et al,21 the only other study to our knowledge to measure nicotine in SHS in vehicles. The reported nicotine values here of 9.6 µg/m3 and 65 µg/m3 for the two exposure conditions and 9.6 µg/m3 reported are comparable or higher than the concentrations measured in homes of smokers (1–3 µg/m3), offices (N.D to 48.4 µg/m3) where smoking is allowed, and restaurants and bars (N.D. to 13.8 µg/m3) as reviewed in the introduction.
The particle size distribution in figure 2 shows that the majority of the PM is contained in the smallest sized particles. Much research has indicated that smaller particles may have more health-damaging potential.22 ,23 Smaller particles have larger surface areas per unit mass than larger particles; increased particle surface area can provide additional sites for toxic chemicals to interact within the body. The mean particle size reported here is most likely an overestimate due to the limitation of the instrument used.
Polycyclic aromatic hydrocarbons
PAHs are pollutants of high interest in the ambient air pollution field due to their many associations with various detrimental health effects. Comparing only particle phase PAH concentrations, the values in this study, 67.3 ng/m3 were higher than measurements made in a highly polluted urban traffic24 54.7 ng/m3. Combined gas and particle PAH concentrations measured in German bars measured were 278.5 ng/m3, restaurants 220.6 and dance clubs 392.6 ng/m325 compared to 1325.1 ng/m3 in this study. In addition the values reported in this study greatly exceed the PAH concentration of 22.9 ng/m3 determined by Jedrychowski14 to cause an increase in wheeze and a decrease in lung function in their study population of adults. It is important to highlight that the levels in this study are 1-h averages while the comparison values are at least 8 h averages.
Impact on daily personal mean
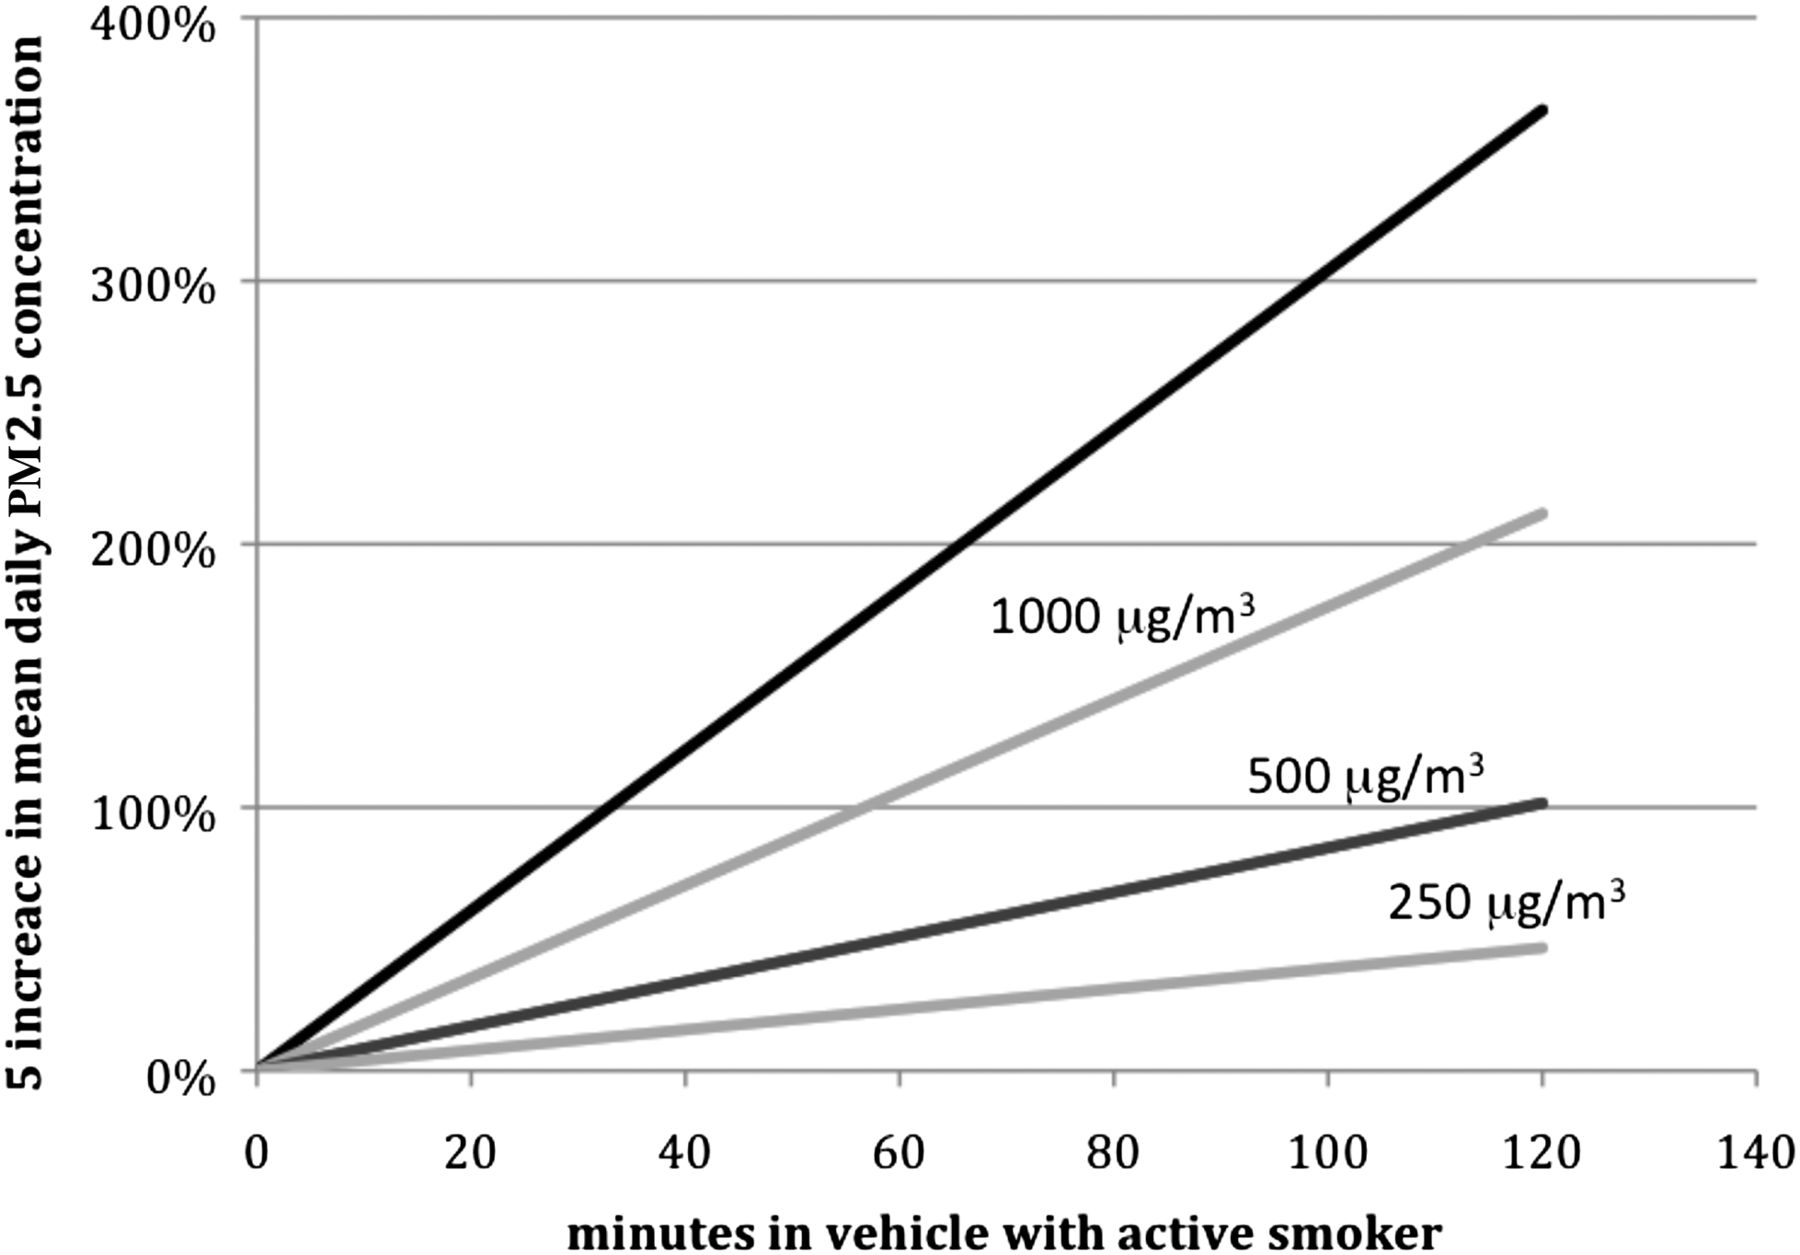
Spending even a short amount of time inside a car with a smoker provides a great example of how high concentrations can have significant impacts on the daily mean of PM2.5 for a personal exposure. For example, the mean PM2.5 concentration measured in set 2 was for the first 10 min while the smoker was smoking 1697.3 µg/m3. This will represent the average concentration in a non-moving vehicle while a person is actively smoking. Personal daily exposures to PM2.5 for a child living in a non-smoking home in California is 37.9 µg/m3 as reported by.26 Using Deflino et al's reported personal PM2.5 concentrations for children from non-smoking homes the effect of PM2.5 from SHS in a stationary vehicle was estimated for varying times of exposure. Figure 4 shows the estimated per cent increases to the daily mean personal PM2.5 exposure concentration for a child spending increasing amounts of time in a car with a smoking person. Per cent increases for lower concentrations were also estimated, as a stationary vehicle represents the highest concentrations of SHS in a vehicle. A vehicle moving with the windows open, or using the ventilation system will have lower concentrations. Only 10 min in the car with smoking will cause a 30, 18, 8 or 4% increase to the daily mean PM2.5 personal average of a child for vehicle concentrations of 1697, 1000, 500, and 250 µg/m3 respectively.
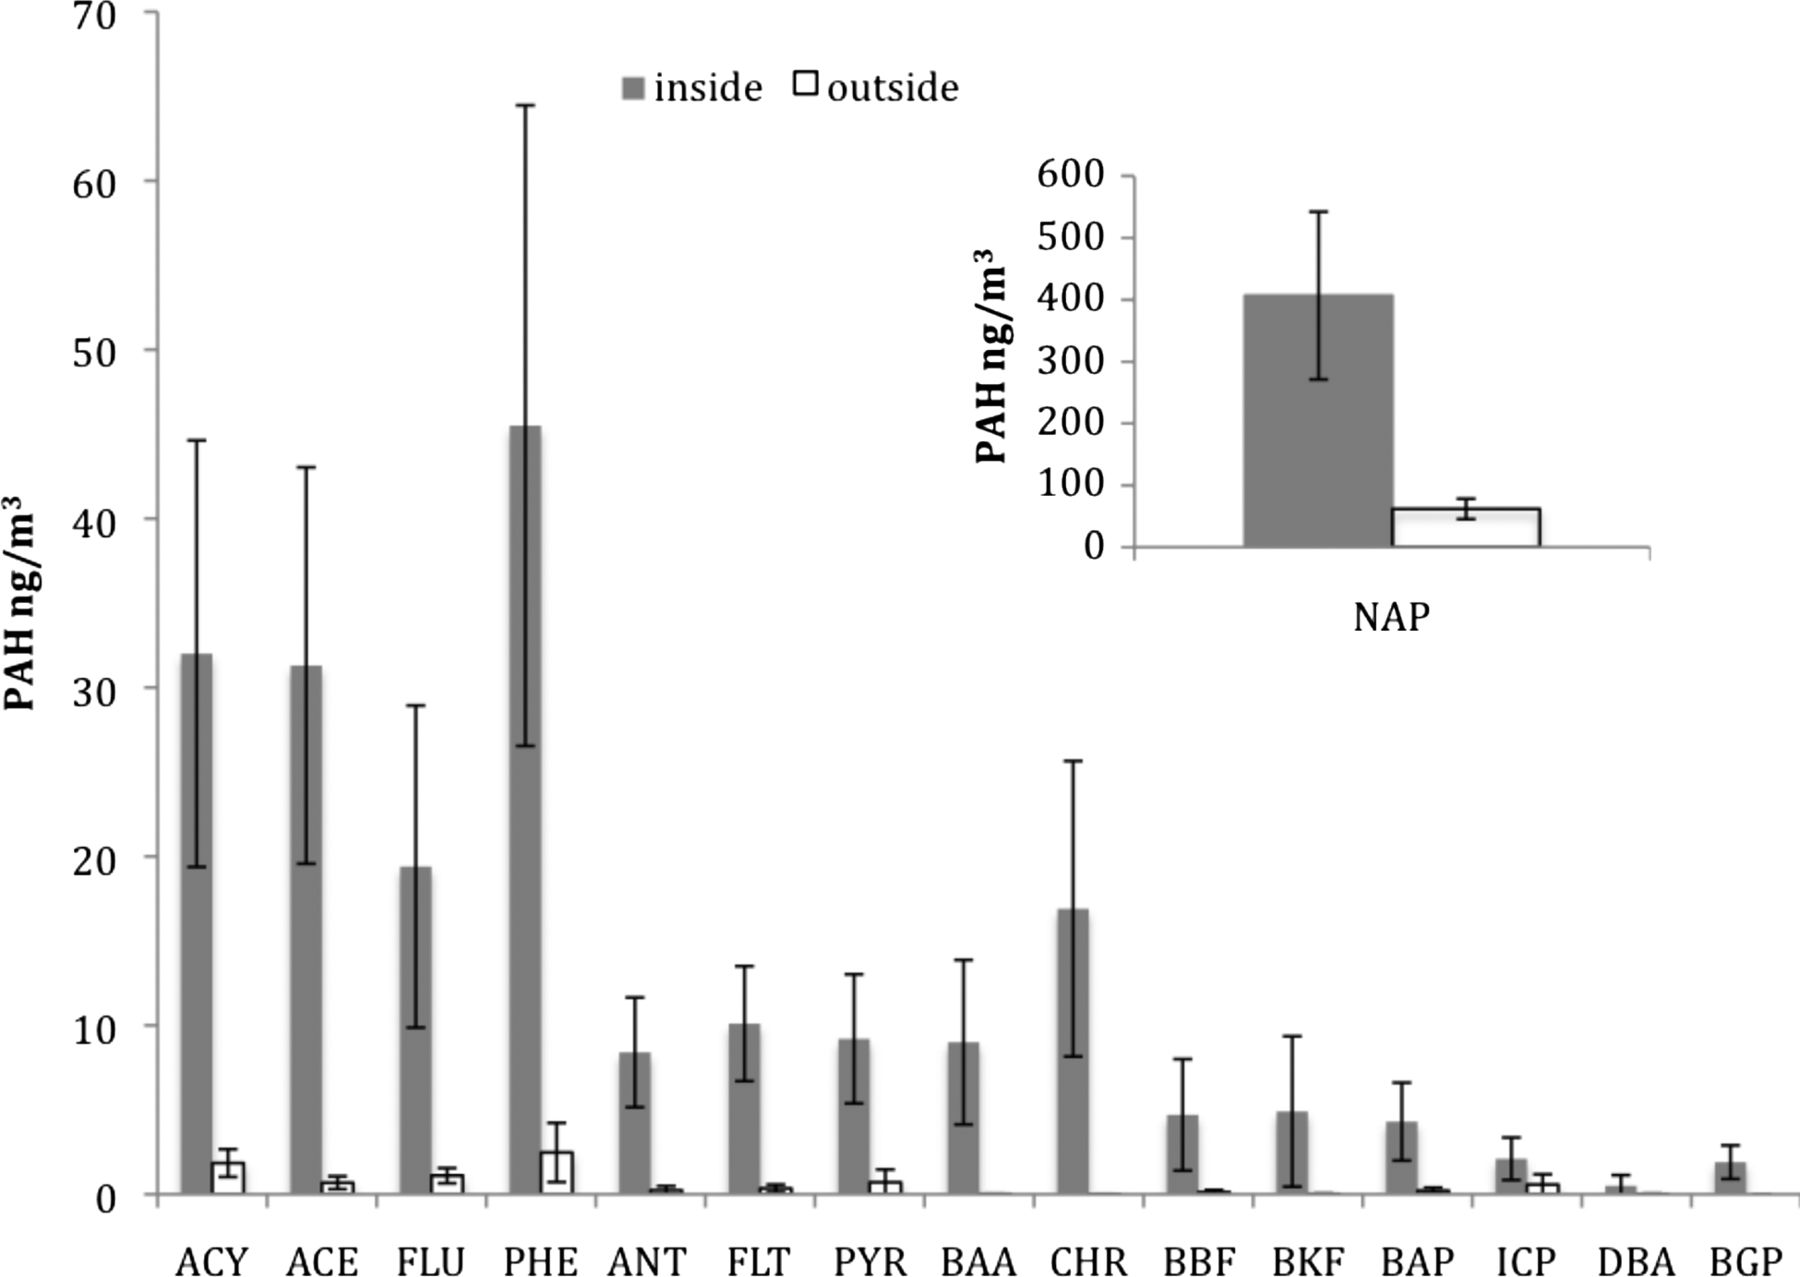
Mean polycyclic aromatic hydrocarbons (PAH) concentrations for exposures in set 2 inside and outside of the vehicle. NAP was measured using sorbent tubes, rest with Chemcomb denuders and filters. ACE, acenaphthene; ACY, acenaphthylene; ANT, anthracene; BAA, benz[a]anthracene; BAP, benzo[a]pyrene; BBF, benzo[b]fluoranthene; BKF, benzo[k]fluoranthene; BGP, benzo[ghi]perylene; CHR, chrysene; DBA, dibenz anthracene; FLT, fluoranthene; FLU, fluorene; ICP, indenopyrene; NAP, Naphthalene; PHE, phenanthrene; PYR, pyrene.
Estimated increase in daily PM2.5 exposure for a child spending time inside a vehicle with PM2.5 SHS concentrations of 934 μg/m3 (this study), 500 μg/m3 and 100 μg/m3. The baseline PM2.5 exposure for a child is 38 μg/m3 (Delfino et al. 2004).SHS, secondhand smoke.
Conclusions
The data presented are among the first to quantify SHS exposures in the back seat of a vehicle where a child sits. The results of this study are limited in that only stationary vehicles were studied. Exposures to SHS occur over a range of vehicle conditions and concentrations levels and the data presented here reports on part of the expected range. In table 1 we provide a summary of previously conducted studies and ACH. In comparing the ACHs with moving vehicles and different window configurations, it is expected that the measured concentrations are within an order of magnitude of the expected values for a moving vehicle with an open window. Children are more vulnerable than adults, and their exposures to tobacco smoke in a vehicle are completely controlled by the adults with whom they share the vehicle. Although regulations have been enacted to protect non-smokers including children in many public venues, SHS exposures to children in vehicles are permitted in 44 of the 50 USA and in most countries worldwide. We have shown that SHS concentrations in vehicles greatly exceed those measured in other venues such as bars, restaurants, and casinos. Klepeis et al27 analysed the National Human Activity Pattern Survey and found that the average time spent in a vehicle accounts for 5% (72 min) of a day. SHS exposures for even short periods of time can cause significant increases to daily averages of PM2.5. The findings of our study support the idea that SHS exposures should be limited in vehicles, especially with children present. Reducing SHS exposures in a vehicle would substantially reduce personal exposure for both children and adults. Particularly in the case of children, measures to reduce or eliminate SHS exposure in vehicles could have a major impact in reducing the risks of SHS-related illness.
What this paper adds
-
In this study we quantified exposures to several pollutants present in secondhand tobacco smoke including polycyclic aromatic hydrocarbons concentrations that to our knowledge have never been measured in vehicles with an active cigarette smoker.
-
We also estimated the increase to average daily PM2.5 of a child from spending time in a vehicle with an active smoker, providing additional evidence in support of protecting children's health by banning smoking in cars with minors.
Acknowledgments
We would like to thank all of the volunteers that assisted with this study. Cotys Winston assisted in running the clinical studies and Charles Perrino provided laboratory assistance.
References
Supplementary materials
Press release
Files in this Data Supplement:
Footnotes
-
Contributors SH and NB designed this study. DD and MM jointly managed all human subject related activities such as designing and conducting the questionnaires, and other activities such as recruitment, hospital stays, human research approval and ensuring the exposure portion of this study was conducted in a manner that was in keeping with biomarker study. The study was conducted in two parts. IJ as a part of his master's thesis conducted the first set of the exposure sampling and analysis. MT and JK conducted the second set jointly. AN supervised the second set of exposures, analysed the data and wrote the final manuscript. All coauthors were consulted in the writing of the final manuscript.
-
Funding The Flight Attendant Medical Research Institute and the Flight Attendant Medical Research Institute distinguished professorship award provided financial support for this study.
-
Competing interests There are no competing interests associated with this study.
-
Provenance and peer review Not commissioned; externally peer reviewed.