Article Text

Abstract
Background and aim There is little academic research on tobacco brand loyalty and switching, and even less in restrictive marketing environments such as Australia. This paper examines tobacco brand family loyalty, reasons for choice of brand and the relation between these and sociodemographic variables over a period of 10 years in Australia.
Methods Data from current Australian smokers from 9 waves of the International Tobacco Control Policy Evaluation 4-Country Survey covering the period from 2002 to early 2012. Key measures reported were having a regular brand, use for at least 1 year, brand stability (derived from same reported brand at successive waves), and reasons for choosing brands.
Results Measures of brand loyalty showed little change across the period, with around 80% brand stability and 95% reporting a regular brand. Older adults were more brand-loyal than those under 25. Young people's brand choice was influenced more by friends, whereas older adults were more concerned about health. Price was the most reported reason for brand switching. Those in the higher income tertiles showed more loyalty than those in the lowest. The least addicted smokers also showed less brand loyalty. We found no clear relationship between brand loyalty and policies that were implemented to affect tobacco use.
Conclusions Levels of brand loyalty in Australia are quite high and consistent, and do not appear to have been influenced greatly by changes in tobacco control policies.
- Advertising and Promotion
- Price
- Socioeconomic status
- Economics
- Tobacco industry
Statistics from Altmetric.com
Introduction
This paper documents aspects of tobacco brand loyalty, including rates of switching and reasons for brand choice, among Australian smokers over the period 2002 to early 2012. Smoking rates in Australians aged 14 years and older have declined over this period, from 19.4% in 2001 to 15.1% in 2010.1 Several factors affect brand choice, such as price and packaging,2 ,3 and to the extent that smokers value their brand of cigarettes, they should be reluctant to shift unless they have the opportunity to use brands with even more of the qualities they desire.
Australia is a unique market for tobacco in several respects. Although about 99% of the market is dominated by three major market companies,4 there are a wide variety of brands available and a lower concentration of market share for any one brand than in other countries such as the USA. Pack sizes vary between 20 and 50 cigarettes as a result of the historical practice of taxing tobacco by weight up until 1999, when price per stick taxation was introduced.5 The larger pack sizes (>25) have been used mainly in budget brands. The market is organised by the industry into three broad price band segments: premium, mainstream and budget.
Australia has also become an increasingly restrictive market for tobacco.6 By the year 2000, advertising was banned in all settings excepting point of sale (POS) and on packs, with very limited exemptions for some forms of sponsorship until 2006. On a state by state basis, displays of cigarettes at POS were progressively prohibited between 2009–2011, preceded in some states by bans on POS advertising and restrictions on display size.7 Tobacco products are now required to be concealed at POS in all states,8 which has been associated with reduced levels of spontaneous purchasing.9 In 2006, misleading variant terms like ‘Light’ and ‘Mild’ were banned and text only health warnings on packs were replaced by graphic warnings marginally larger on the front of the pack (30% compared with 25%), but much larger on the back (90% compared with 30%). These warnings increased smokers’ health-related reactions to packs,2 reactions shown to be associated with increased quitting.10 Finally, in 2010, there was a 25% tax increase on top of the regular consumer price index–based increases.
None of the abovementioned policies were designed to influence brand choice, all being either targeted at consumer awareness, increasing cessation and/or reducing uptake overall. However, it is possible that a policy affecting the appearance of brands such as graphic warnings on the pack, their salience at POS (not being visible might reduce switching) and price increases (downshifting to cheaper brands) could all conceivably influence brand choice, potentially in ways that could at least in part undermine the intended effects.
The tobacco industry has a direct commercial interest in researching brand switching—some of this research is now publicly accessible through litigation in the USA and Canada in the early 1990s.11 Most of this research is US-based, and mostly from the late 1980s to early 1990s.12 ,13 The 1991 ‘Philip Morris Switching Book’ 14 extensively describes switching across demographics, type of cigarette, company and brand, based on telephone interviews with 34 117 US smokers over a 12-month period. ‘Switchers’ are defined as those smoking their current brand for 1 year or less in cross-sectional surveys, although the methods are not known. Though sources of earlier data are unspecified, this document additionally lists the annual incidence rate of brand switching from 1981 (the highest rate, at 11.0% of smokers) to 1991, with the lowest rate of switching in 1987 (6.2%). Most recently, a short market research summary from 2000 indicated US brand family switching of around 14% over the preceding 2-year period across four major brand families,15 a figure consistent with the earlier data, suggesting no major change in brand switching.
The majority of independent brand-switching research has focussed on the US market, and suggests that over the period 1986–1993 around 10% of smokers switched brands in any given year.16 ,17 Independent research concerned with the effect of tobacco advertising on youth has shown that brand choice is related to both peer influence and exposure to brand advertising.18 Furthermore, one 1994 US study found that among regular adult smokers, the vast majority nominated their first brand smoked as their later regular brand, implying immediate and lasting brand loyalty.18
Research on tobacco brand loyalty and switching in Australia is sparse. One analysis of industry documents between 1990 and 2001 suggests that compared with the US market, Australian smokers are perceived as less brand loyal and more likely to smoke more than one brand or switch between brands.11 An industry report on the Australian market suggests brand family switching of around 15%, derived from six monthly telephone interviews of smokers from 1985 to 1988, questioning their main brand smoked, and whether this changed in the previous 6 months.19 Another Philip Morris document from 1990 stated that at least 33% of smokers shifted brands annually in Australia;20 however, because of the lack of details on the methods used, this high incidence rate might have included variant switching. A search of publicly available documents revealed no newer relevant industry documents. On the presumption that the industry has accurate estimates of brand switching, this suggests that at least at that time Australian smokers exhibited lower brand loyalty than their US counterparts. The restrictive marketing environment for tobacco in Australia is now markedly different to that in the USA and to that of the previous Australian research. The reduced differentiation between brands may reduce brand loyalty; however, equally there may be fewer incentives for smokers to change brands.
This paper aims to describe tobacco brand family switching, reasons for brand choice and other indicators of loyalty over a period of 10 years, among Australian smokers. It also explores several different methods of estimating brand loyalty to see if they provide similar results. We explore the possibility that brand loyalty may be reduced in poorer smokers as a result of price differentials forcing some downshifting to less desired cheaper brands, and more generally explore whether policy changes have a detectable impact on brand loyalty.
Methods
Sample
The International Tobacco Control Policy Evaluation (ITC) Project includes a longitudinal study of smokers from Australia, Canada, the USA and the UK (ITC Four Country Project). This paper uses the nine waves of data collected from the Australian arm of the study, and only that from current (at least monthly) smokers (factory made or roll-your-own). The survey was conducted using computer-assisted telephone interviewing, and more recently, partly online. Cohort members lost to attrition were replenished at each wave from the same sampling frame to maintain sample size. Methods are further described by Fong et al21 and Thompson et al.22
Sample sizes of smokers were 2272 at Wave 1 (2002), 1974 at Wave 2 (2003), 1851 at Wave 3 (2004), 1714 at Wave 4 (2005–6), 1801 at Wave 5 (2006–7), 1791 at Wave 6 (2007–8), 1372 at Wave 7 (2008–9), 1111 at Wave 8 (2010) and 1104 at Wave 9 (2011–12). Of those recruited at Wave 1, 356 completed all successive waves.
As a result of it being a cohort survey replenished from the same sampling frame with a higher dropout rate among younger smokers, the average age of the cohort has increased across waves, from 38.9 years (SD=13.6) to 50.0 years (SD=12.8).
Brand loyalty measures
There were three measures of brand loyalty: (1) ≥1 year use: at each wave, smokers were asked, ‘What brand of cigarettes do you smoke more than any other?’. Those reporting a brand were then asked how long they had been smoking this brand (Waves 1–5), or for Waves 6–9, simply if it was at least a year. (2) Brand stability: defined as the brand family (ignoring variant) reported at one wave being the same as that reported at the next wave. This measure was based on adjacent wave intervals; therefore, participants who quit at any wave were missing/excluded on the two related intervals. (3) Regular brand: ‘Do you have a regular brand and variety of cigarettes?’ asked only in Waves 5–9. Where participants said they had a regular brand and what brand it was, this answer was used in the above brand measures. In Wave 5, those without a regular brand were not asked which brand they smoked most; instead their brand stability was derived from brand last purchased. For Waves 5–9, when the regular brand question was introduced, those without a regular brand were not asked about ≥1 year use, we assumed less than 1 year use.
Reasons for brand choice measures
Reasons for brand choice were only asked of all smokers at Wave 9, 2011, with yes/no answers to: ‘Was part of your decision to smoke this brand based on any of the following: The tar and nicotine levels for the brand?; It may not be as bad for your health?; As a way to help you quit?; The price?; How they taste?; How satisfying they are?; The look and feel of the pack?; Your friends smoke them?’
Other measures
Sociodemographic measures included sex, age category (18–24, 25–39, 40–54 and 55 years and over) and income category (from annual household income: low, <$30 000; moderate, $30 000–$59 999; and high, $60 000+). Tobacco addiction was assessed by the Heaviness of Smoking Index (HSI; 7 levels, 0=least addicted to 6=most addicted).23
Brands value categories were based on recommended retail prices (RRP) listed in editions of The Australian Retail Tobacconist from the beginning (December 2002–January 2003), middle (October–November 2006) and end (November–December 2011) of the study period. Brands were ordered by maximum price per stick in each time period (see online supplementary appendix A); natural cut-off points were then found for each market segment using the listing of key brands by market segment from Tobacco in Australia, which allocated all the top-selling brands into the appropriate category.24 Price per stick cut-offs for discount, mainstream and premium classification, respectively, were ≤34c, 35–37c, 38c+ in 2002; ≤40c, 41–44c, 45c+ in 2006; and ≤59c, 60–69c, 70c+ in 2011. Brands that changed classification between these three periods were classified into the category that they appeared two out of three times or in mainstream where brand crossed all three categories (one brand only, used by only one participant). Among brands with market share above 1%, Alpine was classed as mainstream, having started at premium in 2002. Longbeach was classified as discount, although it was in the mainstream price range in 2011.
Analyses
Simple bivariate relationships were evaluated using χ2 tests. Generalised Estimating Equation (GEE) modelling allowed testing for demographic differences collapsed across the survey period and overall longitudinal trends, and by treating waves as categorical, possible effects of major policy changes in the waves immediately following implementation. Where GEE showed evidence of subgroup differences, these were examined using further χ2 tests. All GEE models included interwave interval (continuous, days) as control, with demographic variables entered individually to test independent categorical effects. Overall variable significance was calculated with postestimation (composite, linear) Wald tests. Multivariate relationships between sociodemographics and reasons for brand choice were tested with logistic regression. Critical effect sizes for the logistic regressions (as all of the GEE) were determined using G*Power 3.1.6.25 This analysis indicated that with the sample size of 1000, α at 0.05 provides power of 0.8 to detect effects of magnitude OR <0.62 or >1.52.
Results
How consistent are smokers in their brand choice?
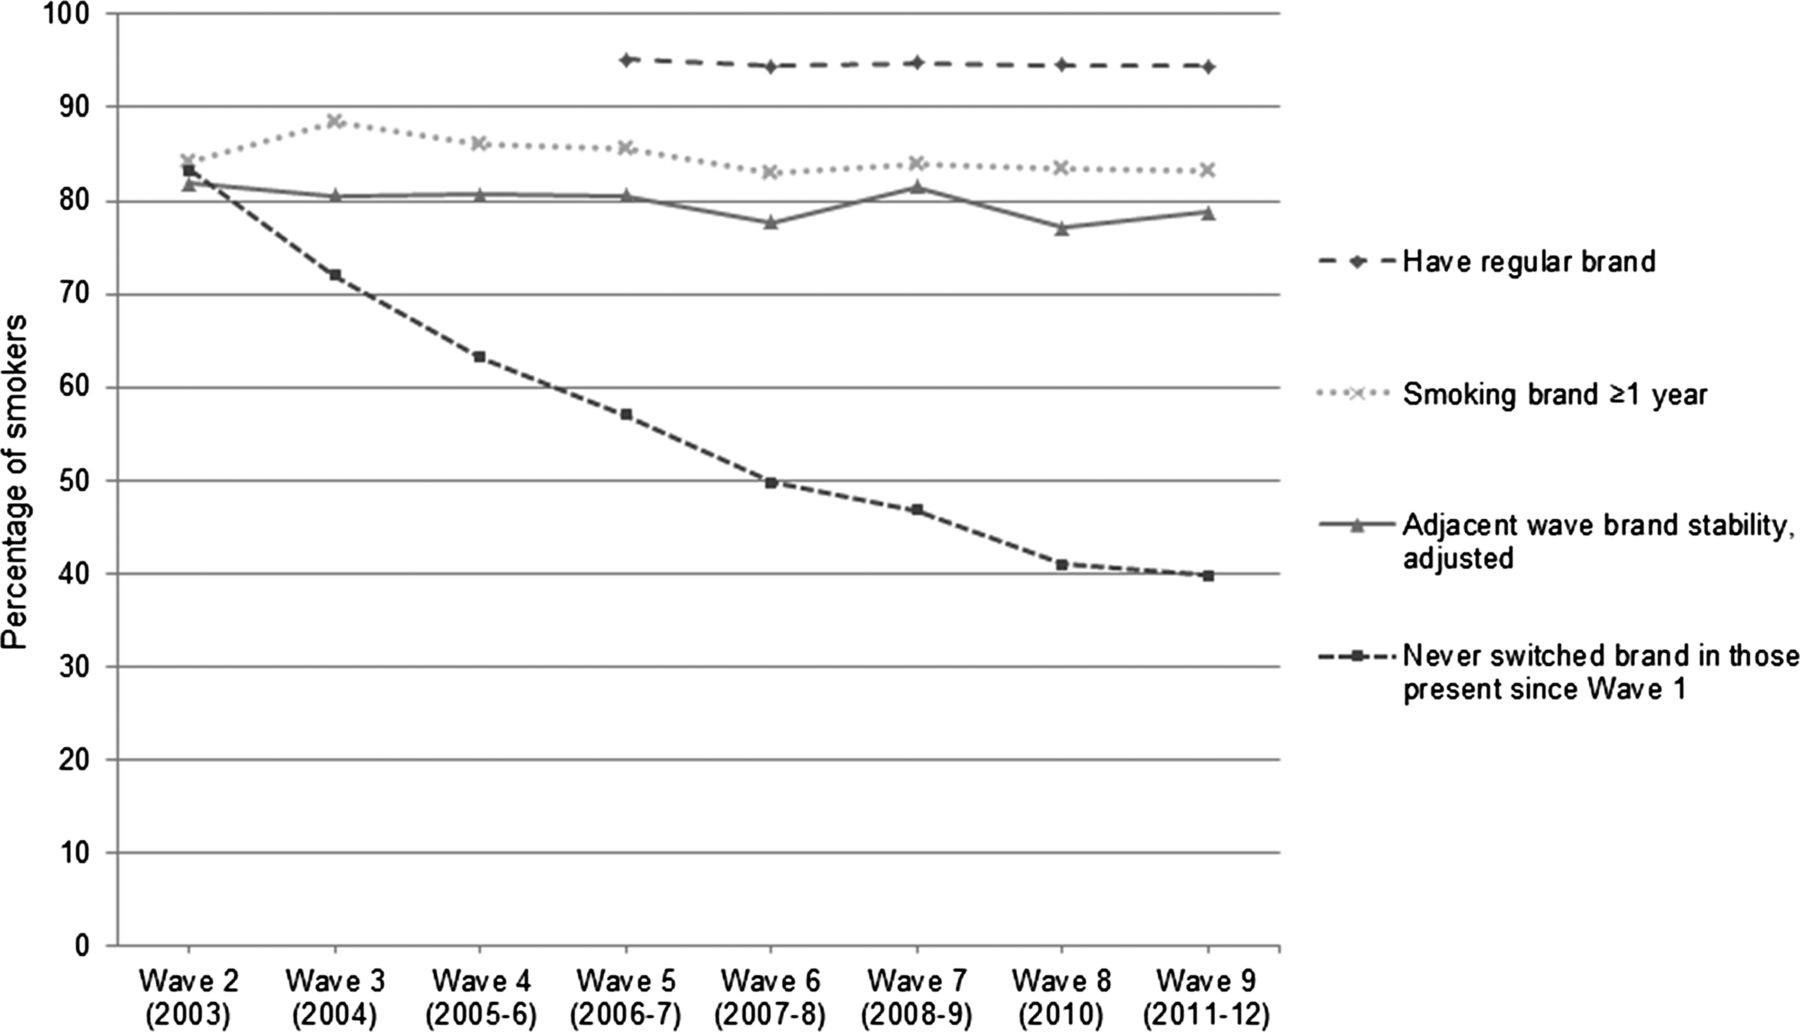
Figure 1 shows that the three brand loyalty measures (≥1 year use, brand stability and regular brand) remained remarkably constant across the survey period. Percentages shown in figure 1 are adjusted for interwave interval with unadjusted percentages reported in table 1. Between 94.5% and 95.1% reported a regular brand (Waves 5–9 only). Assuming that smokers with no regular brand (at Waves 5–9) had been using their nominated brand less than 1 year, a reasonably stable number (83.1–88.4%) of smokers reported ≥1 year use. Brand stability was consistently lower, with between 77.6% and 82.3% reporting the same brand at successive waves (excluding those currently quit at either wave).
Percentage of smokers reporting same brand at adjacent waves by age and income
Stability of brand choice Wave 2 to Wave 9.
Figure 1 also shows the declining proportion of smokers who have never switched from their first nominated brand among those retained over the 10-year survey period. By Wave 9 (N=254), this was quite low (39.8%), indicating that the switching recorded at adjacent waves is not solely the result of continual switching among a small group of smokers. To examine the relative stability of the retained sample, smokers present in Waves 1 to 2 were grouped based on total number of waves participated in (2 waves only, 3–4, 5–6, 6–7, or all 9 waves). Resultant groups were not significantly different on brand stable for wave 1 to 2 (χ2(4)=6.28, p=0.18), though the trend was increasing brand stability with increasing survey participation (2 waves=80.1% stability to 9 waves=84.8% stability).
Finally we looked for effects by survey wave to identify any trends and to see if waves associated with interventions had different levels of stability. After controlling for interwave interval, GEE analysis showed no significant linear (p=0.11) or non-linear (quadratic; p=0.87) trends in brand stability across waves.
Sociodemographics of brand loyalty
GEE analysis showed that females were more likely to report having a regular brand (OR=1.53, 95% CI 1.16 to 2.03, p=0.003), but the other two measures showed no significant differences (p=0.32 for ≥1 year use; p=0.21 for brand stability).
Compared with the oldest age category (55+), the youngest age group was less likely to be brand stable (OR=0.61, 95% CI 0.48 to 0.77, p<0.001), with no evidence of difference for the other groups (25–39 years, OR=1.00, 95% CI 0.84 to 1.19, p=0.97; 40–55 years, OR=1.16, 95% CI 0.99 to 1.36; p=0.07). Similarly, compared with the oldest smokers, the youngest group were less likely to report ≥1 year use (OR=0.45, 95% CI 0.32 to 0.63, p<0.001), with no apparent difference with the other groups (25–39 years, OR=0.82, 95% CI 0.64 to 1.05, p=0.12; 40–54 years, OR=1.14, 95% CI 0.90 to 1.44, p=0.27). Regular brand showed a different pattern, with both middle age groups more likely to report having a regular brand (40–55 years, OR=1.78, 95% CI 1.19 to 2.68, p=0.005; 25–39 years, OR=1.64, 95% CI 1.01 to 2.66, p=0.04) and no evidence of difference in the youngest group (18–25 years, OR=1.04, 95% CI 0.47 to 2.29, p=0.92) when compared with those over 55 years.
Compared with the lowest income category, the middle (OR=1.37, 95% CI 1.11 to 1.70, p=0.004) and highest categories (OR=1.77, 95% CI 1.41 to 2.23, p<0.001) were significantly more likely to have smoked their brand for ≥1 year. Regular brand showed a similar pattern though it did not reach significance.
Similarly, brand stability was more likely in the middle income category (OR=1.29, CI 1.12 to 1.49, p=0.001), and most likely in the highest income group (OR=1.74, CI 1.49 to 2.04, p<0.0001). There was considerable variability of this between waves, see table 1. Notably, the income differential in brand stability disappeared in the two waves following the 2010 tax increase. Separate analyses on each income group found no effect of wave on brand stability for either low or medium income. In the high-income group, brand stability from Wave 2 decreased significantly in Wave 8 following the taxation increase (OR=0.27, 95% CI 0.10 to 0.73, p=0.009), though this recovered somewhat at Wave 9 (OR=0.56, 95% CI 0.31 to 1.01, p=0.053). We looked to see if this might be due to downshifting to cheaper brands; however, there was no evidence of differential category switching in the high-income group at wave 6–7 compared with 7–8. As this was the period with a large excise tax increase, we also looked at how prices changed over the period (see table 2). Percentage increases in reported price paid per cigarette between waves 7 and 8 were similar across value categories, meaning greater absolute price increases in the premium category.
Absolute and relative price increases around the 2010 taxation increase as a function of market segment of brands
Compared with the most addicted smokers (HSI=6), the least addicted (HSI=0) showed significantly lower brand stability on GEE analysis (OR=0.63, CI 0.41 to 0.96, p=0.032); the other HSI groups were not significantly different (p=0.07 to 0.45). GEE showed no significant relationship between HSI and ≥1 year use (overall variable χ2(6)=11.23, p=0.08).
However, there was a curvilinear relationship between HSI and having a regular brand (overall variable χ2 (6)=17.08, p<0.01)—this increased with increasing HSI up to HSI=5, then dropped sharply in the most addicted group to be non-significantly lower than HSI=0.
Reasons for brand choice (Wave 9 only)
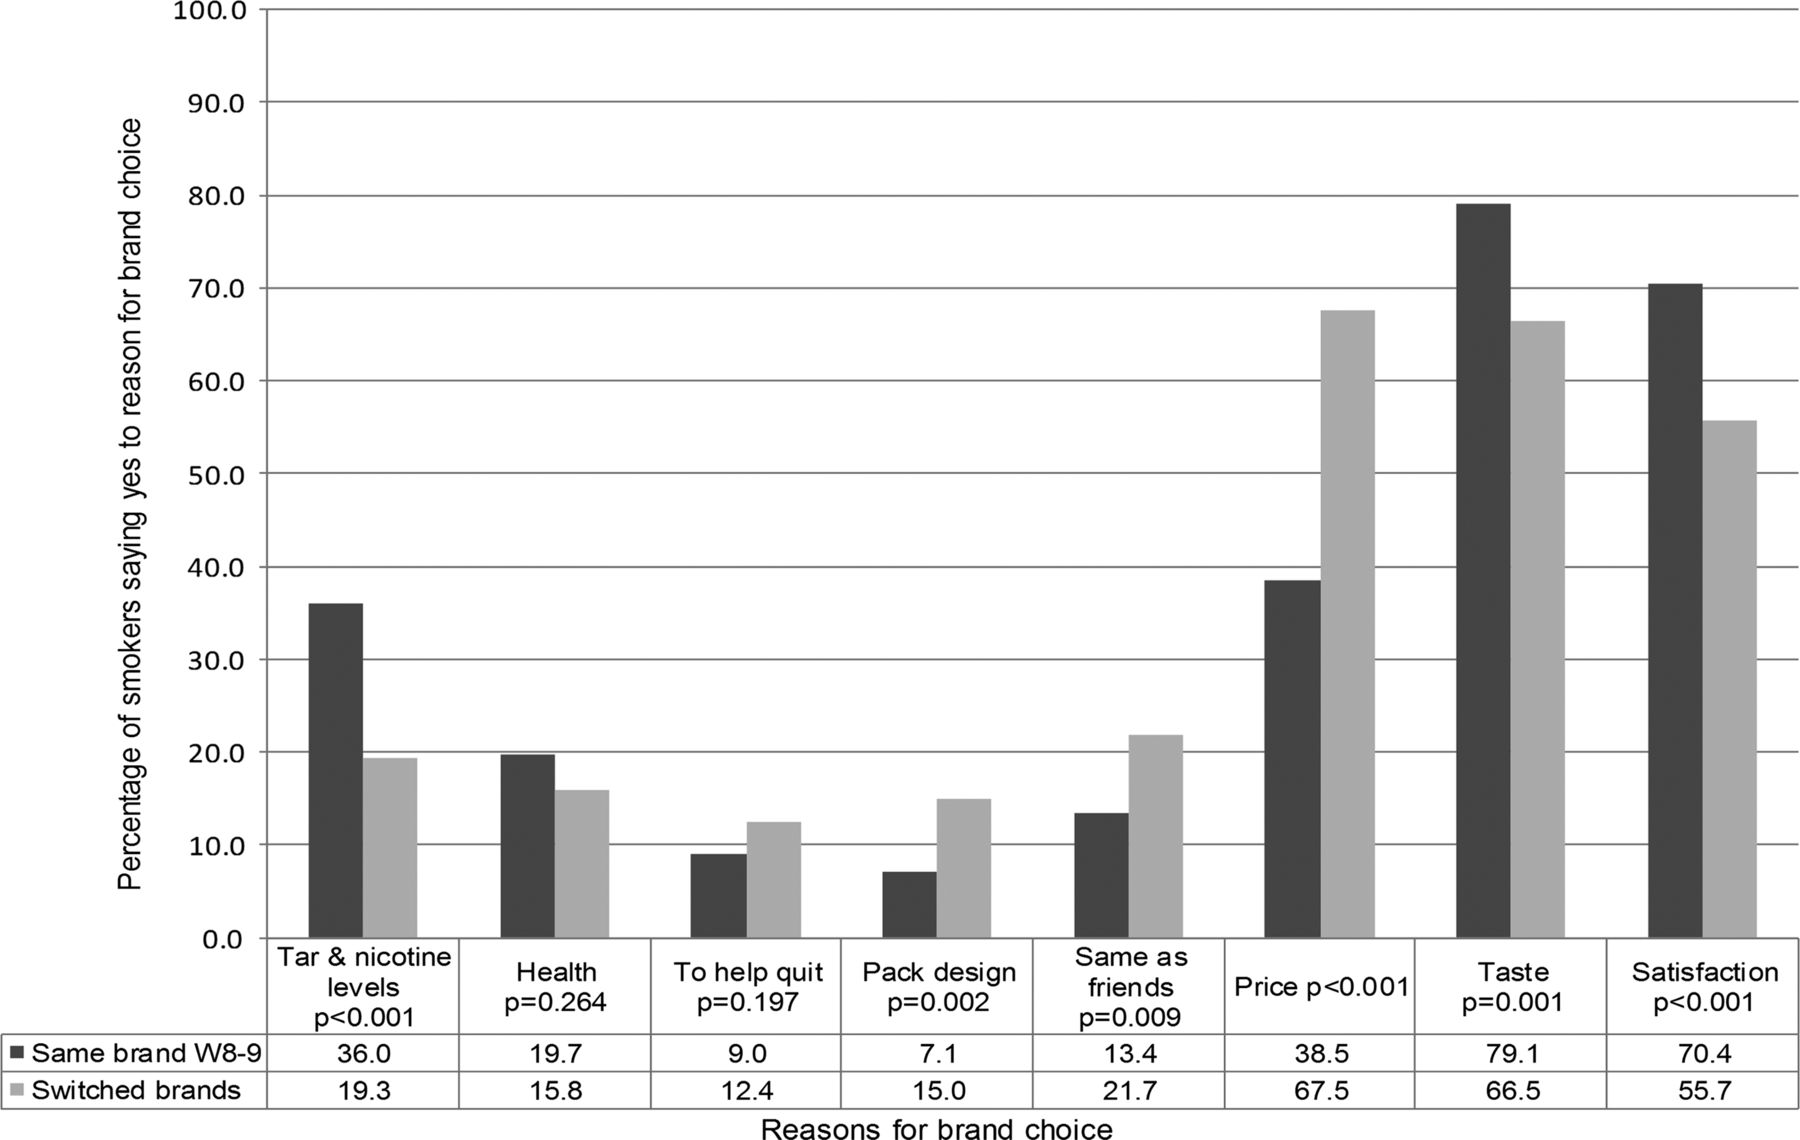
Reasons for brand choice surveyed and their relationship to brand stability are shown in figure 2. Smokers who chose their brand for tar/nicotine levels, taste or because they found their brand satisfying were more likely to be brand stable between Waves 8 and 9. Smokers who chose their brand for pack design, to have the same as their friends, or for price were less likely to be brand stable; price was the most frequently reported reason for switching.

Reasons for brand choice at W9 and brand stability W8–9.
Reasons for brand choice and relationships to sociodemographics are shown in table 3.
OR (95% CI) of sociodemographics predicting proportion of smokers nominating reasons for brand choice
No sex differences were found.
The older the age category, the more likely smokers were to choose their brand for health reasons. The younger the age category the more likely smokers were to choose what their friends smoked. Choosing for satisfaction was highest in both extreme age groups.
The lowest income group was most likely to choose their brand on price, and the highest income group the least likely. This pattern was reversed for taste.
Choosing their brand for price was sharply associated with increased level of HSI. There were also non-linear relationships with choosing on basis of ‘friends’ and to help them quit.
Discussion
These data show that, at least for Australian smokers, both reporting having a regular brand and reporting ≥1 year use underestimate the extent of brand stability as indexed from longitudinal analyses of reporting smoking the same brand at successive surveys. All three of these measures were stable across the period of the study, with no clear evidence of any impact of policy changes.
These measures seem to assess somewhat different things. Having a regular brand showed greater differences to the other measures, which might be expected, given its more subjective nature. Brand stability and ≥1 year use showed similar patterns except among the least addicted group, which showed lower brand stability but were no less likely to report having smoked their current brand for ≥1 year.
The data from cumulative brand switching wave to wave show that over a period of 10 years most smokers have made at least one brand switch. That the small retained cohorts were, if anything, more brand loyal, makes the overall estimate of consistency of brand use likely conservative. That said, it may underestimate brand loyalty longer term, as some may have a preferred brand and return to it over time. However, it does show that there is considerable switching. In future work, we plan to look at whether stability of brand choice is related to interest in and actual quitting activity.
It is not possible to draw any clear conclusions as to whether brand stability might have changed from the period when cigarettes could be more actively promoted. The estimates found in industry documents would suggest there may have been an increase in stability, as the rates of brand switching reported in the 1980s was much higher (about 33%).18 It is not clear what the basis of this estimate is, but as it indicates greater switching than any of our measures and is likely to be based on cross-sectional data, it seems likely that switching may have declined, but is now stable.
The most important reasons for brand choice among switchers were price, to be the same as that of their friends and pack design. Satisfaction and taste were the major reasons in those who were brand stable. For consciously mediated choice, those aspects of cigarettes that are intrinsic seem more important for those maintaining the same brand, while more external factors may be stimulating switching. Unfortunately, as these measures were only asked of all smokers in the last wave, we cannot explore prospective associations at this point.
It is notable that gender appears to have little effect on brand loyalty, and no relationship with reasons for brand choice.
The youngest age group (18–24 years) was generally the least brand loyal, with little difference between the other age groups. Young people were more likely to report peer influence as a reason for choice, whereas older people (55+ years) were more likely to report choosing for health concerns and satisfaction. As friendship groups probably change more in the young this is likely to contribute to the greater switching among this group. It should be noted that the under 25 s, are under-represented in this study.
As expected, low-income smokers were less brand loyal and report being more price-sensitive, although we found no impact of the large 2010 price increase in this group. The only evidence of any possible relationship between policy changes and brand loyalty was that this substantial taxation increase may have decreased brand stability in high-income smokers. However, given there was neither an overall change to brand stability nor an increase in downshifting to value categories, we are not sure that it can be attributed to the price change.
The least addicted were less brand loyal than all others and most likely to choose the same brand as their friends. Both could be because they are more likely to share packs, and thus, have their choices more determined by others. The consistent increase in price as a determinant of brand choice with increasing HSI is notable and unsurprising as greater consumption equals greater cost. This finding should not be confused with actual price sensitivity as measured by economists, as heavier smokers are likely more addicted and thus may be more resistant to the effects of price on consumption. They may prefer to use brand switching as a means of minimising costs rather than reducing consumption or quitting.
Our study has some limitations, which should be noted. Sample sizes are modest, and the study is not well powered to find small effects, particularly if they only occur among subgroups. While we have not estimated power for GEE analyses, given that the 5% change in brand stability across waves did not reach significance in estimating trends, if the interventions resulted in changes of <5%, we would not have power to detect them. Power is especially relevant for age, with differential dropout resulting in greatly reduced proportion of younger smokers at later waves. Given this is a cohort sample, it is not ideal for estimating long-term prevalence of the measures in the population. There is some suggestion of decreased brand loyalty in those dropping out (possibly related to age-related dropout), suggesting the estimates of loyalty over nearly 10 years may be inflated slightly.
Importantly, we only consider brand family switching; we have not attempted to assess variant switching within a brand family. The main reason for this is the 2006 banning of misleading descriptors, which resulted in most brand variants being renamed. We have not yet fully solved the problem of matching variants across this change. We also do not consider the issue of downshifting as a function of pack size.
Similarly, the apparent ceiling effect in regular brand combined with the long interwave intervals may indicate a lack of sensitivity to find real differences in the measures used, especially in the period immediately following policy interventions.
Finally, the data analysed here only come from one country: Australia. Nothing should be concluded as to the patterns to be found elsewhere, particularly where either the culture or the nature of the cigarette market differs markedly from Australia. The finding of no systematic brand switching associated with the price increases is consistent with a study from Mexico, which also found a reduction in daily consumption.26 In contrast, Cornelius et al27 found downshifting in a US sample following a large price increase there in 2009.
Conclusion
This study provides a picture of brand loyalty in Australia. The measures used here all suggest that brand loyalty has remained relatively steady in the Australian market this century and have been relatively unaffected by the policy innovations over that period.
What this paper adds
-
This paper contributes to the sparse academic literature on tobacco brand loyalty, showing its relative stability even in Australia's increasingly restrictive market.
Acknowledgments
The statistical advice of Hua-Hie Yong and Timea Partos of the Cancer Council Victoria is gratefully acknowledged.
References
Supplementary materials
Chinese Version
Files in this Data Supplement:
- Chinese version - BMJ Publishing Group Limited takes no responsibility for the accuracy of the translation from the published English original and is not liable for any errors which may occur.
Supplementary Data
This web only file has been produced by the BMJ Publishing Group from an electronic file supplied by the author(s) and has not been edited for content.
Files in this Data Supplement:
- Data supplement 1 - Online appendix
Footnotes
-
Contributors RB, FJC and GTF were involved in the design of the ITC Four Country Survey. RB conceived the topic of this paper with input from GAC and ES, who both carried out the data analysis and interpretation, assisted by RB. GAC drafted the paper with contributions from ES; comments and amendments were provided by all authors.
-
Funding The data collection for the ITC project is supported by Grants R01 CA 100362 and P50 CA111236 (Roswell Park Transdisciplinary Tobacco Use Research Center) from the National Cancer Institute of the USA, Robert Wood Johnson Foundation (045734), Canadian Institutes of Health Research (57897 and 115016), National Health and Medical Research Council of Australia (265903 and 450110), Cancer Research UK (C312/A3726), and Canadian Tobacco Control Research Initiative (014578), with additional support from the Propel Centre for Population Health Impact at the University of Waterloo. GC receives a Victorian Public Health Training Scheme scholarship from the Department of Health, Victoria, Australia.
-
Competing interests None.
-
Patient consent Obtained.
-
Ethics approval The ITC Surveys were cleared for ethics by Research Ethics Boards or International Review Boards at the University of Waterloo (Canada), The Cancer Council Victoria (Australia) and Monash University (Australia).
-
Provenance and peer review Not commissioned; externally peer reviewed.