Article Text

Abstract
Objective Scanty and controversial information is available on the impact of macroeconomic fluctuations on smoking behaviour. No study has quantified the effects of fiscal crises on smoking prevalence. This study aimed to investigate the effects of the 2007–2008 economic crisis on smoking prevalence and number of smokers in the USA.
Methods Using data from the repeated Behavioural Risk Factor Surveillance System (BRFSS) surveys in pre-crisis (2005–2007) and post-crisis (2009–2010) periods on a total of 1 981 607 US adults, we separated the expected (after allowance for the demographic growth of the US population, secular smoking prevalence trends and changes in sociodemographic characteristics) from the unexpected (assumed attributable to the economic crisis) changes in the number of smokers across different employment statuses.
Results Joinpoint regression analysis revealed no significant changes in smoking prevalence trends over the period 2005–2010. The crisis resulted in an increase in the number of smokers in the US by 0.6 million. This is largely due to an unexpected decrease of 1.7 million smokers among employed and an increase of 2.4 million smokers among unemployed individuals, whose smoking prevalence also remains extremely high in the post-crisis period (32.6%).
Conclusions The 2008 financial crisis had a weak effect on smoking prevalence. The pro-cyclical relationship (ie, the crisis results in a lower number of smokers) found among the employed is offset by the counter-cyclical relationship (ie, the crisis results in a higher number of smokers) found among unemployed individuals. Public health interventions should specifically target those in unemployment, particularly in hard times.
- Economics
- Socioeconomic status
- Cessation
Statistics from Altmetric.com
Introduction
As it became clear that the current global economic recession triggered by the financial crisis in 2007–2008 would last for many years to come, concerns were raised about its consequences on poverty, development and public health. With a decline in government welfare expenditures, reduction of household income and increases in job losses there have been warnings that health would deteriorate, particularly for the most vulnerable individuals.1 ,2 Based on evidence from past economic downturns, however, it remains unclear whether health gets worse during recessions.3–5 On the one hand, several studies reported a pro-cyclical relationship (ie, economic crisis results in improved health). Economic downturns have been associated with a decline in alcohol-related deaths,6 traffic deaths7–10 alcohol consumption6 ,11 ,12 and obesity,13 as well as increased physical activity.13 On the other hand, a counter-cyclical relationship (ie, hard times result in deteriorating health) has been observed for other outcomes, including increased suicide rates,14–16 worsening mental health conditions17 and increased consumption of unhealthy food.18
Scanty and controversial information is available on the role of the economic crisis on smoking behaviour. At least four studies have found that smoking prevalence increases during periods of expanding economic growth and vice versa, thus suggesting that economic crises have pro-cyclical effects on smoking.7 ,13 ,19 ,20 In contrast, a large study of individuals aged 15–24 years reported an increase in tobacco use when the economy is weak.21
During the 2008 economic crisis, unexpected smoking prevalence trends have been observed in selected high-income countries. A study from Italy reported a significant increase in smoking prevalence from 22.0% in 2008 to 25.4% in 2009 after the spread of the economic crisis,22 although this increase was not sustained.23 Similarly, in the US, data from the National Health Interview Survey (NHIS) showed an unexpected increase in smoking prevalence from 19.8% in 2007 to 20.6% in 2008,24 but other representative surveys, including the Behavioural Risk Factor Surveillance System (BRFSS), did not show substantial changes in smoking prevalence over the same period.25
Given the inadequate and contradictory information on the impact of the economic crisis on smoking behaviour, the 2008 financial crisis provides a unique opportunity to generate new evidence on this issue. Using a large nationally representative survey of US adults, we analysed the effects of the current economic crisis on smoking behaviours, taking the realistic view that one major effect of the economic crisis is to reallocate people across various employment statuses, with substantially different smoking prevalence rates.
Hence, the crisis might affect the number of smokers directly (that is, by changing smoking prevalence) and indirectly (that is, by shifting people from one employment group to another). Within this general framework, the present study had three main objectives: (1) to detect changes in trends of smoking prevalence in the USA over the period 2005–2010, overall and by employment status; (2) to assess the effects of the economic crisis on US smoking prevalence, overall and by employment status; and (3) to estimate the number of smokers attributable to the economic crisis in the USA, overall and by employment status.
Methods
The analysis is based on repeated cross-sectional data from the BRFSS survey for 2005 to 2010.26 Disaggregate data were obtained online from the website of the Centers for Disease Control and Prevention (CDC; http://www.cdc.gov/brfss), where a detailed description of the methods and questionnaires is available.26 ,27
The BRFSS is a large state-based, random-digit-dialled telephone survey of non-institutionalised US population aged ≥18 years annually administered since 1984 by the CDC. Between 2005 and 2010, data were collected monthly in all 50 states, the District of Columbia, Puerto Rico and the US Virgin Islands. With reference to the variables used in the present analyses, the BRFSS questionnaire did not change over the period 2005–2010.27 Besides month of interview and statistical weights, information on sociodemographic characteristics, including age, sex, state of residence, race/ethnic group, education, marital status and employment status was retrieved. For the present analyses, employment status was categorised into five groups: (i) employed (‘employed for wages’ and ‘self-employed’), (ii) unemployed (‘out of work for more than 1 year’ and ‘out of work for less than 1 year’), (iii) ‘unpaid/unable to work’ (‘a homemaker’ and ‘unable to work’), (iv) students and (v) retired. Based on questions related to smoking behaviours, smoking status (current vs non-smokers) was obtained. Current smokers were defined as individuals who (i) responded that they had smoked more than 100 cigarettes in their lifetime; and (ii) responded that they smoke every day or some days. Statistical weights, ensuring representativeness of the samples of the overall US adult population, were used in all the analyses.
Joinpoint analysis
To identify possible significant changes in the trends of the monthly smoking prevalence in the US between January 2005 and December 2010, we carried out joinpoint regression analyses, overall and by sex and employment status, using the software provided by the Surveillance Research Program of the US National Cancer Institute.28 The aim of the joinpoint analysis is to identify possible points where a statistically significant change in the linear slope of the trend is detected over the study period.29 ,30 The best fitting points, called ‘joinpoints’, are chosen where the rate changes significantly. To derive monthly US smoking prevalences, we considered the entire sample of the participants of the six BRFSS studies conducted between 2005 and 2010 with available information on smoking, sex and employment status. From the monthly percentage changes we derived the annual percentage change (APC).
Standardised smoking prevalence ratio
In order to assess the effects of the economic crisis on US smoking prevalence, overall and by employment status, we employed a non-parametric analysis using data from the BRFSS surveys conducted in 2005, 2006, 2007, 2009 and 2010, distinguishing between the pre-crisis (2005–2007) and the post-crisis (2009–2010) samples. We excluded from the analyses the BRFSS survey of 2008, and all the subjects with missing values in at least one of the variables of interest (smoking status, sex, age, education, marital status, race and employment status). The analysis sample was 1 981 607 total participants, 1 122 424 before (2005–2007) and 859 183 after the financial crisis (2009–2010). The effects of the economic crisis on smoking prevalence cannot simply be assessed by comparing the pre-crisis smoking prevalence rates with post-crisis ones. We need to take into account (i) the change in individual characteristics over the two periods; and (ii) the pre-crisis time trend of smoking.
In order to control for the possible changes in socioeconomic characteristics (i), we used an indirect non-parametric standardisation, given stratum-specific smoking prevalence rates from the overall population in the pre-crisis period (used as the reference population). A total of 448 strata, resulting from a combination of the different demographic compositions including sex (2 categories), age (7 categories), education (4 categories), race (4 categories) and marital status (2 categories), were used for the standardisation.
To control for the pre-crisis time trend (ii), once we verified that time trends for smoking prevalence do not change significantly and that a linear trend is the best approximation of the prevalence trend within each group, we projected pre-crisis trends for each employment status in order to build group-specific expected values for the post-crisis prevalence ratios. Thus, the standardised smoking prevalence rates for the 2009–2010 population (post-crisis sample) were further controlled by the sex-specific and employment-status-specific smoking prevalence trends observed during the period from January 2005 to December 2007.
The expected smoking prevalence was therefore obtained after indirect standardisation for sociodemographic characteristics and, for the period 2009–2010, taking into account the sex-specific and employment-group-specific secular trends of 2005–2007 smoking prevalence. The standardised smoking prevalence rates, after allowance for the sex-specific and employment-status-specific smoking prevalence trends, represent the expected smoking prevalence rates in the post-crisis period (2009–2010). The standardised smoking prevalence ratio (SSPR) represents the ratio between the observed and the expected smoking prevalence. Values greater than 1 indicate the smoking prevalence among the study population is higher than that of the general adult population of the pre-crisis period, whereas values less than 1 indicate a lower prevalence.
Main analysis
The main objective of this study was to measure the impact of the crisis on the change in the number of smokers. For this purpose, we extend the prevalence values obtained from the BRFSS to calculate the number of smokers in the general US adult population, using data for population size obtained from the US Census Bureau.31 In order to establish how much of the change in the number of smokers in the post-crisis period is due to the economic crisis, one has to consider that the number of smokers would have changed even without the crisis, given the variation in the number of people and the natural trends of smoking prevalence within each employment status.
To identify the impact of the crisis, we followed a two-step procedure. First, we broke down the change in the number of smokers into a population effect (change in the population distribution across employment statuses) and a prevalence effect (change in the within-group prevalence). Second, we further broke down these two elements into an expected (what would have happened if the status quo remains) and an unexpected change. The impact of the crisis was then estimated as the change in the number of smokers that was not expected by simply looking at the pre-crisis population and prevalence patterns as described below: (see online supplementary appendix for a calculation method).
-
Change due to variation in the distribution of population: this part measures the change in the number of smokers that would follow if people within each employment status continued smoking as in the pre-crisis period. This change is further broken down in two parts:
-
Expected: the number of smokers attributable simply to a demographic change of the US population between the pre-crisis and the post-crisis periods. The post-crisis number of US citizens is allocated in different employment statuses according to their pre-crisis distribution. The pre-crisis group-specific prevalence is then applied.
-
Unexpected: the difference between the observed change in the number of smokers due to population change and A.
-
-
Change due to variation in group-specific smoking prevalence: this part measures the change in the number of smokers following the change in the group-specific prevalence. It can be broken down as follows:
-
Expected: the change in the number of smokers attributable to the pre-crisis prevalence taking into account the secular trend (C1) and the change in sociodemographic characteristics of the population in each employment status (C2).
-
Unexpected: the difference between the observed change in the number of smokers due to prevalence change and C.
-
We assume that the sum of parts B and D—the parts left unexplained—represents the change in the number of smokers attributable to the economic crisis.
Results
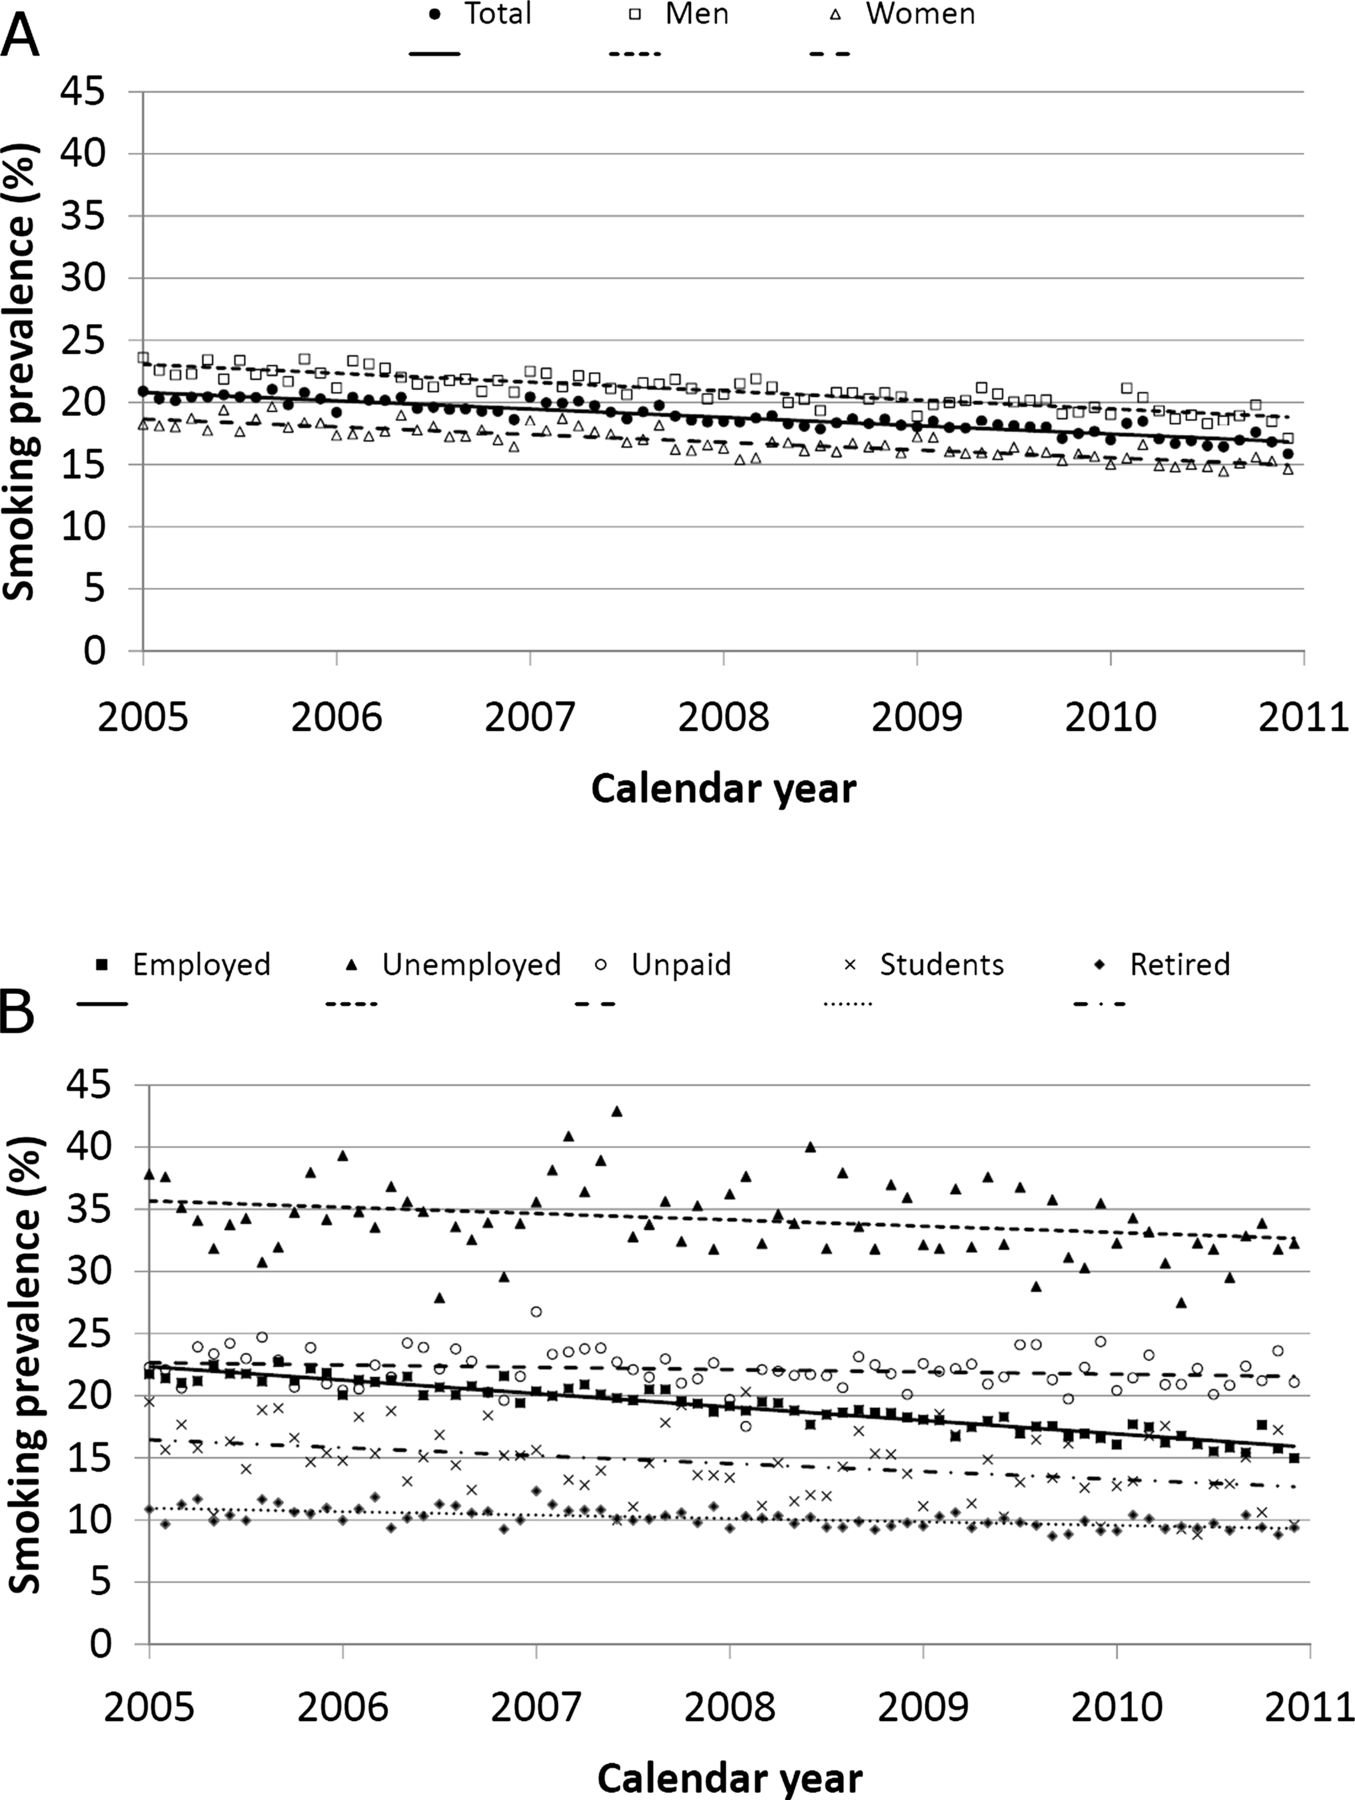
Over the period 2005–2010 smoking prevalences for US adults had been declining overall and for both sexes. Based on joinpoint regression analysis, we identified no statistically significant changes in trends: the best slope was a linear trend for the whole period for the total population (absolute APC: −0.67%) and separately for men (APC: −0.72%) and women (APC: −0.62%). For the employed the trend was particularly steep (APC: −1.08%), while for the unemployed (APC: −0.51%), the unpaid/unable to work (APC: −0.19%), students (APC: −0.64%) and those in retirement (APC: −0.27%) the slopes are rather flat (figure 1).

US smoking prevalence trends overall and by sex (A), and by employment status (B): joinpoint analysis. Behavioural Risk Factor Surveillance System (BRFSS) 2005–2010.
Table 1 shows the distribution of the studied population according to their demographic and socioeconomic characteristics and smoking prevalence in 2005–2007 (pre-crisis period) and 2009–2010 (post-crisis period). The distribution of the sample population by age, sex, race, marital status and education did not vary substantially between the two periods. Notably, the proportion of those in employment declined from 61.2% in 2005–2007 to 57.1% in 2009–2010. Simultaneously, the proportion of unemployed individuals rose substantially from 5.0% in 2005–2007 to 8.6% in 2009–2010 (p<0.001). Smoking prevalence also declined significantly from 19.8% in 2005–2007 to 17.5% in 2009–2010 (p<0.001).
Percentage distribution of 1 981 607 US subjects according to selected sociodemographic characteristics and smoking status. BRFSS 2005–2007, 2009–2010
Table 2 shows the distribution of observed and expected smoking prevalences, and the SSPR for the pre-crisis (2005–2007) and post-crisis (2009–2010) periods, overall and by sex, according to employment status. Overall smoking prevalence declined from 19.8% (22.0% in men and 17.8% in women) in 2005–2007 to 17.5% (19.5% in men and 15.7% in women) in 2009–2010. The expected smoking prevalence in 2009–2010, after accounting for sociodemographic characteristics and pre-crisis trend in smoking prevalence, was 17.1% (19.1% in men and 15.1% in women). Therefore, in the post-crisis period the observed smoking prevalence was higher than the expected one overall (SSPR=1.026), in men (SSPR=1.019) and in women (SSPR=1.034). The observed smoking prevalence rates vary considerably by employment status in the pre-crisis and post-crisis periods. For those who were employed, SSPR was 0.982 in the pre-crisis and 0.997 in the post-crisis period, indicating that employed individuals smoked slightly less than the overall population. In contrast, the unemployed had a substantially higher observed smoking prevalence than the average in the pre-crisis (34.9% vs 26.3%; SSPR=1.325) and the post-crisis periods (32.6% vs 26.9%; SSPR=1.213), despite the fact that this category was suddenly (due to the crisis) populated by a substantial number of formerly employed people, who on average were less likely to smoke. For those who are unpaid/unable to work, SSPR was 1.077 in the pre-crisis and 1.061 in the post-crisis period. The corresponding SSPR estimates for students were 0.673 and 0.639, and those for retired individuals were 0.964 and 0.935, in the pre-crisis and post-crisis periods, respectively.
Distribution of observed and expected US SP estimates according to calendar period: pre-crisis (2005–2007) versus post-crisis (2009–2010), overall and by sex. Corresponding SSPR. BRFSS, 2005–2007, 2009–2010
Table 3 shows the absolute number of smokers (in thousands) for the overall US population by employment status. The reduction in the total number of smokers between pre-crisis and post-crisis periods (3.49 million smokers less) was largely due to the decline in the number of smokers among the employed individuals in the post-crisis period (5.98 million smokers less), partially counterbalanced by the increase in the number of smokers among the unemployed (2.68 million smokers more). The large decline observed in employed individuals is the result of (i) a reduction of 0.85 million smokers due to the change in population (although projecting the pre-crisis employment rates we would expect 1.1 million smokers more), plus (ii) the change in smoking prevalence, resulting in 5.13 million smokers less (3.21 million less due to the employed-specific secular trend, 2.28 million less due to changes in the sociodemographic characteristics of the employed and 0.36 million more due to unexpected change). The economic crisis was therefore responsible for a reduction of 1.68 million smokers among US employed individuals. Those who were unemployed showed an increase in the number of smokers by 2.68 million smokers, largely due to an unexpected increase in the number of individuals entering unemployment in the post-crisis period (3.26 million smokers more). At the same time, the change in smoking prevalence contributed only slightly to the change in the total number of smokers among the unemployed (0.59 million smokers less). For other employment statuses, we observed only a moderate change in the number of smokers.
US adult smokers (in thousands) in the pre-crisis (2005–2007) and post-crisis (2009–2010) periods, overall and by employment status. BRFSS, 2005–2007, 2009–2010
Overall, the 3.49 million smokers less are the result of an increase in the number of smokers due to the change in population (3.12 million smokers more, of whom 1.28 million unexpected and due to the economic crisis), and a decrease in smoking prevalence (6.61 million smokers less, of whom only 0.66 million due to the economic crisis). Therefore, in the US, the economic crisis accounted for 0.62 million smokers more (ie, 1.5% of total cigarette smokers in 2009–2010).
Discussion
This is the first original study quantifying the effects of the 2007–2008 economic crisis on smoking prevalence. Results show that US smoking prevalence declined from 19.8% in the pre-crisis (2005–2007) to 17.5% in the post-crisis period (2009–2010), corresponding to a fall in the number of adult smokers by 3.5 million. However, once (i) the demographic increase of the US population, (ii) the pre-crisis secular trends in smoking prevalence and (iii) the change in the distribution of population by sociodemographic characteristics are taken into account, we would expect a fall in the number of US smokers by approximately 4.1 million adults. The economic crisis therefore appears to have increased the number of smokers by 0.6 million in the overall US adult population.
Three key issues are worth discussing. First, most of the impact of the crisis comes from the shift of a substantial part of the US population from employed to unemployed status. Specifically, the number of smokers lost due to the reduction in the number of employed individuals (around 2 million smokers less) was counterbalanced by the increase in the number of smokers among the unemployed (around 3 million more). Clearly, any study that does not take into account the change in the population distribution across different employment statuses cannot entirely capture the impact of the economic crisis on the smoking behaviours of a population. This might explain why our findings are in contrast with the few previous studies suggesting a pro-cyclical relationship between economic downturns and smoking prevalence.7 ,13 ,19 Moreover, the fact that the economic crisis is responsible for massive involuntary job losses suggests that the relationships found between routine economic cycles and various health outcomes might not be the same under severe economic conditions.3–5
The second issue is related to the smoking prevalence of the ‘new’ unemployed (people likely to have lost their job due to the crisis). In line with all the previous literature,32 ,33 smoking prevalence among unemployed individuals is about 30% higher than the average population. Even considering the declining trend in smoking prevalence, the exceptionally high smoking prevalence among the unemployed stands out in the post crisis period. Our measure of expected prevalence is based on a precise assumption regarding the smoking prevalence of the many new unemployed that lost their jobs due to the crisis: the new unemployed are assumed to be as likely to smoke as the pre-crisis unemployed. Most of the change in the unemployed prevalence after the crisis is then classified as ‘expected’, which in effect reduces the impact of the crisis (alternatively, we could have assumed that the newly unemployed are people who moved out from the average population with average SPRs). Hence, our analysis took a conservative approach and our estimation should be considered as a lower bound of the impact of the crisis. This confirms even more strongly the counter-cyclical nature of smoking during the crisis.
Why are unemployed individuals (old and new) much more likely to be smokers? Extant literature on the issue remains inconclusive33 On the one hand, it is likely that unemployment itself is a significant determinant of smoking behaviour, mainly due to the fact that job loss is a stressful life event17 ,34–36 and that individuals may choose to cope with this stress by lighting up a cigarette or giving up their attempt for smoking cessation32 ,35 ,37–39 or relapsing after experiencing an involuntary job loss.34 Accordingly, even though unemployment reduces income and may increase intention to quit smoking, the rate of cessation failure is higher among those with financial stress.40–42 For newly unemployed individuals it is also possible that the additional time not working indoors leads to fewer constraints on smoking uptake and intensity, and consequently less pressure to quit. On the other hand, smoking behaviour might be a cause, more than a consequence, of the change in employment status, for example because employers more frequently hire non-smokers or fire current smokers more frequently.43–47 Accordingly, a small but increasing number of employers have recently established policies of no longer hiring tobacco users in the US.47 However, during such a massive economic crisis, this second causal pattern might have only a marginal role.
Finally, our findings are of importance from a public health perspective. Since the economic cycle does not seem to have played such an important role in the reduction of smoking prevalence, the reassuring message that in bad economic periods people can at least benefit from low smoking rates should be rejected. On the contrary, our findings implicitly underline the importance of the successful anti-smoking campaigns implemented in the USA.48 ,49 Sustaining anti-tobacco programmes thus remains of primary importance in reducing smoking prevalence in the USA. In this sense, confirming that employment status is an important risk factor for smoking, our results suggest that unemployed individuals should be considered a target population for tobacco control strategies, particularly during economic downturns when a substantial proportion of the population lose their jobs involuntarily. Smoking cessation initiatives should be promoted in this specific population subgroup, where there is evidence that compliance with smoking cessation programmes is more likely.50
Possible limitations of the present study include those inherent to the repeated cross-sectional study design. Longitudinal panel data are still needed to understand the causal pathway connecting post-crisis employment status and smoking behaviour. Moreover, it is possible that the economic crisis modified attitudes towards smoking, such as increased social acceptability of smoking. Unfortunately, we cannot analyse this issue in our data by considering the possible temporal changes in under-reporting of tobacco use.51 Strengths include the extremely large sample size of the BRFSS, which allowed us to employ non-parametric methods to derive the expected smoking prevalence rates, taking into account the combination of a number of sociodemographic characteristics.
In conclusion, the 2008 economic crisis in the USA had a counter-cyclical effect on smoking among unemployed individuals, which was not totally counter-balanced by the pro-cyclical relationship observed among employed individuals. Using indirect standardisation methods and taking into account the demographic changes and the previous secular trends in smoking prevalence, we are able to exclude an overall reduction in smoking prevalence or in the number of smokers due to the economic crisis.
What is already known on this subject
-
Most of the few studies analysing the relation between economic fluctuations and smoking prevalence found a pro-cyclical relationship (ie, periods of expanding economic growth results in increased smoking prevalence), suggesting favourable smoking patterns during hard times.
-
None of those studies took advantage of a severe economic shock.
What this paper adds
-
By considering the change in population composition and smoking prevalence for each employment status, the key contribution of this study is to disentangle how the change in the number of smokers with relation to the economic conditions is derived.
-
Using a large US dataset of repeated cross-sectional surveys, we found that the 2008 fiscal crisis had, if anything, a counter-cyclical effect on smoking (ie, the economic crisis results in decreased smoking behaviour) in the general population.
-
This relationship is substantial among the unemployed, a specific subgroup which maintains an extremely high smoking prevalence during the crisis, and which should be considered the target population for smoking cessation interventions, particularly in hard economic times.
Acknowledgments
The authors would like to thank Dr Cristina Bosetti for her valuable help in the implementation of the joinpoint analysis.
References
Supplementary materials
Supplementary Data
This web only file has been produced by the BMJ Publishing Group from an electronic file supplied by the author(s) and has not been edited for content.
Files in this Data Supplement:
- Data supplement 1 - Online supplement
Footnotes
-
Collaborators Cristina Bosetti.
-
Contributors SGa and SGh had the original idea for the study; RM conducted extensive literature review of the subject; SGa and RM retrieved the data; all authors wrote the article; SGh and SGa conducted the statistical analysis; all authors gave substantial contributions to conception, design and interpretation of data, and approved the final version of the manuscript.
-
Funding The work of SGa is partially supported by the Italian Association for Research on Cancer (AIRC; grant number 10068).
-
Competing interests None.
-
Provenance and peer review Not commissioned; externally peer reviewed.