Article Text

Abstract
Objective This study monitored the advertised price of the most prominently promoted and the cheapest single packs of cigarettes in Australian retail outlets before and after the implementation of plain packaging.
Methods A panel of 421 outlets in four large Australian cities was visited monthly from May 2012 to August 2013 and the brand, pack size and price of the most-prominently listed and lowest-priced single cigarette pack were recorded from each store's tobacco price board. Changes in the inflation-adjusted stick price were examined using linear mixed models, controlling for fixed effects of city, store type, area socioeconomic status and random effects of time. The adjusted stick price was also examined over time by tobacco manufacturer and pack size.
Results The inflation-adjusted stick price of the most-prominently advertised single packs was significantly higher than in May–July 2012 from August–October 2012 for mainstream and premium brands and from February–April 2013 for value brands. Adjusted average stick prices of lowest-priced packs in August 2013 were $0.02 (95% CI $0.02 to $0.03, p<0.001) higher than in May–July 2012 ($Aug13). A large real increase in stick price was seen in February–April 2013 across all major manufacturers, market segments and pack size categories.
Discussion The price of cigarettes most prominently promoted on price boards did not decrease in the months following implementation of Australia's plain packaging legislation. Retail prices continued to increase above the level resulting from automatic indexation of excise/customs duty even at the lowest-priced end of the Australian market.
- Price
- Packaging and Labelling
- Public policy
This is an Open Access article distributed in accordance with the Creative Commons Attribution Non Commercial (CC BY-NC 4.0) license, which permits others to distribute, remix, adapt, build upon this work non-commercially, and license their derivative works on different terms, provided the original work is properly cited and the use is non-commercial. See: http://creativecommons.org/licenses/by-nc/4.0/
Statistics from Altmetric.com
Introduction
Australia's plain packaging legislation was met with fierce opposition from the tobacco industry.1 Among many criticisms, tobacco companies claimed that the removal of design features from tobacco packaging would force brands to compete only on the basis of cost and that this ‘commoditisation’ of tobacco products would lead to dramatic drops in prices, resulting in an increase in consumption.2–4 It was also claimed that standardised packaging would lead to an influx of counterfeit and other contraband tobacco, also putting downward pressure on prices.2–4 While industry reports based on studies of discarded packs claim that use of illicit tobacco has increased since the introduction of plain packaging legislation,5 ,6 independent audits of retail outlets7 and surveys of consumers8 find no evidence of this anticipated trend having occurred. Also in contrast to industry predictions, the volume of tobacco products on which excise and customs duty has been paid in the calendar year 2013 was 3.4% lower than in 2012 which included 3 months during which plain packs were already on the market in Australia.9 The reported number of cigarettes smoked each day by current smokers was 15% lower in 2013 than it was in 2010.10 The current study is one of several by our group in this supplement11–13 aiming to investigate what happened to prices of tobacco products after the introduction of plain packaging in Australia.
Cigarette prices can be conceptualised and measured in several different ways.14 Recommended retail prices (RRPs) published in trade magazines provide a comprehensive picture of recommended prices of almost all products sold by all major manufacturers and most importers. However, RRPs may not reflect tobacco prices promoted in real-world settings, can be slow to document changes in product offerings and do not include some of the brands imported by smaller distributors. Actual prices paid for tobacco products can be estimated from self-report surveys, but they reflect the outcome of consumer purchasing choices—brand, pack size, place of purchase; they do not necessarily directly reveal industry pricing and other marketing strategies. Observational studies of tobacco retailers, on the other hand, provide a means of monitoring real-world advertised tobacco prices.
Scollo et al15 monitored changes in tobacco prices during Australia's National Tobacco Campaign from 1997 to 2000, a period which coincided with changes to tobacco taxation. RRPs, the self-reported price paid and an observational retail monitoring study showed similar magnitudes of increase in price for all monitored cigarette brands, although RRPs were consistently higher than the self-reported price paid and advertised retail prices (reflecting price discounting strategies). A more recent observational study of small mixed-business retailers in close proximity to secondary schools in Melbourne, Australia showed that the advertised price of popular cigarette brands was lower than the RRP in more than 10% of stores, and that discounting was more common in areas of low socioeconomic status (SES).16 Another audit of more than 1500 tobacco retailers across the state of New South Wales found that the advertised price of the most popular cigarette pack in Australia—Winfield 25s—varied by store type, area SES and with the proportion of children residing in the area, but did not differ between regional and metropolitan areas.17 A similar study in south-east Queensland found lower prices for leading mainstream and value brands in low-SES suburbs.18
Opponents of the plain packaging legislation had argued that premium brands would be most severely affected by plain packaging as it is these products that rely most heavily on package design to communicate prestige and quality.19 Examination of retailer association recommended price lists, however, revealed that RRPs of all tobacco products produced by the major manufacturers/importers increased above inflation in the 12 months after plain packaging was introduced in Australia, despite there being no increases in excise/customs duty beyond those required by automatic 6-monthly indexation.11 This raises the question of what happened to the real-world prices in retail outlets following the introduction of the legislation.
The price board—a list of tobacco products and prices on display at the point of sale—is one of the few ways in which companies can inform Australian smokers of the prices of tobacco products. Restrictions on the size and contents of price boards differ across the states and territories in Australia with Western Australia allowing very limited information at the point of sale, and Queensland banning price boards altogether.20 Previous research following the implementation of bans of cigarette displays has demonstrated the strategic use of boards to promote particular products, with space at the top more likely to be occupied by premium brands which provide high margins to manufacturers and retailers.21 If prices were ‘softening’ among premium brands (declining or increasing at lower rates than prices across the market as a whole), this ought to be apparent among the most prominently promoted premium brand. The lowest-priced brand on the board represents the other extreme—the pack with the lowest purchase price of which consumers are likely to be aware.
Cigarette packs in Australia have typically contained multiples of five sticks, ranging from 20 to 50 cigarettes per single pack.14 However, in the lead-in period to plain packaging, a variety of new pack sizes—21s, 22s, 23s, 26s—were introduced predominantly among value brands. These packs with ‘bonus’ cigarettes tended to have the same or lower RRPs than packs from the same brand in the equivalent 20s or 25s size.11 ,22 The introductory prices for these products were therefore lower per stick than the price per stick of other value brands. It might be expected that the lower prices of these new packs with bonus sticks would have exerted downward pressure on the prices of other value brands of similar pack size.
The current study aimed to monitor before and after the implementation of plain packaging the real-world advertised price of the most prominently promoted and the lowest priced single packs of cigarettes in retail outlets in four capital cities across Australia where price boards are still permitted.
Method
Design
This study was a repeated-measures observational design. A team of trained fieldworkers visited a panel of tobacco retailers monthly from May 2012—7 months prior to the 1 December 2012 implementation of plain packaging—to August 2013, 9 months after implementation. Stores that closed during the study period were not replaced. Fieldworkers rotated across areas within cities to avoid visiting a given store in consecutive months.
Store sample and selection
In May 2012, stores were selected from 16 sampling areas within Australia's two largest cities—Melbourne and Sydney—and eight areas in each of the cities of Adelaide and Perth. Sampling areas were selected by stratifying all postcodes within the metropolitan boundaries of each city into four SES categories using the Socioeconomic Indices for Areas 2011 Index of Relative Disadvantage,23 then randomly selecting equal numbers of postcodes from each SES category in each city. Each of these postcodes formed the primary postcode of that sampling area. For efficiency during store selection, a nearby secondary postcode was selected for each area, matched by SES category. Therefore, each sampling area was comprised of two postcodes.
Maps of each sampling area identifying potentially useful shopping strips and centres were created. Fieldworkers were instructed to visit the largest shopping strip in the primary postcode and, using a rigorous set of walking rules, sample all potentially eligible stores until either their store quotas were met or they had sampled the entire shopping strip. In the latter situation, the second largest shopping area in the primary postcode was then sampled, and so on. If all shopping strips were exhausted in the primary postcode, the sampling procedure was continued in the secondary postcode. Potentially eligible stores were:
-
Supermarkets: large grocery chains;
-
Convenience stores: small independent supermarkets and branded chain convenience stores with a broad range of products and extended opening hours;
-
Small mixed-businesses: milk bars (Melbourne), delis (Adelaide and Perth), corner stores and general stores;
-
Petrol stations: any store that sold petrol, including those branded as convenience stores or supermarket chains;
-
Newsagents/lottery outlets: stores that sold newspapers, magazines and stationery as their primary business and/or lottery tickets and services.
Quotas were set at nine stores per area, including one of each store type in every area wherever possible. We visited a total of 796 stores, of which a total of 375 (47.1%) did not meet the eligibility criteria in that they did not sell tobacco (n=129, 16.2%), had no visible price board (n=225, 28.3%), or displayed fewer than three single cigarette pack prices (n=21, 2.6%), leaving 421 stores in the sample.
Data collection procedure
This study was part of a larger exercise that aimed to collect information about transaction times24 ,25 and willingness to sell illicit tobacco,7 which necessitated unobtrusive data collection. Each month, fieldworkers entered the stores under the guise of a regular customer, and discretely observed the contents of the price board. The brand name, pack size and price of the most-prominent and lowest-priced single cigarette packs were noted. The most-prominent single pack was defined as that listed highest on the price board. A national fieldwork agency experienced in store research undertook data collection. Fieldworkers were trained to use effective observational techniques developed in pilot studies and using mocked-up price board examples.
Statistical analysis
Data management and analyses used Stata V.12.1.26 To account for variability in the size of the observed packs, stick price was calculated by dividing the advertised pack price by the number of sticks in each pack.
The study period was aggregated into six phases which took into account both the stage of implementation of plain packaging and the dates on which tobacco excise/customs duty was indexed (on 1 February and 1 August each year, based on changes in the Consumer Price Index (CPI) over the previous December to June or June to December 6-month period). This ‘phase’ variable was created by combining all months prior to the 1 August 2012 CPI adjustment (May–July 2012), then August–October 2012 (when only small numbers of plain packs had started to appear in shops), November 2012–January 2013 (early after implementation of plain packaging but prior to indexation on 1 February 2013), February–April 2013 and May–July 2013 (before the 1 August CPI-related increase in excise/customs duty). August 2013 represented the final phase. The phases are referred to as ‘plain packaging (PP)/CPI phase’ throughout. Prices per stick were adjusted to take into account changes in the CPI. These were calculated using changes in Index figures between December 2011 and June 2012, June 2012 and December 2012, and December 2012 and June 2013, so that in effect the analysis examined changes over time above the legislated CPI-linked increases in excise/customs duty that went into effect in Australia on 1 August 2012, 1 February 2013, and 1 August 2013.
Linear mixed models using maximum likelihood estimation were performed to examine the effect of time on inflation-adjusted stick price, controlling for fixed effects of store type, city and SES category. As the price observations were repeated every month in the same panel of stores, random intercepts for stores were included in all models to adjust for correlations between observations within each venue. A random effect for time was also included in order to control for the possibility that prices changed more in some stores than others over the study period. Likelihood ratio tests confirmed that these inclusions significantly improved model fit. The effect of time was explored in two ways: as a linear function of month, and as a stepwise function of phase. Comparison of Akaike information criterion values showed that the latter was the better fitting model. A systematic examination of various model specifications showed that an unstructured covariance matrix for the random effect provided the best-fitting model. Finally, remaining within-store residuals were modelled independently by store type to further improve model fit.
These specifications were the best-fitting models for the most-prominent and lowest-priced packs, and were used for all analyses. Wald χ2 postestimation tests were performed to examine main fixed effects of categorical covariates. The most-prominent observations were coded by market segment (value, mainstream and premium) using definitions from Retail World27 trade magazine. The stick prices of any brands not listed in Retail World were compared to those listed and coded accordingly. The final models were then repeated including only brands from each tobacco manufacturer (British American Tobacco Australia (BATA), Imperial Tobacco and Philip Morris separately; brands from all other small manufacturers combined). Similarly, separate models were fitted for different pack sizes—packs of 20 sticks; 21s, 22s and 23s combined; and 25s, 26s and 30s combined. From all models, average stick prices were calculated adjusting for fixed and random effects for each PP/CPI phase.
Results
Store characteristics
Table 1 shows that supermarkets and petrol stations were the most common store types, while small mixed businesses were least common. More than two-thirds of the stores were located in Melbourne and Sydney and there were more stores in low and least disadvantaged (higher SES) areas than areas of most and moderate disadvantage (lower SES). Importantly, only marginal differences between the most-prominent and lowest-priced observations and the original sample distribution were found; that is, no one store type, city or SES category tended to become ineligible over time more than any others.
Characteristics of the store sample, and distribution of price observations by store type, city and area SES
In the 6736 store visits over the 16 months, the store was closed or no longer sold tobacco on 114 (1.7%) occasions. Prices were no longer displayed in a further 624 store visits (9.3%). The incidence of these factors increased gradually over the study period. In the remaining 5998 store visits, price boards were alphabetised by brand on only 8.5% of occasions, and this did not differ significantly by month (χ2=16.15, p=0.37). Alphabetised boards were more common in supermarkets (13.1%) and petrol stations (10.2%), while each of the other store types had alphabetised boards on <5% of store visits.
Eligible observations of the most-prominent single pack were made on 5473 (91.2%) occasions, and eligible observations of the lowest-priced pack were made in 5859 (97.7%) store visits. Nearly all exclusions of the most-prominent pack price were because a multibuy product (two or three packs bundled together) was inadvertently recorded as it was listed by the total number of cigarettes on offer, for example, ‘Winfield 50s’, and therefore appeared to be a single cigarette pack. These were excluded given the focus of this study on single packs as opposed to cartons or multibuys.
In the majority of months, five or fewer lowest-priced records were deemed ineligible (eg, where the fieldworker mistakenly recorded a non-existent brand/pack size such as ‘Brandon 20s’). A large number of records were excluded in December 2012 (n=74) and January 2013 (n=21) because they were of packs that did not conform to the minimum pack size dimension specified in the plain packaging legislation—JPS Nano 20s and Pall Mall Slims 20s—and were therefore ineligible for legal sale after 1 December 2012. Prior to December 2012, JPS Nano 20s were one of the most commonly observed lowest-priced products on price boards; both brands were replaced with packs of 23s on the introduction of plain packaging.
Advertised cigarette prices: most-prominent single cigarette packs
Of the 5473 most-prominent packs observed, two-thirds (64.6%) were premium brands, while 20.7% were value brands and 14.7% were mainstream.
Figure 1 and table 2 show real increases in the stick prices of the most prominently listed value, mainstream and premium packs over the study period (all p<0.001). The adjusted average stick prices of value brands remained stable until the February –April 2013 phase, where a $0.02 (95% CI $0.01 to $0.03, p<0.001) increase was observed relative to phase one. Prices decreased slightly in the latter two phases, but remained significantly higher than in May–July 2012 (both p<0.05). Mainstream brands’ stick prices increased in every phase, and prices in all phases were significantly higher in real terms than in May–July 2012 (all at least p<0.01), again with a large relative increase in the February–April 2013 phase ($0.04; 95% CI $0.03 to $0.05, p<0.001). Among premium brands, stick prices in all phases were significantly higher than in May–July 2012 (all p<0.001), with a substantial increase in February–April 2013 relative to the first phase ($0.04; 95% CI $0.03 to $0.04, p<0.001).
Marginal mean inflation-adjusted stick prices ($Aug2013) by PP/CPI phase, store type, city and SES category, estimated using linear mixed models, with post-estimation Wald tests for main effects and within-group comparisons

Estimated marginal means of inflation-adjusted stick prices ($Aug2013) of the most prominently advertised value, mainstream and premium single packs by PP/CPI phase (with 95% CIs), adjusted for store type, city and area socioeconomic status.
Given the differences in stick prices between market segments, and the high proportion of premium brands among the most-prominent single packs, changes in the inflation-adjusted stick price over the study phases were examined among just premium brands for each of the three major Australian tobacco manufacturers (BATA: n=2393, Imperial Tobacco: n=350, and Philip Morris: n=789). Figure 2 and table A1 (see online supplementary appendix) show significant changes in the inflation-adjusted stick price among premium brands from all manufacturers over the study period (all p<0.001).

Estimated marginal means of inflation-adjusted stick prices ($Aug2013) of the most prominently advertised premium single packs by manufacturer and PP/CPI phase (with 95% CIs), adjusted for store type, city and area socioeconomic status.
Among BATA and Imperial Tobacco premium brands, only minor changes were observed in the first three phases before large and significant increases were seen in February–April 2013 relative to the first phase (BATA: $0.03, 95% CI $0.03 to $0.04, p<0.001; Imperial Tobacco: $0.03, 95% CI $0.02 to $0.04, p<0.001). Imperial Tobacco prices appeared to stabilise in the final phases, while BATA premium brands showed small increases in each phase, so that on August 2013 the inflation-adjusted stick price was $0.04 (95% CI $0.04 to $0.05, p<0.001) higher than in May–July 2012. Philip Morris premium brands also showed minor increases in the first phases followed by a large increase in stick price compared to May–July 2012 ($0.04, 95% CI $0.03 to $0.05, p<0.001), and then continued to increase by approximately $0.01 and $0.02 in the final two phases, respectively.
Advertised cigarette prices: lowest priced cigarette packs
Of the 5859 lowest-priced packs, 93.8% were value brands and 83.2% were packs of 20 cigarettes. Table 2 and figure 3 show that inflation-adjusted stick prices of all observed lowest-priced packs significantly changed over the study period (p<0.001). Small but significant decreases (both p<0.05) were seen in August–October 2012 and November 2012–January 2013 compared to May–July 2012, while the inflation-adjusted price in February–April 2013 was $0.02 (95% CI $0.02 to $0.03, p<0.001) higher than in the first phase. The stick price then decreased slightly, again in real terms, but remained significantly higher in the final two phases compared to May–July 2012 (both p<0.001).
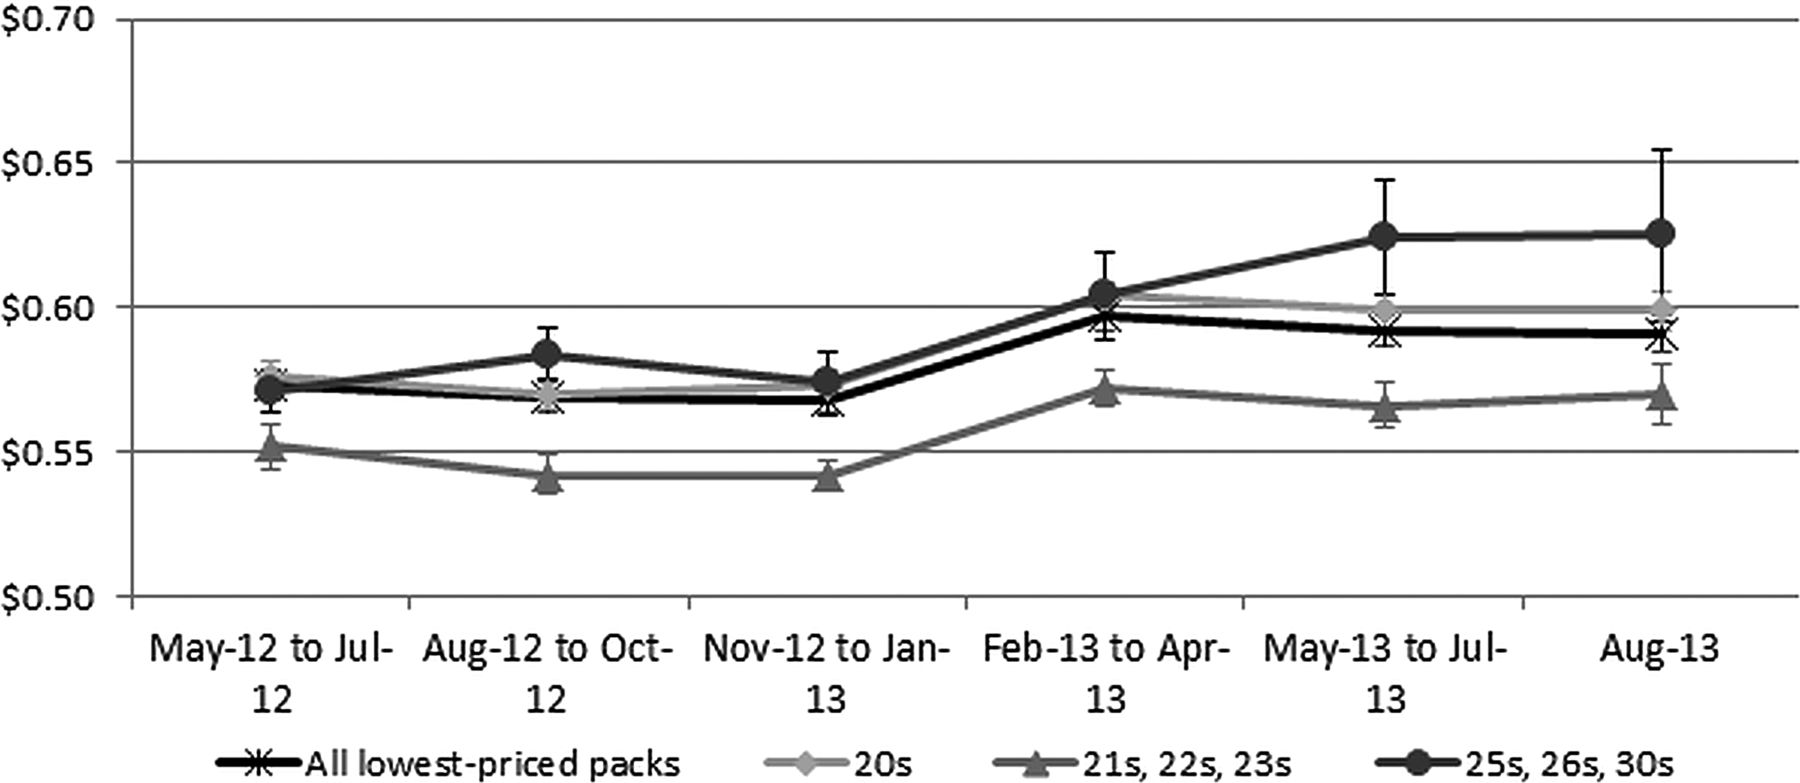
Estimated marginal means of inflation-adjusted stick prices ($Aug2013) of the lowest-priced advertised single packs, overall and by pack size category, by PP/CPI phase (with 95% CIs), adjusted for store type, city and area socioeconomic status.
After packs of 20s, 22s were the next most common pack size (7.8%), followed by 25s (5.7%), 23s (2.0%), 26s (1.3%), 21s (0.2%) and only two packs of 30s were ever recorded as the lowest-priced advertised pack (<0.1%). While the proportion of 20s remained relatively stable across the PP/CPI phases (minimum 79.8%; maximum 86.8%), the proportion of small novel pack sizes (21s, 22s and 23s) more than doubled from 7.1% to 15.3% and the proportion of 25s, 26s and 30s observed decreased substantially from 13.1% to 2.0% from the first to last phases. This is largely attributable to fewer packs of 25s observed as the lowest-priced advertised packs—26s and 30s were consistently rare across the study.
Figure 3 and table A2 (see online supplementary appendix) also show that packs of 20 cigarettes showed a small but significant decrease (p<0.01) in the inflation-adjusted stick price in August–October 2012, followed by a large increase of $0.03 (95% CI $0.02 to $0.03, p<0.001) in February–April 2013 relative to phase one. Following this increase, stick prices of 20s stabilised and remained significantly higher than at the start of the study period in the final two phases (both p<0.001). Packs of 21s, 22s and 23s showed an almost identical pattern, although the observed increase in February–April 2013 was smaller: $0.02 (95% CI $0.01 to $0.03, p<0.001). The inflation-adjusted stick price of these small novel packs decreased slightly in May–July 2013 but remained consistently higher than in May–July 2012 in the final phases (both p<0.05). Conversely, the stick price of 25s, 26s, and 30s showed a small but significant real increase in August–October 2012 ($0.01, 95% CI $0.01 to $0.02, p<0.01), before increasing in February–April 2013, relative to phase one, by a similar margin to the other pack sizes: $0.03 (95% CI $0.02 to $0.05, p<0.001), and again in the final phases to $0.05 (95% CI $0.02 to $0.08, p<0.01) above the May–July 2012 stick price.
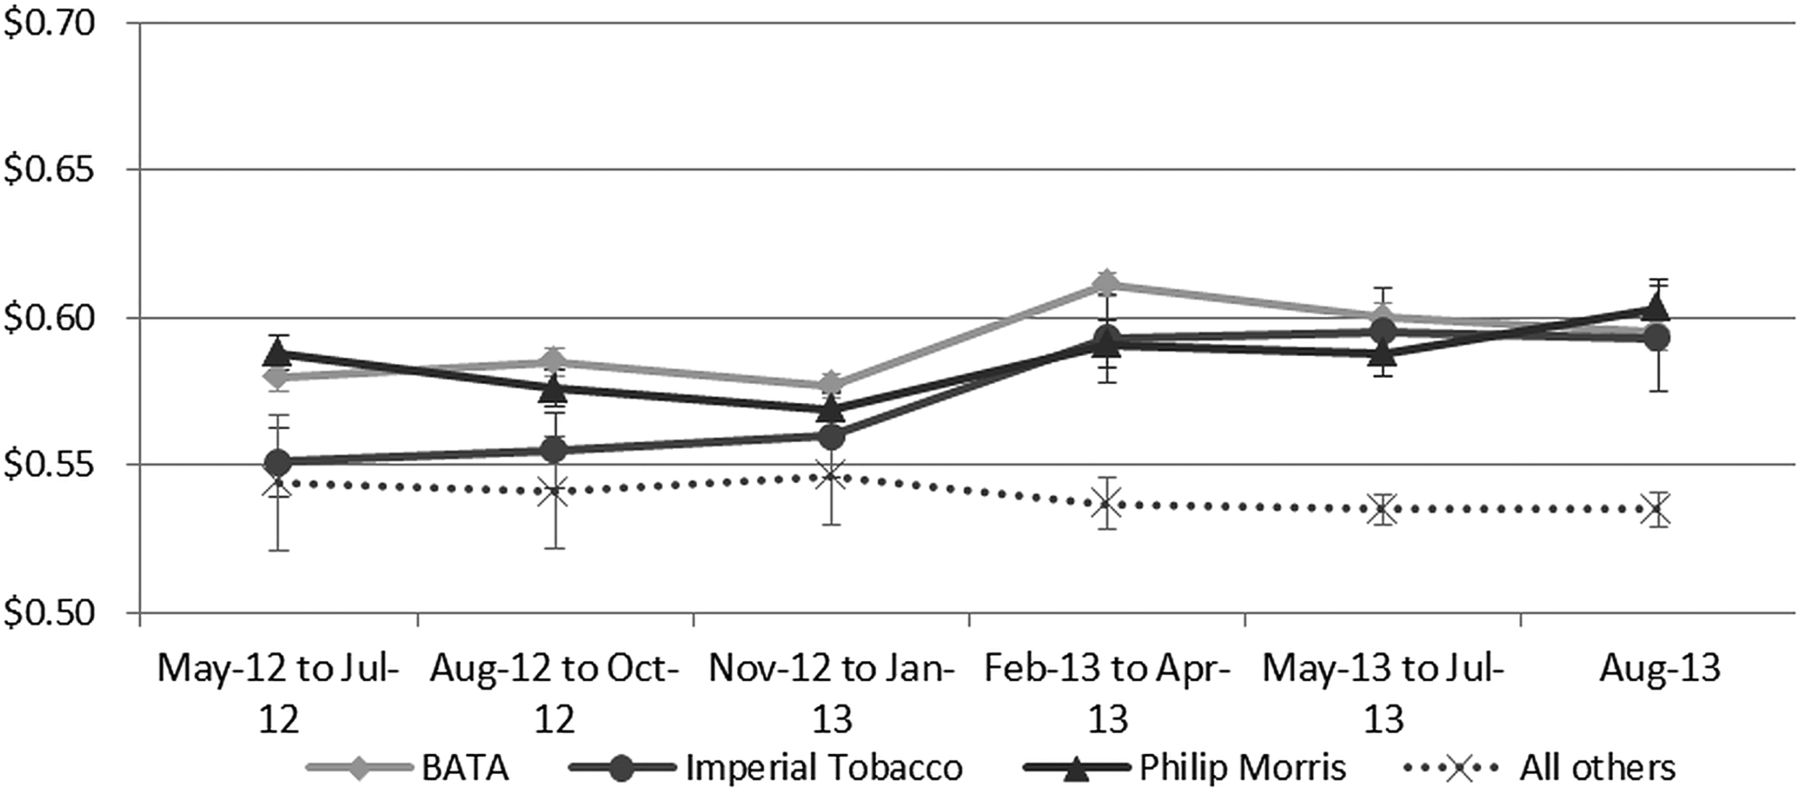
Each of the three largest manufacturers accounted for approximately one-third of the observed lowest-priced packs: BATA: 32.7%, Imperial Tobacco: 32.8%, Philip Morris: 31.6%. The remaining 2.9% of packs from other smaller manufacturers were aggregated. Figure 4 and table A2 (see online supplementary appendix) show that significant main effects of PP/CPI phase were found for the three largest manufacturers (all p<0.001), while the lowest-priced brands from ‘other’ manufacturers showed no change in the inflation-adjusted stick price over the study period. While the three major manufacturers each showed a slightly different pattern of change from phase to phase, the net result for all three was that a substantial real increase in the stick price was seen between November 2012–January 2013 and February–April 2013—$0.03 for BATA and Imperial Tobacco, and $0.02 for Philip Morris. Further, the inflation-adjusted stick price of each brand in August 2013 was significantly higher than in May–July 2012: BATA: $0.02 (95% CI $<0.01 to $0.03, p<0.05); Imperial Tobacco: $0.04 (95% CI $0.03 to $0.05, p<0.001); Philip Morris: $0.02 (95% CI $<0.01 to $0.03, p<0.01). The inflation-adjusted stick prices from the three largest manufacturers appeared to converge upwards over the study period (figure 4). There was a $0.04 per stick difference between the highest (Philip Morris) and lowest (Imperial Tobacco) stick prices in May–July 2012, compared to a $0.01 difference between the highest and lowest (still Philip Morris and Imperial Tobacco, respectively) at August 2013.

Estimated marginal means of inflation-adjusted stick prices ($Aug2013) of the lowest-priced advertised single packs by manufacturer, and by PP/CPI phase (with 95% CIs), adjusted for store type, city and area socioeconomic status.
Discussion
The stick price of single packs most prominently promoted on Australian price boards increased significantly in real terms following the introduction of plain packaging. Increases were particularly strong where the most prominently promoted single products were premium or mainstream brands. After small declines in the lead-up to plain packaging implementation, the prices per stick of the lowest-priced pack on the board also increased in real terms. The increase in prices following the scheduled increase in excise/customs duty in February 2013 were well above the applicable inflation increases and were seen across brands from the three largest tobacco manufacturers and across pack sizes.
The results of the current study concur with those of a study of RRPs of all brands from major tobacco manufacturers and importers which also found prices to have increased above inflation.11 Examination of the Tobacco Sub-index of Australia's CPI (based on regular government surveys of prices among multiple products in a representative range of retail outlets) also suggests an increase in prices above the rate of inflation.28
The current study had several strengths, including careful attention to unobtrusive observation, a multistate panel of diverse store types in a range of SES areas and an extended fieldwork period before and after plain packaging implementation. We excluded tobacconists—from which approximately 11% of smokers report purchasing tobacco8—to limit study costs and because their specialised nature meant that the preservation of unobtrusive observational fieldwork would be difficult. Prices in tobacconists tend to be lower than in other retail outlets,17 so the average prices obtained in this study may have been lower if this group had been included. On the other hand, just over a quarter of the stores initially visited during sampling were excluded because they had no visible price boards. If products in such stores tended to be less discounted (ie, more likely to be sold closer to RRPs), then the average prices obtained in our sample would be lower than prices across the Australian market as a whole. It seems unlikely that these exclusions would have materially affected the pattern of findings over time.
Other retail studies have opted to record the price of specific brands and pack sizes regardless of place on the board or pack bundling,15–17 whereas our study recorded the most-prominent and the lowest-priced advertised single cigarette packs from each store. While this introduced variability in the pack sizes recorded, our method enabled the number of eligible stores to be maximised as the sample was not restricted to those that had the target product/s listed at the time of store selection. Likewise, selected stores were not lost from the sample if they removed any particular product from their price boards. The strategy enabled the study to responsively reflect changes in product offerings among small cheap brands. For example, the most common brand to be listed as the cheapest on the board at the start of the study, JPS Nano 20s, changed to packs of 23s in December 2012 and was thereafter rarely the cheapest listed pack. Had we monitored only JPS Nano throughout the study, our estimates of price changes among packs with the lowest advertised purchase cost after plain packaging would have been confounded by this change in pack size.
The current results do not reflect the average of all the products on the price board, nor the average price Australian smokers actually paid for their tobacco. Limited funding necessitated the combination of the price collection tasks in this study with other tasks (timing of pack retrieval24 ,25 and willingness to sell illicit tobacco7). To maintain the unobtrusive observational nature of the study, we constrained ourselves to collecting 2–3 key pieces of pricing information. A full and detailed retail audit of tobacco prices in Australia by market segment and distribution channel would be costly, since it would examine the retail prices of all products offered for sale across all brands, pack sizes and pack bundles (single, multibuy and carton), both via the Internet and in all categories of retail outlets. It would also collect information about explicit ‘specials’, multi-pack offers and other discounting of particular brands. Data on prices at which products are actually sold could much more simply and cheaply be obtained by the Australian government if tobacco wholesalers were required to collect such information from their customers and report aggregated information directly to the Government. Regular disclosure would enable ongoing monitoring and evaluation using complete and accurate sales weighted price data to assess the effects of public health policies and programmes across all of Australia.29 Provision of annual data on sales and prices is required of tobacco manufacturers and importers under Section 35 of the Smoke-free Environment Act 1990 in New Zealand,30 but no such requirements are imposed on the tobacco industry in Australia.
While not a complete picture of retail prices, the information recorded in this study allowed robust tracking of the price of whatever single pack was most actively being promoted to customers and also the price of whatever product was being advertised to the most price-sensitive smokers. Contrary to predictions by the tobacco industry, our study provides no evidence of downward pressure on the price of prominently promoted premium single pack products. Prices also increased among the lowest-priced products on price boards. Real increases in price coincided with the indexation of excise/customs duty on tobacco products, suggesting that, as has been demonstrated elsewhere,31 companies are ‘over-shifting’ tax increases to consumers, taking the opportunity of each increase in duty to increase their own margins and, consequently, sales revenues.
It is evident that several new value brands in relatively small novel pack sizes were promoted at low introductory prices over 2012 prior to the introduction of plain packaging. Such packs were considerably cheaper per stick than packs of the traditional 20s and 25s and the increasing prevalence over time of packs in novel sizes would have resulted in lower prices than would otherwise have been the case. Other research reported in this volume12 suggests a significant increase in the use of such brands following the introduction of plain packaging legislation corresponding with differentially greater increases in reported prices paid among those using premium and mainstream brands compared to those using value brands The current study shows that even among value brands, prices of the lowest-price cigarettes promoted on price boards were significantly higher in real terms 9 months after the introduction of plain packaging in Australia.
What this paper adds
What is already known
-
Tobacco companies vigorously opposed the introduction of Australia's plain packaging legislation, claiming that it would lead to widespread falls in the prices of tobacco products.
-
The recommended retail prices did not fall, and there has been no fall in prices evident in measures such as the Tobacco Sub-Index of Australia's Consumer Price Index.
-
What this paper adds
-
As part of a real-world observational audit of tobacco retail outlets across Australia, this study has shown that the price of the most-prominently promoted single packs as well as the lowest-priced packs of cigarettes increased in real terms in the months immediately after plain packaging implementation.
Supplementary materials
Supplementary Data
This web only file has been produced by the BMJ Publishing Group from an electronic file supplied by the author(s) and has not been edited for content.
Files in this Data Supplement:
- Data supplement 1 - Online supplement
Footnotes
-
Contributors MS and MW conceived of this study. MB coordinated the collection of data and undertook data analysis. All authors contributed to the drafting and finalisation of the manuscript.
-
Funding This study was supported by Quit Victoria, Cancer Council Australia, Cancer Council South Australia, Cancer Council Victoria and Action of Smoking and Health (UK) and its partner organisations Cancer Research UK, Smokefree Southwest, Fresh and Tobacco Free Futures.
-
Competing interests The authors wish to advise that MS was a technical writer for and MW a member of the Tobacco Working Group of the Australian National Preventive Health Task Force and MW was a member of the Expert Advisory Committee on Plain Packaging that advised the Australian Department of Health on research pertaining to the plain packaging legislation. MW holds competitive grant funding from the Australian National Health and Medical Research Council, US National Institutes of Health, Australian National Preventive Health Agency and BUPA Health Foundation.
-
Ethics approval Institutional Research Review Committee, Cancer Council Victoria.
-
Provenance and peer review Not commissioned; externally peer reviewed.