Article Text

Abstract
Introduction Electronic cigarettes (ECIGs) aerosolise a liquid that usually contains propylene glycol and/or vegetable glycerine, flavourants and the dependence-producing drug, nicotine, in various concentrations. This laboratory study examined the relationship between liquid nicotine concentration and plasma nicotine concentration and puffing behaviour in experienced ECIG users.
Methods Sixteen ECIG-experienced participants used a 3.3-Volt ECIG battery attached to a 1.5-Ohm dual-coil ‘cartomiser’ loaded with 1 mL of a flavoured propylene glycol/vegetable glycerine liquid to complete four sessions, at least 2 days apart, that differed by nicotine concentration (0, 8, 18 or 36 mg/mL). In each session, participants completed two 10-puff ECIG-use bouts (30 s puff interval) separated by 60 min. Venous blood was sampled to determine plasma nicotine concentration. Puff duration, volume and average flow rate were measured.
Results Immediately after bout 1, mean plasma nicotine concentration was 5.5 ng/mL (SD=7.7) for 0 mg/mL liquid, with significantly (p<0.05) higher mean concentrations observed for the 8 (mean=17.8 ng/mL, SD=14.6), 18 (mean=25.9 ng/mL, SD=17.5) and 36 mg/mL (mean=30.2 ng/mL; SD=20.0) concentrations; a similar pattern was observed for bout 2. For bout 1, at 36 mg/mL, the mean post- minus pre-bout difference was 24.1 ng/mL (SD=18.3). Puff topography data were consistent with previous results and revealed few reliable differences across conditions.
Discussion This study demonstrates a relationship between ECIG liquid nicotine concentration and user plasma nicotine concentration in experienced ECIG users. Nicotine delivery from some ECIGs may exceed that of a combustible cigarette. The rationale for this higher level of nicotine delivery is uncertain.
- Nicotine
- Electronic nicotine delivery devices
- Addiction
Statistics from Altmetric.com
Introduction
Electronic cigarettes (ECIGs) are an evolving product class with an electric heating element that aerosolises a liquid often containing propylene glycol, vegetable glycerine, flavourants and the dependence-producing drug, nicotine. ECIG use is increasing,1 ,2 ,3 ,4 ,5 including among tobacco cigarette smokers using them as smoking cessation aids.2 ,6 Effective ECIG-mediated smoking cessation may depend on a given product's ability to deliver nicotine, which can vary.7 ,8 ,9 Interestingly, experienced users puff differently than ECIG-naïve combustible cigarette smokers,10 ,11 ,12 and this modified puffing behaviour likely influences product nicotine yield.13 Other factors also can influence nicotine yield, including device features and liquid nicotine concentration. To date, there has been little systematic exploration of how these factors might influence nicotine delivery in experienced ECIG users. One purpose of this study was to examine the extent to which liquid nicotine concentration influences the plasma nicotine concentration of experienced ECIG users. A secondary purpose was to examine how puff topography was influenced by liquid nicotine concentration.
Methods
Participants
Sixteen experienced ECIG users completed this Institutional Review Board-approved study. Eligibility criteria included age between 18 and 55 years, and using ≥1 mL ECIG liquid/day for ≥3 months at a liquid nicotine concentration of ≥12 mg/mL. Exclusion criteria included history of chronic disease or psychiatric condition, regular use of a prescription medication (except vitamins and/or birth control), marijuana use >10 days and/or alcohol use >25 days in the past 30 days, use of other illicit drugs in the past 30 days and pregnancy.
Procedure
Similar to another report (A Lopez, M Hiler, E Soule, et al, In Press. Effects of Electronic Cigarette Liquid Nicotine Concentration on Plasma Nicotine and Puff Topography in Tobacco Cigarette Smokers: A Preliminary Report. Nicotine and Tobacco Research), all participants completed four independent, double-blind sessions preceded by instructions to abstain from tobacco/nicotine for >12 h, separated by >48 h, and randomised. In each session, participants were provided with an ‘eGo’ 3.3-Volt, 1000 mAh battery with a 1.5-Ohm, dual-coil, 510-style cartomiser preloaded (by staff with no participant contact) with 1 mL of a flavoured (tobacco or menthol), 70% propylene glycol/30% vegetable glycerine liquid. Sessions differed by liquid nicotine concentration: 0, 8, 18 or 36 mg/mL. Liquid nicotine concentration was verified throughout, and, on average, actual nicotine content was ±1 mg of labelled nicotine content. In each session, participants completed two, 10-puff ECIG-use bouts (separated by 60 min as in previous work),14 with a 30 s inter-puff interval. Venous blood was sampled 10 times in each session (10 min prior to and 5, 15, 30, 45 and 55 min after bout 1, and 5, 15, 30 and 45 min after bout 2) to assess plasma nicotine concentration.15 Puff duration, volume and peak flow were measured.10 Other outcomes (eg, subjective effects) were assessed but are not the focus of this preliminary report and are not discussed further.
Statistical analyses
For plasma nicotine data, in order to maintain statistical power while limiting type I error, we conducted a set of a priori comparisons using dependent sample t tests in which, at each measurement timepoint, the mean plasma nicotine concentration for the 0 mg/mL condition was compared to the mean of the 8, 18 and 36 mg/mL condition. Because these comparisons were non-orthogonal, a Bonferroni correction was applied.16 For topography data, we used the same analytic strategy within each bout, but compared across bouts within each concentration using uncorrected dependent sample t tests for these orthogonal comparisons.
Results
Participant characteristics
Of the 15 men and 1 woman who participated, 11 self-identified as Caucasian, 3 African-American, 1 Hawaiian/Pacific Islander and 1 as other. Mean (SD) age was 29.6 (5.8) years. On average, participants had been using ECIGs for 1.4 (0.9) years and consumed 2.0 (1.4) mL nicotine liquid daily at 19.8 (5.9) mg/mL nicotine concentration. Thirteen did not smoke and three smoked an average of 2.3 (0.9) cigarettes/day for 1.7 (2.3) years. At screening, average expired air carbon monoxide (CO) concentration was 3.5 (2.4) parts/million.
Plasma nicotine
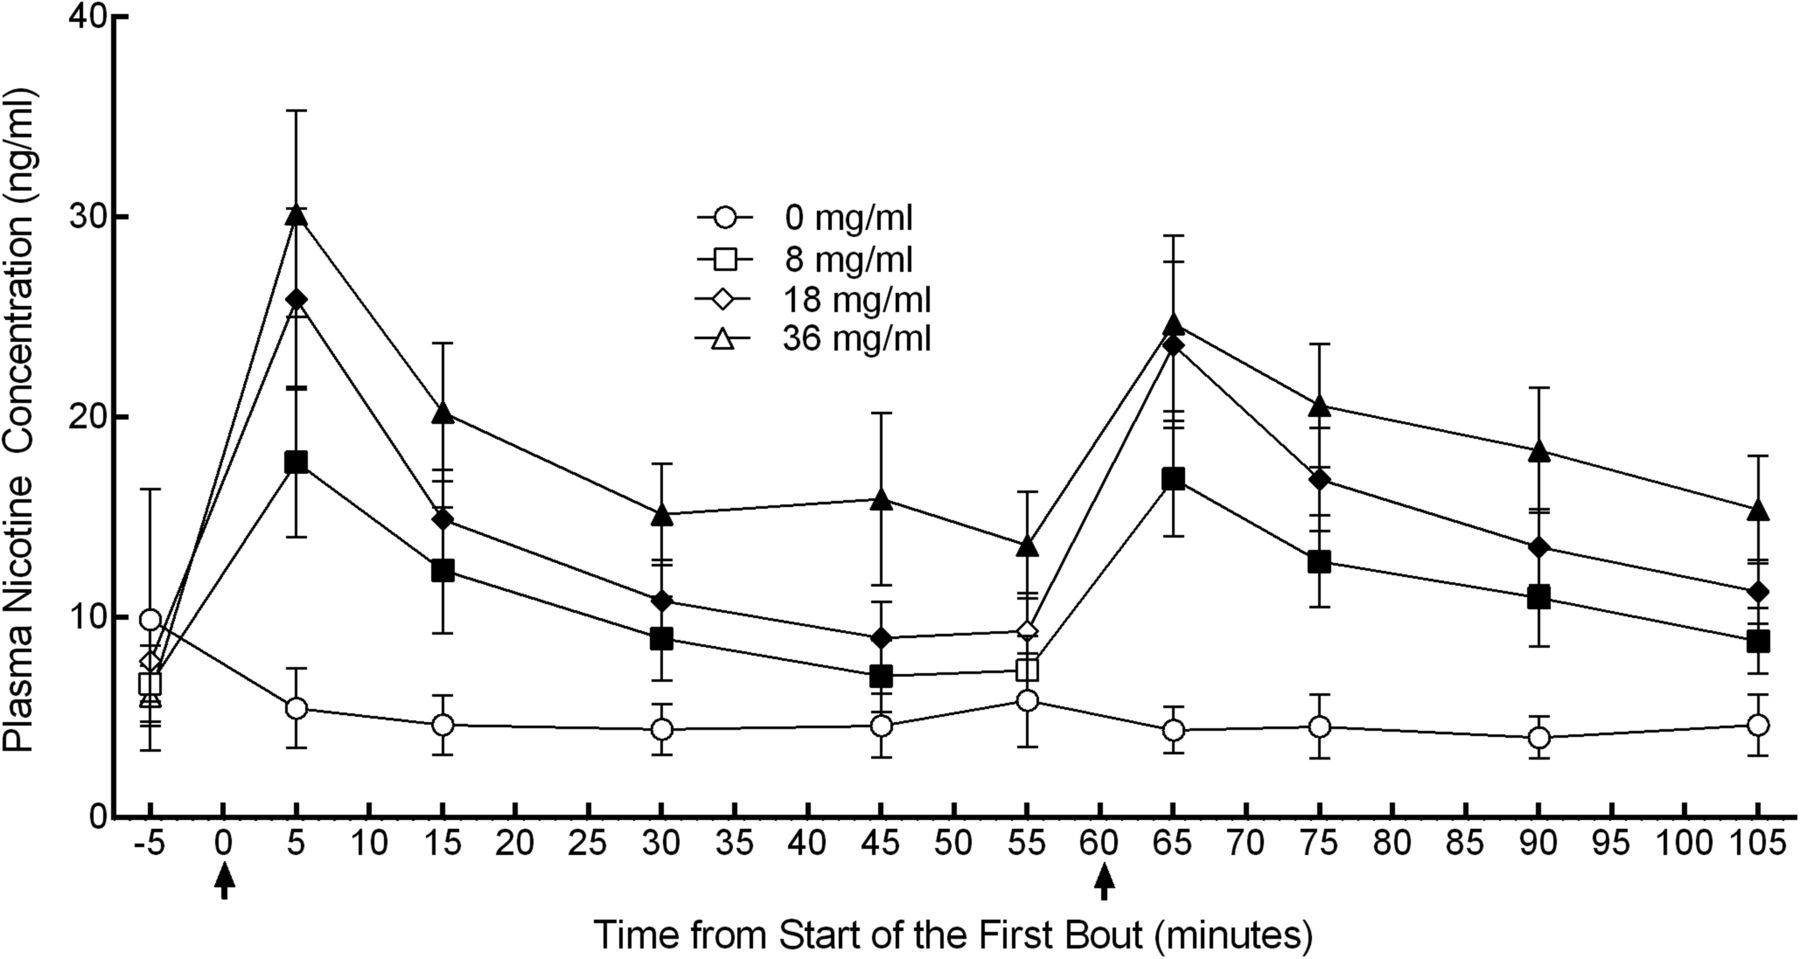
Figure 1 depicts mean plasma nicotine concentration over time by liquid nicotine concentration. Significant (p<0.05) differences were observed between 0 and 8 mg/mL immediately after the first bout (timepoint 5 min) through 45 min and also immediately after the second bout (timepoint 65) through 105 min (ts(15)<−3.2), between 0 and 18 mg/mL immediately after the first bout through 45 min and immediately after the second bout through 105 min (ts(15)<−3.2), and between 0 and 36 mg/mL immediately after the first bout, and thereafter (ts(15)<−3.0). Immediately following the first bout, mean (SD) plasma nicotine concentration for the 0 mg/mL liquid nicotine concentration was 5.4 (7.7) ng/mL, for 8 mg/mL it was 17.8 (14.6) ng/mL, for 18 mg/mL it was 25.9 (17.5) ng/mL and for 36 mg/mL it was 30.2 (20.0) ng/mL. The difference from baseline following the first bout was −4.4 (17.9) ng/mL for 0 mg/mL, 11.1 ng/mL (9.4) for 8 mg/mL, 18.1 ng/mL (15.5) for 18 mg/mL and 24.1 (18.2) ng/mL for 36 mg/mL. Immediately following the second bout, mean plasma nicotine concentration for 0 mg/mL was 4.4 (4.6) ng/mL, for 8 mg/mL it was 16.9 (11.2) ng/mL, for 18 mg/mL it was 23.6 (16.1) ng/mL and for 36 mg/mL it was 24.7 (17.0) ng/mL.
Plasma nicotine concentration versus time as a function of electronic cigarette (ECIG) nicotine concentration. Mean (±SEM) plasma nicotine values for 16 experienced ECIG users using ECIGs that varied by liquid nicotine concentration. Bouts consisting of ECIG use for 10 puffs with a 30 s inter-puff interval are denoted by arrows. Filled symbols indicate a significant (p<0.05) difference from 0 mg/mL ECIG liquid at that time point.
Puff topography
For bout 1, mean (SD) volume was 154.5 mL (155.5) for 0 mg/mL, 176.0 mL (131.6) for 8 mg/mL, 114.7 mL (61.9) for 18 mg/mL and 78.5 mL (39.5) mL for 36 mg/mL. The difference between 0 and 36 mg/mL was not significant with the Bonferroni correction, though this difference would have been significant without it. Also, for bout 1, mean puff duration was 5.5 s (2.04) for 0 mg/mL, 5.5 s (2.11) for 8 mg/mL, 4.97 s (1.69) for 18 mg/mL and 3.98 s (1.54) for 36 mg/mL. The difference between 0 and 36 mg/mL was significant (t(15)=4.7). Mean flow rate was 33.8 mL/s (33.1) for 0 mg/mL, 30.8 mL/s (20.7) for 8 mg/mL, 23.3 mL/s (10.8) for 18 mL/s and 19.7 mL/s (6.43) for 36 mg/mL; there were no significant differences from 0 mg/mL. For bout 2, mean volume was 210.8 mL (261.13) for 0 mg/mL, 208.4 mL (170.2) for 8 mg/mL, 124.2 mL (70.7) for 18 mg/mL and 84.3 mL (44.25) mL for 36 mg/mL; mean duration was 5.8 s (2.07) for 0 mg/mL, 6.1 s (2.21) for 8 mg/mL, 5.35 (1.98) for 18 mg/mL and 4.17 s (1.55) for 36 mg/mL; and mean flow rate was 33.0 mL/s (31.5) for 0 mg/mL, 31.5 mL/s (21.7) for 8 mg/mL, 22.8 mL/s (10.1) for 18 mL/s and 20.4 mL/s (8.7) for 36 mg/mL. For bout 2, a significant (p<0.05) difference in puff duration was observed for 36 mg/mL compared to 0 mg/mL in bout 2 (t(15)=4.1).
Discussion
These results demonstrate that, in experienced ECIG users, mean plasma nicotine concentration after 10 puffs from a 3.3-Volt ECIG with a 1.5-Ohm dual-coil cartomiser is related directly to liquid nicotine concentration. At the highest concentration (36 mg/mL), we observed a difference (post-bout minus pre-bout) in plasma nicotine concentration of 24.1 ng/mL (18.3). This ‘nicotine boost’ appears greater than is typically observed in combustible cigarette smokers under similar puffing conditions (ie, ∼15 ng/mL).14 ,17 Thus, some ECIGs appear capable of exceeding the nicotine delivery profile of a combustible tobacco cigarette. We speculate that this excessive nicotine delivery may be harmful if it leads to a greater level of nicotine dependence, which could make ECIG cessation difficult if users eventually choose to try to quit their ECIG use. Alternatively, users of higher nicotine liquid concentration may control nicotine intake by altering their puffing behaviour. Nonetheless, there is no clear rationale for a product that potentially delivers more nicotine than a tobacco cigarette, thus policymakers worldwide may want to consider limiting access to ECIG device/liquid combinations that demonstrate this nicotine delivery profile.
The puff topography results reported here were consistent with some previous reports,10 ,11 but not with one other report,18 which reported lower puff volume and shorter puffs. This difference may reflect a different product used (‘cigalikes’) and/or sensitivity differences in topography measurement systems.10 Interestingly, there was a significant (p<0.05) difference in puff duration in the 36 mg/mL condition relative to the 0 mg/mL condition in bout 1 (and a non-significant trend for lower puff volume in this bout), and these results suggest that participants may have altered their puff topography in order to titrate nicotine delivery in the 36 mg/mL condition. If so, the plasma nicotine results in the 36 mg/mL condition are all the more striking, as they indicated that even when attempting to titrate nicotine delivery, users may still receive more nicotine from some ECIGs than from a combustible cigarette over a 10-puff-use bout.
This study has important limitations. As a preliminary report, the study lacked sensitivity for many comparisons and a larger sample size would allow statistical techniques that take into account the overall experiment-wise error rate.16 Also, results obtained from this study's 10-puff regimen may differ from those obtained after ad libitum puffing, during which users have the opportunity to control puff number and thereby alter the nicotine dose they receive. Additionally, because this study included no naturalistic observation, the nicotine delivery profile of users’ usual liquid/device combination outside of the laboratory is uncertain. Another limitation, not unique to this study, is that assessing ECIG abstinence is problematic, as there are no rapid measures that can be used for this purpose (as expired air CO is used to assess abstinence from combustible tobacco). The baseline plasma nicotine concentrations are higher than those reported in combustible tobacco users following 12 h abstinence, which may indicate that at least some participants did not fully comply with the presession abstinence requirement. Finally, the results reported here were obtained from a homogeneous sample that was primarily Caucasian and male. In future work, we hope to be able to explore the extent to which gender and ethnicity play a role in determining ECIG effects.
What this paper adds
Previous studies examining the ability of electronic cigarettes to deliver nicotine used a variety of devices and liquid nicotine concentrations, and demonstrated wide variability with some device/liquid combinations delivering no nicotine and others approximating the nicotine delivery profile of a combustible cigarette. This is the first study to hold all device and liquid characteristics constant while varying liquid nicotine concentration, and it demonstrates that user plasma nicotine concentration increases with the nicotine concentration of the liquid and, at the highest liquid nicotine concentration tested, the nicotine delivery profile of the electronic cigarette exceeded that of a tobacco cigarette tested under similar-use conditions. There is no clear rationale for an electronic cigarette that exceeds the nicotine delivery of a combustible tobacco cigarette, and policymakers may want to limit access to such liquids/devices.
Acknowledgments
The authors thank CSTP staff Barbara Kilgalen, Kathleen Osei and Kendall Pettaway for their contribution to this study.
References
Footnotes
Contributors All the authors contributed to the conceptualisation and preparation of the review, and approved the final text. CPR drafted the manuscript. MMH, TRS and AAL aided in data analysis. ABB and AS revised the methods and results sections for errors. NK and TL reviewed the final manuscript. TE reviewed the updated version, edited and finalised it.
Funding This research was supported by the National Institute on Drug Abuse of the National Institutes of Health under Award Number P50DA036105 and the Center for Tobacco Products of the US Food and Drug Administration. The content is solely the responsibility of the authors and does not necessarily represent the views of the NIH or the FDA.
Competing interests None declared.
Patient consent Obtained.
Ethics approval The Virginia Commonwealth Institutional Review Board.
Provenance and peer review Not commissioned; externally peer reviewed.