Article Text

Abstract
Objective Few longitudinal studies have examined the effect of tobacco price increase on both cessation among smokers and relapse among quitters. Our objective was to investigate the differential impact of the tobacco price increase on the changes in smoking status in the total population and various subgroups.
Methods We analysed data from a Japanese nationally representative longitudinal study of 30 773 individuals aged 50–59 years (weighted sum of discrete-time number = 215 411) with smoking information, using inverse probability weighting to account for non-response at follow-up. Generalised estimating equation models were used to calculate the odds ratios (ORs) for smoking behavioural changes (cessation among smokers and relapse among quitters), using discrete-time design. Stratified analyses were conducted according to demographic, socioeconomic and health behavioural characteristics.
Results From 2005 to 2012, current smoker prevalence among the middle-aged Japanese population decreased from 30.5% to 24.3%. Of all the factors surveyed, only the tobacco price increase in 2010 (up by 37%, the highest increase during the period) was significantly associated with both cessation among smokers (OR 2.14, 95% confidence interval 1.90 to 2.41) and prevention of relapse among quitters (0.60, 0.46 to 0.77). Regarding the subgroup analysis, the tobacco price increase was associated with a significant reduction in relapse in the lowest income, recent quitters and very poor health subgroups. However, different associations were observed for cessation; a significant association between price increase and cessation was observed among all subgroups except for the heavy smoker and recently unemployed subgroups.
Conclusions We confirmed that the tobacco price rise was associated with increasing cessation and decreasing relapse concurrently. Furthermore, this price rise was associated with favourable smoking changes in nearly all population subgroups; a large differential impact was not observed across the various subgroups.
- Price
- Cessation
- Socioeconomic status
- Taxation
This is an Open Access article distributed in accordance with the Creative Commons Attribution Non Commercial (CC BY-NC 4.0) license, which permits others to distribute, remix, adapt, build upon this work non-commercially, and license their derivative works on different terms, provided the original work is properly cited and the use is non-commercial. See: http://creativecommons.org/licenses/by-nc/4.0/
Statistics from Altmetric.com
Introduction
Increases in tobacco excise tax that result in higher tobacco prices are considered best practice to reduce population tobacco use and inherent smoking inequality.1 ,2 A longitudinal study design is appropriate to estimate the effects of a price increase.3 Since few previous studies focused on the impact of price increase on relapse, longitudinal studies which provide evidence of the effect of tobacco price on both cessation among smokers and relapse among quitters are scarce.1 ,4–7 In addition, the impact of tobacco price increases on smoking behaviour in different social groups has been investigated; mixed results have been reported for differences in gender, occupation and education subgroups.8–10 Generally, increases in tobacco price reduce cigarette use, especially among the poor and the young rather than the affluent and the old.1 The impact of tobacco price increases is of great interest to the public health community because they play a pivotal role in people’s decisions to use tobacco.2 In Japan, a special tobacco tax was imposed on 1 December 1998 and the real price of tobacco increased on 1 July 2003, 1 July 2006, 1 October 2010 and 1 April 2014. The price of a pack (20 cigarettes) of the most popular brand in Japan, Mild Seven (the brand name was changed to ‘Mevius’ in 2013), increased from 250 to 270 yen (8% increase) in 2003, to 300 yen (11% increase) in 2006, to 410 yen (37% increase) in 2010, and to 430 yen (5% increase) in 2014.11 Partly owing to these price increases, current smoking prevalence among Japanese adults (both sexes) aged 20 years or more has decreased from 31% in 2001 to 22% in 2013.12
Furthermore, most studies did not account for attrition at follow-up in the analyses.1 Therefore, we used data collected between 2005 and 2012 from a nationally representative middle-aged population in Japan and investigated trajectories of smoking status and determinants of important smoking behavioural changes (ie, cessation and relapse), and the association between the tobacco price increase and smoking changes, accounting for attrition at follow-up. Our objective was to reveal the differential impact of the tobacco price increase on the changes in smoking status in the total population and various subgroups, such as socioeconomic, work, smoking or health status in Japan.
Methods
Data
We used data from the Longitudinal Survey of Middle-aged and Elderly Persons, a nationally representative study conducted by the Ministry of Health, Labour and Welfare (MHLW).13–15 The study participants, who were aged 50–59 years on 31 October 2005, were selected by two-stage random sampling, and were followed up every year via face-to-face survey (1st–5th year) and mailed survey (6th–8th year). Of 5280 districts selected for the nationwide population-based cross-sectional survey in 2004,12 2515 districts were randomly selected. Within the districts, 40 877 residents aged 50–59 years were surveyed on 2 November 2005. A total of 33 815 individuals responded, giving a response rate of 82.7%. The second to eighth waves of the survey were conducted in November 2006–2012 and consisted of 31 403, 30 013, 28 945, 28 151, 25 740, 24 879 and 23 614 respondents, respectively (the retention rate during the period 2005–2012 was 69.8%). We obtained permission from MHLW to use the data. The analyses of national survey data were considered to be exempt from the need for ethical review according to the Epidemiological Research Guidelines.
Smoking behaviours and the changes
Smoking status was classified as never-smoker, quitter or current smoker based on the question ‘Do you smoke now?’ with possible responses of ‘I have never smoked’; ‘I have stopped smoking’; or ‘I smoke now’. Smoking status was followed up every year with the question ‘Do you smoke now?’ with possible responses of ‘I do not smoke now’ or ‘I smoke now’. According to these responses, smoking status at the time of survey was determined to be never-smoker, quitter or current smoker. For current smokers, the number of cigarettes per day was determined by asking: ‘how many cigarettes do you usually smoke a day?’. Response categories were 1–10, 11–20, 21–30 and 31 or more per day. ‘Recent quitter’ was defined as someone who had stopped smoking within the last year.
Usually individuals move in and out of different smoking status categories over time. We evaluated smoking behavioural changes between consecutive waves: each baseline and the next follow-up in discrete-time design, that is, all variations of the kth to the (k+1)th waves, for k=1,…,7. Smoking cessation at the (k+1)th wave was identified as a current smoker at the time of the baseline survey (kth wave) who had become a quitter at the time of the next survey (ie, (k+1)th wave). Relapse at the (k+1)th wave was defined as a quitter at the time of the baseline kth survey who had become a current smoker at the time of the (k+1)th survey. Note that in our discrete-time design, the risk set for cessation at the (k+1)th wave comprised those who were classified as current smokers at the kth wave. In the same way, the risk set for relapse at the (k+1)th wave comprised those who were classified as quitters at the kth wave. Thus, participants who initiated cessation during the follow-up period entered the risk set for relapse thenceforth; likewise, participants who restarted smoking entered the risk set for cessation thenceforth. This approach allowed us to treat multiple events (multiple cessation/relapse) among the same participants.
Variables
A broad set of covariates, which could be associated with smoking behaviour, included: (1) sex, (2) age (50–54, 55–59 or 60–65 years), (3) education (junior high school, high school, technical school or junior college, or university (4 years) or more), (4) marital status (married, divorced/widowed, or never married), (5) equivalent household income (quintiles), (6) housing tenure (not owning housing or owning housing), (7) working condition (working, unemployed or other (eg, retired or housewife)), (8) self-rated health (excellent, good, poor or very poor) and (9) alcohol consumption (everyday drinker, 1–6 times/week drinker, 1–3 times/month drinker, seldom drinker or never drinker). Equivalent household income was calculated by combining income reported by a respondent and his/her spouse and dividing the sum of the income by the square root of the number of family members, in order to adjust for household size,16 and was categorised by quintile. We divided working condition into four categories: working, retired/homemaker/other, recently unemployed (within 1 year) or other unemployment (including unknown date for the start of unemployment). Those not working were categorised as unemployed if they were seeking employment; otherwise, they were considered economically inactive (eg, retired or homemaker).
Statistical analyses
The longitudinal approach is suited to the study of changes in smoking behaviour over time. However, a high percentage of the participants will be lost to follow-up.17 If those lost differ in important respects to those who remain in the study, the results can be biased.3 To account for the non-random non-response, we used inverse probability weighting (IPW) for the remaining participants in each survey by modelling the probability of not dropping out from the study (details are shown in the online supplementary data).18 The unweighted available data analyses are presented in the online supplementary data.
The χ2 tests were used to compare the difference in smoking status according to characteristic variables. Using the discrete-time design, where each wave of participants was treated as an analytical unit, the IPW logistic generalised estimating equation (GEE) model was used to calculate the adjusted odds ratios (AORs) and 95% confidence intervals (CIs) for smoking behavioural changes (cessation and relapse) from the kth to (k+1)th waves during the follow-up interval (k=1,…, 7). The dependence of observations that belong to the same individual due to the discrete-time design that allows multiple events, and the IPW were accounted for by sandwich variance estimators assuming an unstructured correlation matrix within the same individual.19 Since the tobacco price increased on 1 July 2006 and 1 October 2010 during the study period, the periods 2005–2006 and 2009–2010 (a year from November to November) were interpreted as a proxy variable for tobacco price increase. The period 2005–2006 was not analysed for relapse because we had no data in the recent quitter variable. Furthermore, the range of the price increase was larger in 2010 than in 2006. Thus, we mainly focused on the 2010 tobacco price increase. The last period (2008–2009) before the period of the 2010 price increase was used as a reference category. To examine the differential impact of the 2010 tobacco price increase in various subgroups, GEE was separately conducted in each subgroup (stratified analysis). Furthermore, to confirm the interaction effect between the 2010 tobacco price increase (period 2009–2010) and each subgroup, we also conducted GEE using an interaction term (see online supplementary data) to estimate the AORs between subgroups. The trend association was assessed by linear trend for covariate category, treated as an ordinal variable. Trend analyses for the period variable were used to observe hardening or softening20 in smokers over time. Participants with a missing value for any baseline characteristic (except income) were excluded from the IPW-GEE analyses.
Probability values for statistical tests were two-tailed and p<0.05 was considered statistically significant. All analyses were performed using SAS V.9.2 (SAS Institute, Cary, North Carolina, USA).
Results
Of 31 403 individuals who responded to both the first and second surveys, we excluded those with missing smoking information (n=630), and analysed the remaining 30 773 individuals (total number of discrete-time person-years = 215 411) using IPW accounting for non-response.
The distribution of smoking at each wave, and the changes between waves, are shown in table 1. In the first survey, 30.5% were current smokers, reducing to 24.3% in the eighth survey among respondents with IPW adjustments for non-response, although those decreased to 19.5% when we used only available respondents (unweighted; see online supplementary table S1). Around 3–9% of participants either relapsed or stopped smoking between waves—with slightly more stopping, leading to a reduction in smoking prevalence over time. Following the large tobacco price increase between the fifth and sixth surveys, more stopping and less relapsing were observed during 2009–2010 than during other periods.
Distribution and changes in smoking status, adjusted results using inverse probability weighting (percentages in parentheses)
The distribution of covariates among total baseline participants (total number of discrete-time person-years) is shown in online supplementary table S2. The rates of current smokers and quitters were significantly different according to all the baseline characteristics such as sex, age, education and marital status. The results from the unweighted available data analyses did not differ largely (see online supplementary table S3).
OR for cessation according to baseline characteristics among current smokers are shown in table 2. After excluding participants with missing variable information (n=6562), 52 699 current smokers (weighted number) were analysed by GEE. Cessation rates during the periods ‘2005–2006’ (OR 1.29, 95% CI 1.13 to 1.46), ‘2007–2008’ (OR 1.20, 95% CI 1.06 to 1.36) and ‘2009–2010’ (OR 2.14, 95% CI 1.90 to 2.41) were significantly higher than the rate during the period ‘2008–2009’. Further, lower numbers of cigarettes smoked per day, older age groups, being married, owning housing, recent unemployment and lower alcohol consumption (including never drinkers) were significantly associated with cessation compared with the reference categories.
OR for short-term cessation
Rates of cessation in various subgroups were compared between the period ‘2008–2009’ and ‘2009–2010’ and are shown in figure 1. Among all subgroups, a significant impact on cessation was observed during the period ‘2009–2010’ except in two subgroups: 31 or more cigarettes smoked per day and recent unemployment.

Rates of smoking cessation in various subgroups during 2008–2009 and 2009–2010. GEE analyses with weighting.
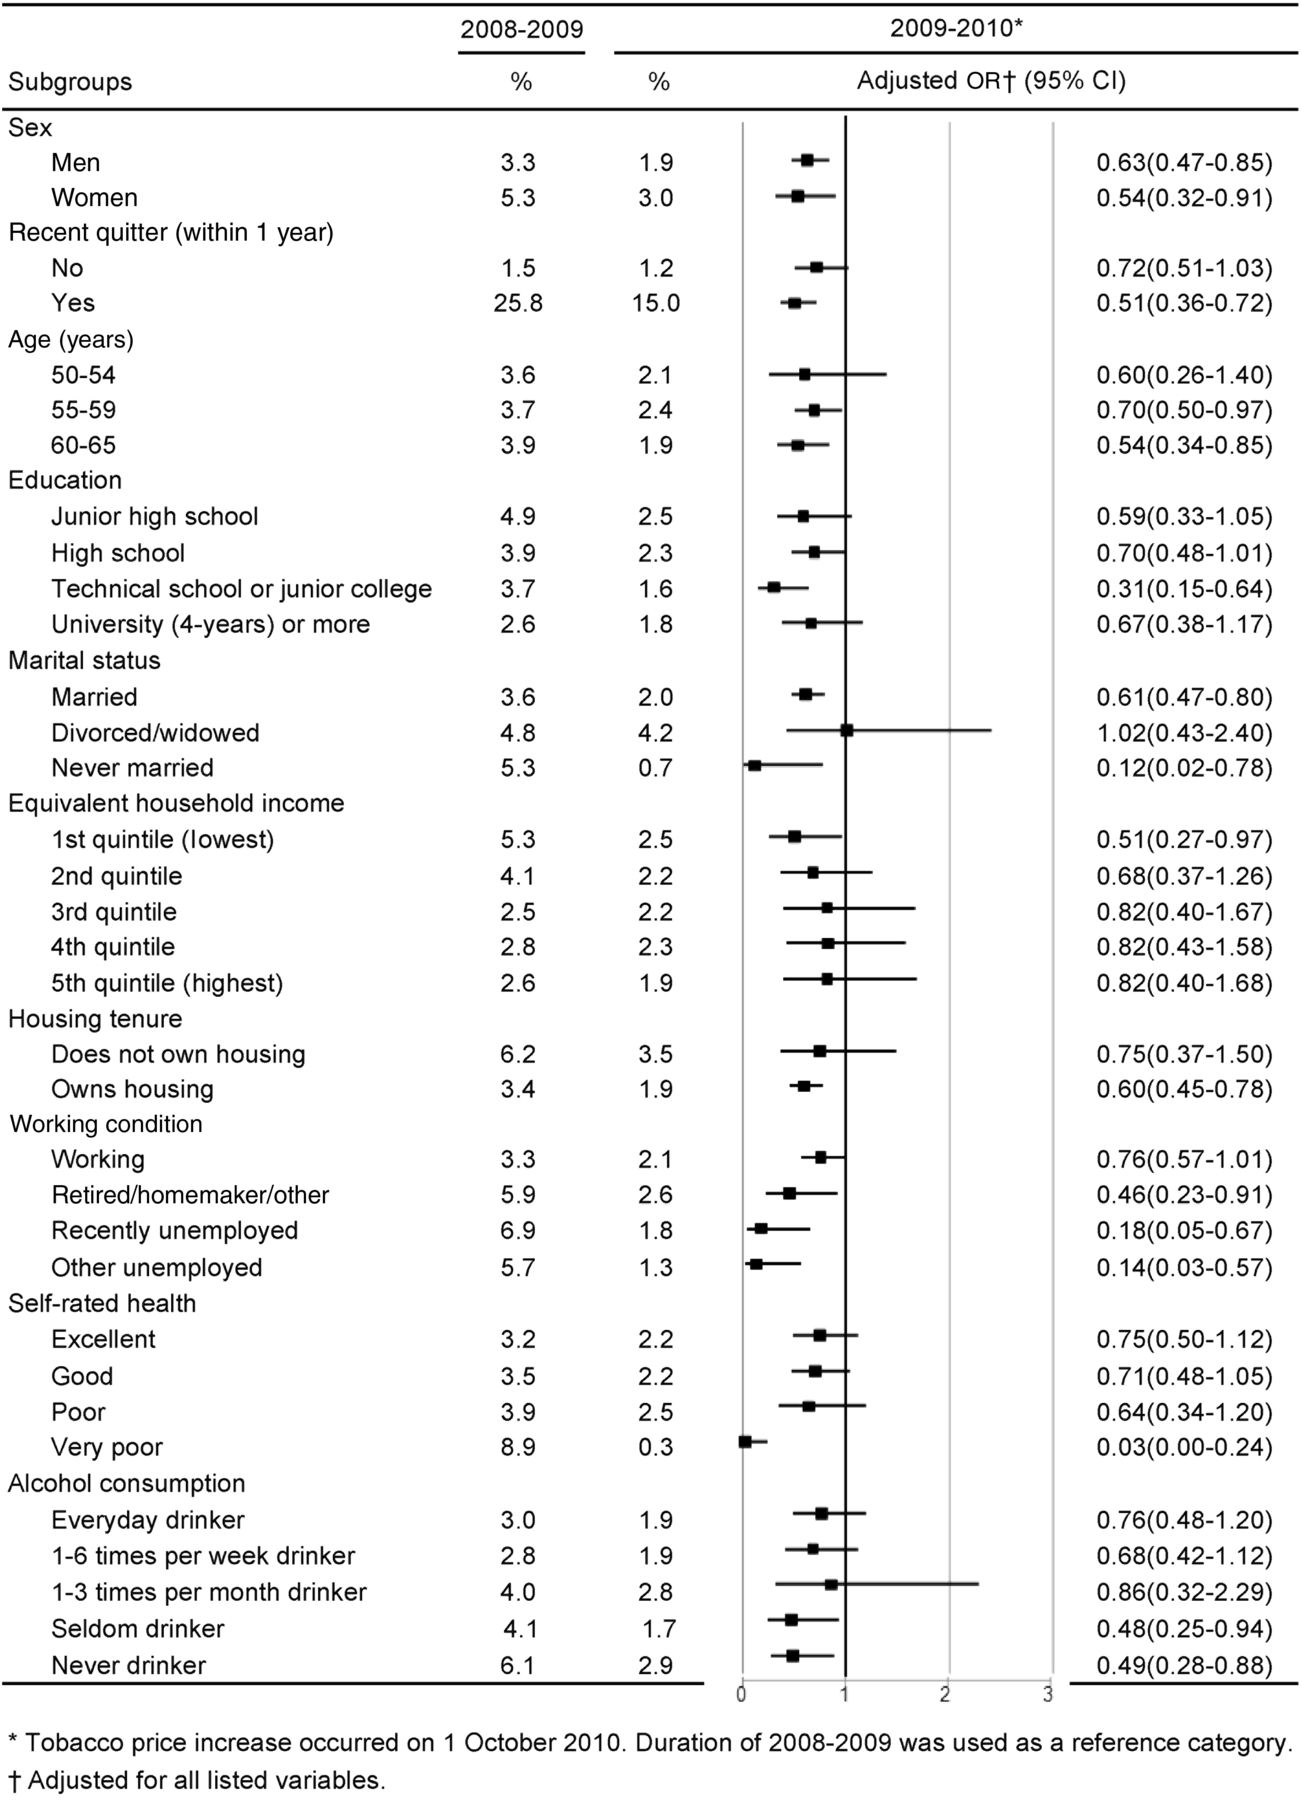
ORs for relapse according to baseline characteristics among quitters are shown in table 3. After excluding participants with missing variable information (n=5132), 51 491 quitters (weighted number) were analysed for GEE. Since information for recent quitting was not available in the first survey, discrete time for the period 2005–2006 was not used for relapse (n=6493). The relapse rate for ‘2009–2010’ is significantly lower than the rate for ‘2008–2009’ (OR 0.60, 95% CI 0.46 to 0.77). Furthermore, sex, recent quitter, higher household income, and very poor self-rated health were significantly associated with relapsed smoking compared with reference categories. A significant p for trend confirmed the results for household income and self-rated health.
OR for relapse
Rates of relapse in various subgroups compared between ‘2008–2009’ and ‘2009–2010’ are shown in figure 2. A significant impact on relapse reduction during the period ‘2009–2010’ was observed in many subgroups, that is, both sexes, recent quitter, older age groups, technical school or junior college education, married and never married status, lowest household income, owning housing, unemployed categories, very poor self-rated health, and seldom or never drinkers. The results from the unweighted available data analyses for cessation and relapse showed similar estimates with few differences in significance (see online supplementary tables S4 and S5 and figures S1 and S2).

Rates of smoking relapse in various subgroups during 2008–2009 and 2009–2010. GEE analyses with weighting.
Discussion
We examined the association between a tobacco price increase and both cessation among smokers and relapse among quitters, using a large longitudinal data set, and accounting for attrition.1 In the current study, from 2005 to 2012, current smoker prevalence among the middle-aged Japanese population decreased from 30.5% to 24.3% using IPW, partly due to tobacco price increases in 2006 and 2010. Since there is a higher attrition tendency among smokers than never-smokers, available data analysis would have resulted in a biased estimate (see online supplementary table S1). We therefore considered that IPW adjustments for non-responses might provide an appropriate figure of smoking prevalence.
Impact of tobacco price increase
Of all the factors surveyed, only the period 2009–2010 (when the 37% price increase occurred) was significantly associated with both promoting cessation among smokers and preventing relapse among quitters (tables 2 and 3). There are no local level variations in tobacco prices in Japan and the regulated increased price was applied throughout the country under the Tobacco Business Law21 (ie, there was no time delay in the market price rise across Japan). We could therefore assume that all study participants were equally affected by the increase. The tobacco price was increased on 1 October 2010, at least 1 month before the survey in November 2010, but there may have been an earlier response due to anticipation effects,22 as also seen in a previous study.23 Another Japanese study has shown that intention to quit among smokers immediately before the tax increase (August–September 2010) was high,24 as 53% and 72% of those who intended to quit were planning this for ‘before’ or ‘on’ the day of the tax increase. Furthermore, no other major tobacco control measures were taken during the period 2009–2010 in Japan21; thus, cessation during this period, compared with 2008–2009 (as a reference), could be assumed to be the effect of the tobacco price.
Additionally, the rate of cessation during the periods 2005–2006 and 2007–2008 was significantly higher (for quitting only) compared with that during 2008–2009. There was an 11% price increase in 2005–2006. The smoking-cessation agent varenicline has been covered by insurance providers since April 200825 and electronic locking devices utilising verification cards have been mandated since 2008 and were installed in nearly every tobacco vending machine by July 2008 across the nation.26 Furthermore, these events were reported in the mass media. This might have resulted in the significantly high cessation rates in 2005–2006 and 2007–2008.
Differential effects of the tobacco price increase in various subgroups were observed for both cessation and relapse. Previous studies have reported that tobacco price increases promote cessation and prevent relapse more among the poor than among the affluent.1 ,9 ,10 However, this study did not support this association for cessation, that is, significantly positive AORs for cessation were observed among all income subgroups with no large difference in point estimate. This was in line with a previous study23 and confirmed by an additional result that no significant interaction term between year and income was found in the GEE analyses for cessation. As for relapse, when the tobacco price increased, it was only significantly associated with prevention of relapse in the lowest income subgroup (figure 2).
Further, we observed no effect modification of the price increase on either cessation or relapse by sex in this study (figures 1 and 2), which is in line with the results from a review paper that reported no clear evidence for differential effects by sex.9 This is possibly because this study did not include the younger generation who are likely to stop smoking when specific events occur such as pregnancy or childcare.27 As for number of cigarettes smoked per day, the price increase was not significantly associated with increased cessation in the subgroup of heavy smokers (31 or more cigarettes smoked per day), although the point estimate was positive. In all other subgroups of fewer cigarettes smoked per day, the price increase was significantly associated with cessation (figure 1).
Interestingly, differential impacts of the price increase on relapse were observed according to baseline characteristics such as recent quitter or long-term quitter, level of household income and self-rated health. Consistent with previous studies,28 recent quitters were more likely to relapse than long-term quitters. However, we found that, when the price increased (figure 2), it was significantly associated with prevention of relapse among recent quitters; the same was not true for long-term quitters, although the relapse rate among recent quitters was high, even in 2009–2010 (15.0%). Similarly, quitters with very poor self-rated health had a significantly higher association with relapse than those with excellent health. When the price increased, it was only significantly associated with prevention of relapse in the very poor health subgroup, although point estimates of <1 AOR were observed in all other health subgroups. Taken together, our findings suggest the existence of several high-risk subgroups (eg, heavy smoker and short-term quitter) for tobacco control.
Policy implications
During the period 2009–2010, smoking prevalence decreased (from 27.2% to 24.5%) at the same time as the 2010 tobacco price increase. However, in 2011, there was a slight increase to 25.1%. The notion of ‘hardening’ among smokers must also be taken into consideration. After some smokers who were less dependent and found it easier to quit have done so, the remaining smokers may become less likely to quit over time, that is, hardening.20 However, since the trend of the period was not significant for either cessation or relapse in both weighted and unweighted analyses, no evidence of a hardening in smokers was obtained. The entire distribution of smoking volume shifted down over time (table 1). This might be a key step in moving towards cessation. Although this study did not investigate long-term cessation, it is important to determine whether smokers successfully quit in the long term or not. Further studies to investigate long-term changes including cessation or reduction in the number of cigarettes smoked per day will be required in the future.
In recent years, the price of tobacco in Japan has been considered very low according to the affordability index.29 Cigarettes were more affordable in Japan than in any other developed countries surveyed in 2009; the price of a pack of 20 cigarettes could be earned in 11.5 min compared with 30 min in many other countries.29 After the 2010 price increase, this figure rose slightly (to around 16 min) but remained low compared with other countries.
Our current findings suggest that we need to consider the stages of tobacco control policy in Japan. The early stages of public health interventions, such as health information campaigns, often cause health equity problems.30 The inverse equity hypothesis31 avers that such interventions disproportionately benefit the wealthy, so there is an initial increase in inequality (early stage). Deprived sections of society catch up after the affluent have gained maximum benefit (late stage). Although the tobacco price increased in 2010 in Japan, the low price may mean that the ‘early stage’ of the tobacco price intervention will continue. Further price increases may thus be necessary to alleviate health inequalities.
In the Japanese health promotion strategy, Health Japan 21 (Second version), government ask for reduction of both smoking prevalence and health in equality (including smoking inequality).32 This study identified high-risk populations for tobacco control, that is, groups that are less sensitive to tobacco price increase, although they may respond to further higher tobacco price increases. Since some subgroups are less likely to quit smoking or continue to not smoke, even if the tobacco price is increased by up to 37%, and furthermore respond slowly to price increases, additional tobacco control measures targeting the high-risk subgroups may be required.
Limitations
There are several limitations to the study. First, the smoking variables were self-reported without biomarker validation; however, the quality of the self-reporting was generally high.33 ,34 Second, unmeasured factors such as tax avoidance and product substitution based on a wide price range may have biased the estimated effect.1 ,35 However, tax avoidance is likely to be low in this setting; Japan's island nation status makes it difficult to avoid tax across national borders. Although low-price tobacco products (eg, the cheap Echo brand) gained market share in Japan after 2010, according to the tobacco industry’s reports,36 the increase was small (0.5% from 2010 to 2011). Therefore, the impact of product substitution may be trivial. Third, we considered the income of the respondents and their spouses, if available, since the income of other family members could not be obtained from the survey. It should be noted that household income, as defined in this study, probably underestimated household income.15
Conclusion
Since recent quitters are likely to relapse,6 ,28 it is important to enhance both promotion of cessation and prevention of relapse. We confirmed that tobacco price rises were significantly associated with increasing cessation among smokers and decreasing relapse among quitters concurrently.1 Furthermore, this price rise was associated with favourable smoking changes in nearly all population subgroups; a large differential impact was not observed across the various subgroups.
What this paper adds
What is already known on this topic?
The impact of tobacco price increases on smoking behaviour in different social groups has been investigated; mixed results have been reported for differences in gender, occupation and education subgroups.
Since few previous studies focused on the impact of price on relapse, longitudinal studies that have examined the effect of tobacco price on both cessation and relapse are scarce.
What this study adds?
Of all the factors surveyed, only the tobacco price increase in 2010 was significantly associated with cessation (100% increase) and relapse (40% decrease).
The tobacco price rise was associated with favourable smoking changes in nearly all population subgroups.
Acknowledgments
The authors thank Dr J Mortimer for her English language editing.
References
Supplementary materials
Supplementary Data
This web only file has been produced by the BMJ Publishing Group from an electronic file supplied by the author(s) and has not been edited for content.
- Data supplement 1 - Online supplement
Footnotes
Contributors TT conceptualised and designed the study, drafted the initial manuscript and revised it, and approved the final manuscript as submitted. TF and TS supervised the data analyses, reviewed and revised the manuscript, and approved the final manuscript as submitted.
Funding This work was supported by the Ministry of Health, Labour and Welfare (grant; Comprehensive Research on Life-Style Related Diseases including Cardiovascular Diseases and Diabetes Mellitus (H25–010)) and the Ministry of Education, Culture, Sports, Science, and Technology (grant-in-aid for Young Scientists B: number 15K19256).
Competing interests None declared.
Provenance and peer review Not commissioned; externally peer reviewed.
Data sharing statement The Ministry of Health, Labour and Welfare, Japan, does not make all the raw data publicly available. However, data are available on request under the 33th article of the Japanese Statistical Law, at Examination Analysis Office, Planning Division, the Statistics and Information Department, Minister's Secretariat, the Ministry of Health, Labour and Welfare, Japan.