Article Text

Abstract
Objective Investigate whether non-daily smokers’ (NDS) cigarette price and purchase preferences, recent cessation attempts, and current intentions to quit are associated with the density of the retail cigarette product landscape surrounding their residential address.
Participants Cross-sectional assessment of N=904 converted NDS (CNDS). who previously smoked every day, and N=297 native NDS (NNDS) who only smoked non-daily, drawn from a national panel.
Outcome measures Kernel density estimation was used to generate a nationwide probability surface of tobacco outlets linked to participants’ residential ZIP code. Hierarchically nested log-linear models were compared to evaluate associations between outlet density, non-daily use patterns, price sensitivity and quit intentions.
Results Overall, NDS in ZIP codes with greater outlet density were less likely than NDS in ZIP codes with lower outlet density to hold 6-month quit intentions when they also reported that price affected use patterns (G2=66.1, p<0.001) and purchase locations (G2=85.2, p<0.001). CNDS were more likely than NNDS to reside in ZIP codes with higher outlet density (G2=322.0, p<0.001). Compared with CNDS in ZIP codes with lower outlet density, CNDS in high-density ZIP codes were more likely to report that price influenced the amount they smoke (G2=43.9, p<0.001), and were more likely to look for better prices (G2=59.3, p<0.001). NDS residing in high-density ZIP codes were not more likely to report that price affected their cigarette brand choice compared with those in ZIP codes with lower density.
Conclusions This paper provides initial evidence that the point-of-sale cigarette environment may be differentially associated with the maintenance of CNDS versus NNDS patterns. Future research should investigate how tobacco control efforts can be optimised to both promote cessation and curb the rising tide of non-daily smoking in the USA.
- Environment
- Cessation
- Price
This is an Open Access article distributed in accordance with the Creative Commons Attribution Non Commercial (CC BY-NC 4.0) license, which permits others to distribute, remix, adapt, build upon this work non-commercially, and license their derivative works on different terms, provided the original work is properly cited and the use is non-commercial. See: http://creativecommons.org/licenses/by-nc/4.0/
Statistics from Altmetric.com
Introduction
The Centers for Disease Control and Prevention's (CDC) National Health Interview Survey found fairly constant rates of intermittent or non-daily smoking between 1993 (18.4% of all smokers) and 2004 (18.7%),1 followed thereafter by an upward trend, with 20.3% NDS in 2008 and 21.6% non-daily smoking in 2012.2 ,3 In 2013, National Health Information Survey approximates that 17.9% of US adults were current cigarette smokers, and of these, 23.0% did not smoke every day,4 indicating that non-daily smoking rates continue to rise, and this upward trend coincides with declines in daily smoking prevalence.1–5
Non-daily smokers (NDS) typically abstain 1 out of every 3 days, as well as during longer periods of sustained abstinence.6 ,7 Data indicate a majority of NDS would like to quit smoking and make quit attempts at rates higher than daily smokers.6 ,8 ,9 While they are typically less nicotine dependent, there is evidence NDS experience cravings to smoke, although patterns of and responses to cravings differ between daily smokers and NDS.10 ,11 Data are mixed regarding the degree to which contextual stimuli are tied to non-daily versus daily smoking,6 ,10 ,12 ,13 but it is clear that NDS are frequently cued to smoke by factors other than nicotine dependence.10 ,11
About half of NDS have previously smoked every day (referred to as ‘converted’ NDS (CNDS)), whereas those who have never smoked daily are ‘native’ NDS (NNDS).6 ,14 ,15 Data suggest CNDS score higher on measures of nicotine dependence, have shorter periods of abstinence, smoke on a greater percentage of days and smoke more heavily on the days they smoke compared with NNDS.11 ,12 ,16 Nonetheless, NNDS report encountering as many smoking restrictions, and attempt to quit at similar frequencies as CNDS.6 The degree to which patterns of non-daily smoking are differentially affected by various smoking restrictions and other policies has particularly important implications for the design and evaluation of ongoing tobacco control programmes, as reduced cigarette use rather than cessation can undermine their impact.
Tobacco control efforts may increase non-daily smoking rates by encouraging conversion to non-daily use among current daily smokers, preventing progression to daily smoking, or both. As more states implement policies that reduce daily smoking prevalence, a growing number of studies have observed an associated rise in non-daily smoking.17–20 Rates of non-daily smoking are generally higher in states with lower overall smoking prevalence, while non-daily rates are lower in states with higher overall prevalence.21 Non-daily smoking has been observed to be greater in the presence of tobacco control policies such as indoor smoking restrictions and cigarette taxation.22 Compared with daily smokers, NDS report the presence of workplace smoking policies at higher rates, and are more likely to restrict smoking in the home, suggesting this group may be more tolerant of smoking restrictions.6 ,23 Consequently, non-daily smoking rates may be less affected by smoking restrictions, due in part to the fact that many smokers are willing to adapt to new restrictions by smoking less.
One way to investigate the degree to which tobacco control efforts differentially affect non-daily smokers is to study the link between factors targeted by tobacco control and corresponding patterns of converted versus native non-daily smoking. Simply because they once smoked daily and tend to smoke more often than NNDS, CNDS may be differentially reliant on the point-of-sale (POS) tobacco environment. Converting to non-daily smoking rather than quitting entirely is more logistically feasible when one has ready access to cigarettes at reduced price points, enabling spontaneous purchases in social situations, for example. In this paper, we utilised a national sample of NDS to study the degree that cigarette price and purchase preferences, recent cessation attempts, and current intentions to quit among NNDS and CNDS are differentially associated with the density of the retail cigarette product landscape within the ZIP code surrounding their residential addresses.
Methods
Participants and procedures
Participants were recruited for this cross-sectional survey through a national, online panel survey service, Survey Sampling International, in 2012. All procedures were approved by the University of Minnesota Institutional Review Board. Details are available in previously published reports.24 ,25 Potential participants provided consent via a cover letter and were then screened for eligibility. Inclusion criterion were self-identification as African-American, Caucasian or Latino (of any race); age 25 years and older; English-speaking; current smokers (smoked in the past 30 days); smoked for at least 1 year; smoked at least 100 cigarettes in their lifetime; and smoked at their current rate (ie, non-daily) for at least 6 months. Exclusion criterion included participating in smoking cessation treatment in the past 30 days, pregnancy and breast feeding in order to ensure a sample of smokers relatively stable at their current smoking level.
The national sample was stratified to obtain equal samples of each of the three race/ethnicity groups across smoking frequency. At baseline, 42 715 participants initiated the enrolment process, 35 666 were ineligible, 4581 discontinued at some point before completing the survey, and 92 duplicate or inconsistent responses were removed. This resulted in a total sample of 2376 participants. Daily smokers were included in the parent study but are not part of the current analysis. The present work focuses on the 1201 NDS who enrolled (904 CNDS and 297 NNDS). Non-daily smokers smoked at least one cigarette on 4–24 days in the past 30 days; persons who smoked on fewer than 4 days in the past 30 days were ineligible. Participant characteristics for the final sample are presented in table 1.
Sample demographics by smoking pattern
Measures
Demographics
Participants reported age, race/ethnicity, gender, highest level of education and monthly household income (dichotomised to <$1800 and >$1800). Participants also indicated their residential ZIP code.
Cigarette use
Participants reported the number of days they smoked in the past month, the average number of cigarettes smoked per day on the days smoked in the past 7 days, the average number of minutes before smoking their first cigarette each morning, and whether they had ever smoked daily for at least 6 months. The number of months/years smoking non-daily, daily and overall were assessed. Responses were coded as missing if the number of years smoking was greater than the participant's age.
Non-daily cigarette use
Smokers were recruited into groups based on their self-reported smoking rate. Non-daily smokers were defined as those who smoked at least one cigarette on 4–24 days in the past 30 days. Those who reported non-daily smoking were also asked how many months/years they have been smoking on some days of the month. To confirm that this was an established, stable non-daily use pattern, participants had to report smoking non-daily for at least the previous 6 months.
Readiness to quit and past quit attempts
Intention to quit was assessed using a single-item measure asking participants ‘What describes your intention to stop smoking completely, not even a puff?’ Response options were ‘never expect to quit,’ ‘may quit in the future, but not in the next 6 months’, ‘will quit in the next 6 months’ and ‘will quit in the next 30 days’.26 To isolate the role of currently held intentions to quit, this variable was recoded to combine the ‘never’ and ‘may quit in the future’ options as equating to zero current intentions. Participants also reported number of quit attempts in the past year lasting at least 24 h, and their longest attempt in the past year.
Price effects on purchase location, brand and use
All NDS were asked (yes/no) whether the price of cigarettes affected the location they usually purchase, the brand they smoke, their decision to smoke less or increased their desire to quit completely.
Access to cigarettes and purchase preferences
Participants were asked whether they usually carry cigarettes (yes/no), and how often they buy versus borrow cigarettes from other people. Participants were also asked how they bought their cigarettes (a carton, pack, one cigarette, roll your own, don't buy cigarettes; adapted from the California Tobacco Survey, 2008).27
National tobacco outlet data set
A national data set of tobacco retailers was created using the North American Industry Classification System (NAICS) codes. Developed by the Office of Management and Budget, NAICS is the standard used by Federal statistical agencies to classify businesses based on their primary activity.28 In 2012, geocoded business list data were obtained from OneSource's (now Avention) Global Business Browser. The following retail categories and corresponding NAICS codes were included: beer, wine and liquor stores (NAICS: 445 310); supermarkets and other grocery stores (NAICS: 44511); convenience stores (NAICS: 44512); pharmacies and drug stores (NAICS: 446110); gasoline stations with convenience stores (NAICS: 44711); other gasoline stations (NAICS: 44719); department stores (NAICS: 452111); discount department stores (NAICS: 452112); and tobacco stores (NAICS: 453991). We reviewed all chain pharmacies and department stores with 50 or more locations to determine if they sold tobacco and excluded them accordingly. Based on this analysis, we excluded all other department stores and pharmacies as they likely do not sell tobacco. Additionally, we excluded major department chains and grocery stores with a policy banning the sale of tobacco products at the time of data collection (ie, Target, Whole Foods, Trader Joe's, Wegmans, etc). We also excluded pharmacies and drug stores in the 55 Massachusetts and 2 California municipalities that banned the sale of tobacco products in pharmacies. The final data set included 269 781 retail outlets.
Access to tobacco outlets
To quantify access to retail outlets, each participant's residential ZIP code was linked to a nationwide retail outlet density surface, generated using static bandwidth kernel density estimation (KDE). This non-parametric method extrapolates from spatially distributed point data by estimating their continuous density with spatial density functions known as kernels, each of which has a circular radius size known as the kernel bandwidth.29 The kernel bandwidth employed here optimised the kurtosis of the overall density surface, such that it was neither too smooth (ie, flat) nor too peaked.30 Gaussian kernels with an fixed 5-mile bandwidth were used to generate the final density surface, from which density estimates could be extracted with a resolution of 250 m.31 The spatial analyst zonal toolset in ArcGIS was then used to calculate the average retail outlet density within all ZIP codes in the USA, and these density values were merged with each participant's corresponding residential ZIP code. Finally, the tobacco outlet density associated with each participant's ZIP code was categorised in quartiles: level 0 (median=0.09 outlets/square mile), level 1 (median=0.55 outlets/square mile), level 2 (median=1.81/square mile) and level 3 (median=5.20 outlets/square mile). Of note, participant clustering within ZIP codes was low; the 1201 NDS in this sample resided in 1054 different ZIP codes, just slightly over an average of one NDS per ZIP code. The spatial distribution of the ZIP codes themselves was spread across the entire USA, appearing reasonably representative, and did not suggest clustering that could bias the results.
Statistical analyses
Given a set of categorical co-variates (NNDS vs CNDS, quit attempts, quit intentions, price sensitivity), along with a highly non-linear, count-based covariate (POS density), generalised categorical data analysis techniques were utilised. For categorical group comparisons, we utilised standard χ2 significance tests. For modelling the effect of the outlet densities, we employed exponential, log-linear modelling techniques developed to analyse multidimensional contingency tables. Log-linear models convert the multiplicative relations among joint and marginal counts in a contingency table to additive, linear associations by transforming the counts to logarithms.32 ,33 The ‘saturated’ log-linear model represents the log frequencies for the cell index (h,i,j,k,l) of all (non-ordinal) combinations of CNDS (vs NNDS) status, quit attempt last year, readiness to quit, tobacco outlet density, and price or purchase preferences (ie, price effects on location, brand and use; tendency to buy vs borrow):

The saturated model corresponds perfectly to the raw data, with the number of parameter estimates equivalent to the total number of cells generated by all interactive combinations of the five factors under study (N=134 cells). A best-in-class model selection process was used to identify the most parsimonious models, defined as the minimal set of parameters that provide an adequate fit to the observed data. Following Selvin,32 the significance of model parameters was assessed by measuring the relative reduction in model fit produced by their removal. Stepping down from the saturated model, we evaluated patterns of conditional independence with sets of hierarchically nested models containing all combinations of four-way, three-way and two-way interaction terms, eventually reaching the mutually exclusive independence model that hypothesises no meaningful association between any of the factors. The systematic comparison of hierarchically nested log-linear models produced a likelihood ratio test statistic presented in the text. To probe significant effects that emerged and to clarify our results, we calculated model-based predicted values (ie, ‘predicted counts’ in figures 1 and 2) that clarify the relative odds of smoker category membership associated with other factors.

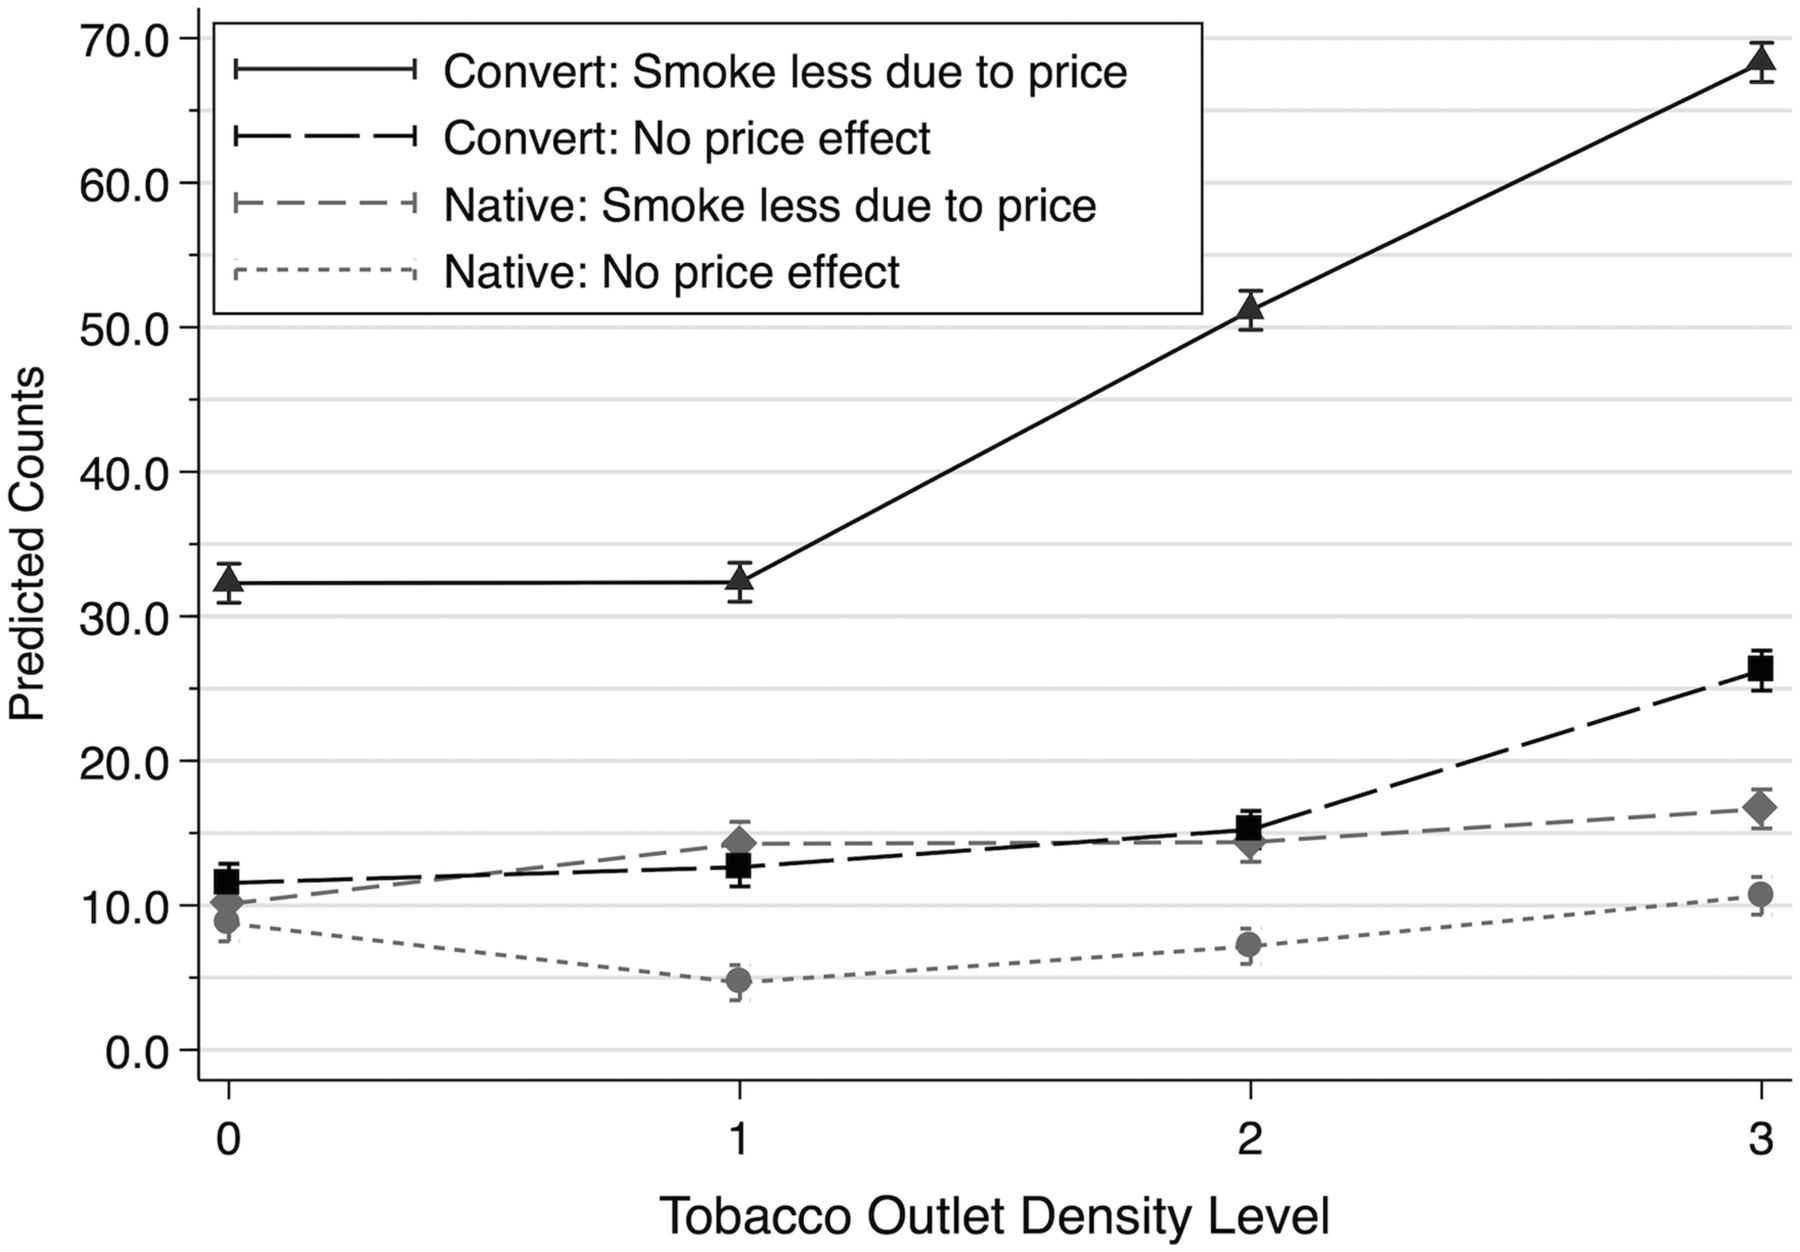
Model-based predicted count of converted versus native non-daily smoking status, plotted as a function of residential tobacco outlet density and price sensitivity.
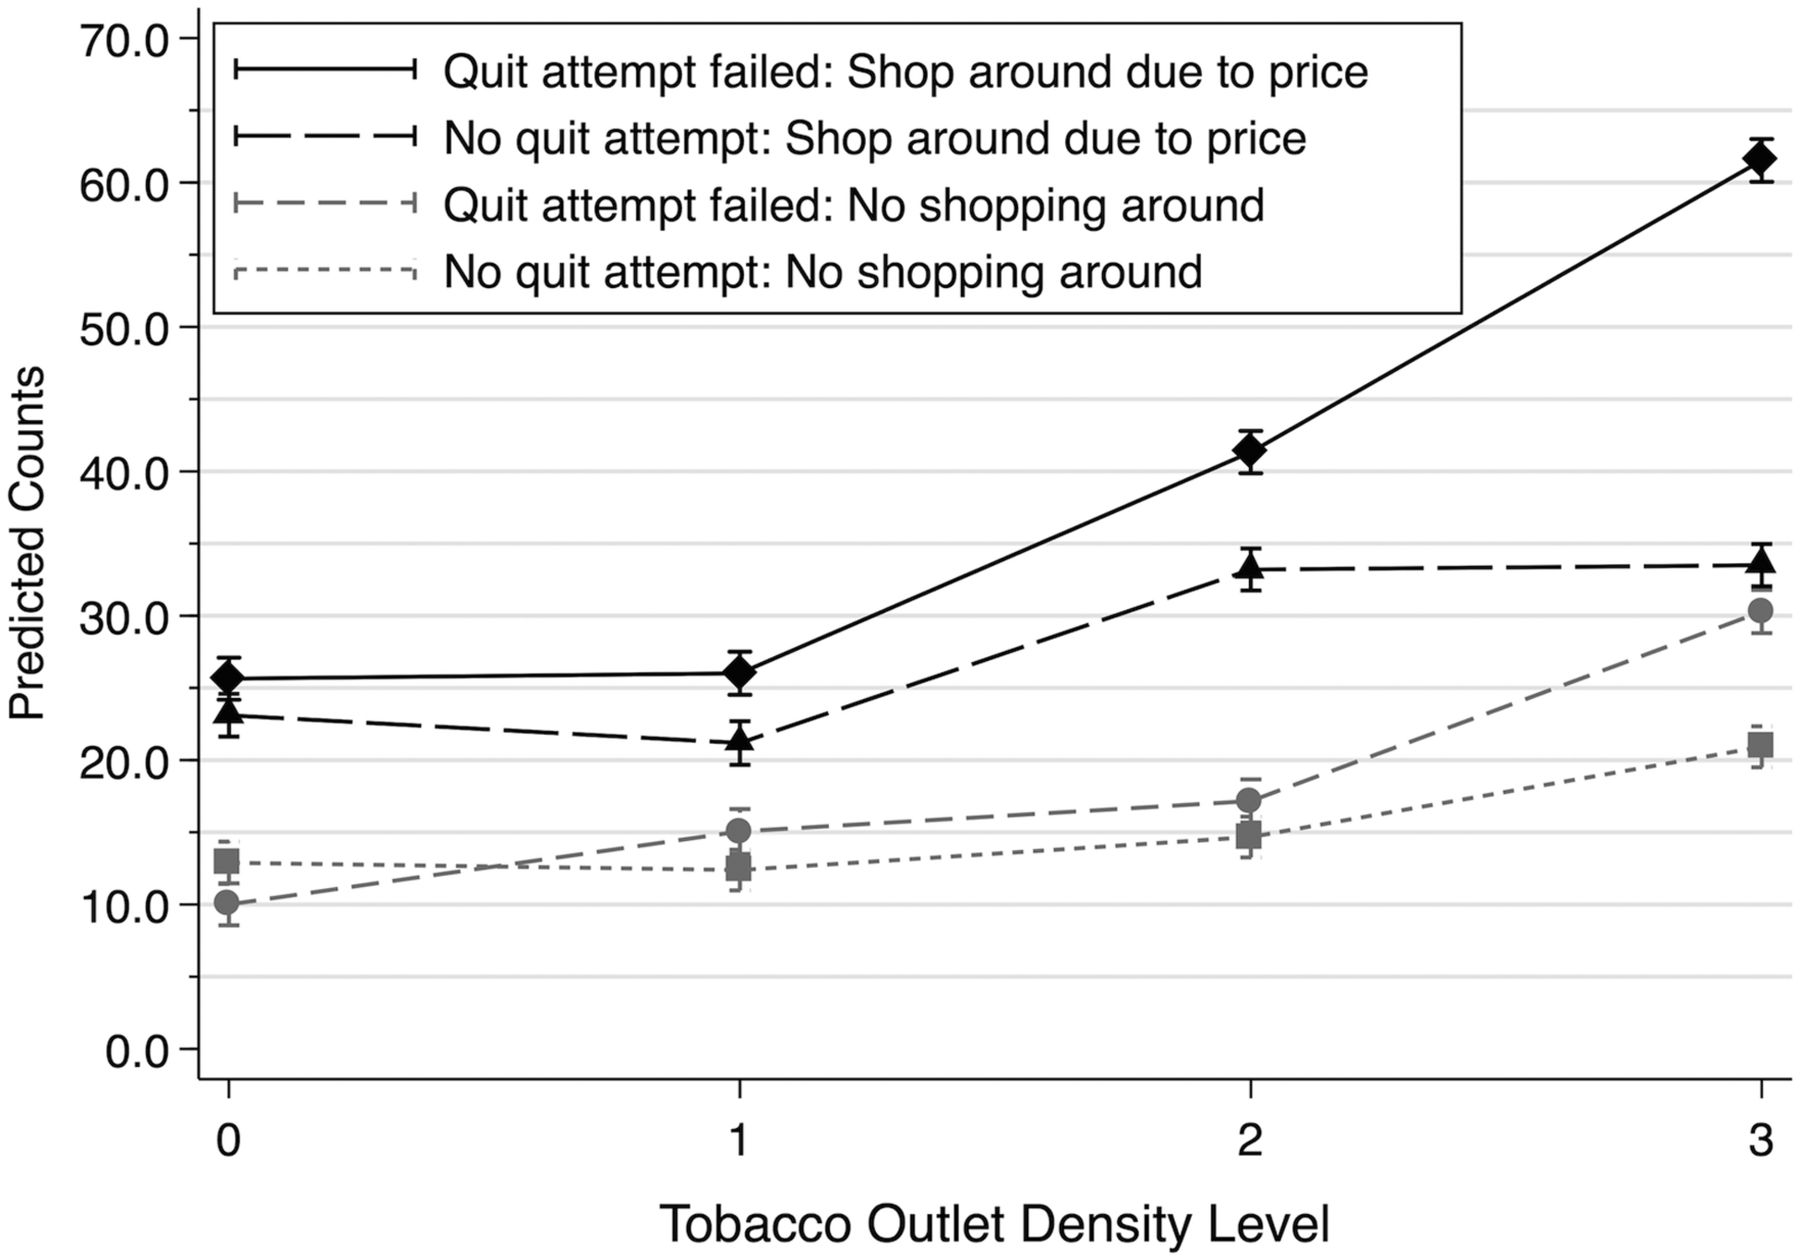
Model-based predicted count of non-daily smoking with and without a past-year quit attempt, plotted as a function of residential tobacco outlet density and willingness to shop around for lower price points.
Results
CNDS versus NNDS patterns
Table 1 presents participant characteristics overall and by smoking pattern. There were eight missing values for the number of years smoking, and four missing values for the number of years as a NDS. Native NDS reported smoking an average of 12.7 years (SD=10.5), about 5 years fewer than CNDS (17.4; SD=14.0), who smoked about 4 years fewer than their light and heavy smoking counterparts. CNDS reported about 9.2 (SD=10.7) years of daily smoking, followed by 11.9 years of NDS (SD=11.7), which was only slightly more than the 10.0 (SD=9.5) years of NDS reported by NNDS. On average, CNDS reported smoking about one more cigarette per day (M=5.9; SD=5.6) than NNDS (M=4.3; SD=3.9) on the days they smoke. Both groups reported smoking about half of the days in each month, with CNDS reporting about two more days per month (M=15.0; SD=5.9) than NNDS (M=13.1; SD=5.9).
Table 2 presents additional information on participants’ smoking behaviour and preferences overall and by smoking pattern. A large proportion of CNDS (50.4%) and NNDS (42.4%) reported buying all of the cigarettes they smoke, while 57.6% of the remaining NNDS reported buying some or most of their cigarettes. Most NDS reported a preference for purchasing packs (76.4%) rather than cartons, and many NDS reported situational restrictions on their smoking, with only about half reporting they regularly carry cigarettes with them, and almost half reporting indoor smoking restrictions at their place of residence.
Smoking behaviour and preferences by smoking pattern
Price effects on purchase location, brand and use
CNDS were much more likely than NNDS to report the price of cigarettes increased their desire to smoke less (χ2(2)=14.07, p<0.001) and quit entirely (χ2(2)=11.93, p<0.001). The likelihood of reporting cigarette price as an influence on the location where cigarettes are purchased, as well as choice of cigarette brand, was similar among NNDS and CNDS.
Quit history and intentions
While only a minority of NDS reported an intention to quit smoking entirely within the next 6 months (39.6%) or 30 days (10.4%), those who made an attempt in the previous year (43.1%) were significantly more likely to hold 6-month (χ2(2)=70.6, p<0.001) or 30-day quit intentions (χ2(2)=14.3, p<0.001). CNDS were more likely to report a quit attempt in the previous year (χ2(1)=20.05, p<0.001) than NNDS, yet there were no differences between groups regarding intentions to try again within the next 6 months.
Overall, NDS with one or more past-year quit attempts were more likely to report the price of cigarettes increased their desire to smoke less (χ2(1)=35.41, p<0.001) and to eventually quit altogether (χ2(1)=84.74, p<0.001). The association between price and past-year quit attempts was stronger among CNDS (χ2(1)=20.16, p<0.001) than NNDS (χ2(1)=10.61, p<0.01), while among NNDS only, those who tried to quit in the previous year were more likely to report the price of cigarettes affected their choice of brand (χ2(1)=6.31, p<0.02).
Both CNDS and NNDS who reported the price of cigarettes increased their desire to reduce the amount they smoke were also more likely to report intentions to try to quit again within the next 6 months (χ2(1)=21.81, p<0.001), but not within the next 30 days. This effect was stronger among CNDS (χ2(1)=13.76, p<0.001), though still significant among NNDS (χ2(1)=8.62, p<0.01). Among CNDS, those reporting the price of cigarettes influenced the location where they purchase cigarettes also had greater 6-month quit intentions (χ2(1)=5.22, p<0.03), whereas the influence of price on brand selection was not a factor for either NDS group.
Tobacco outlet density and NDS
A hierarchical log-linear model selection process was used to identify meaningful associations between the tobacco outlet density within ZIP codes around each participant's residence and their CNDS versus NNDS status, quit attempts last year, current readiness to quit and price or purchase preferences (ie, price effects on location, brand and use; tendency to buy vs borrow). This model selection process revealed that no models with fewer than two or, in some cases, three two-way interactions could provide an adequate fit to the observed data. Table 3 presents the most parsimonious models that accurately predict the observed data in the full five-dimensional matrix. Also included in table 3 is the set of three-way interaction terms that best improve the fit of the most parsimonious models while adding only minimal additional complexity, thus further clarifying the pattern of meaningful associations that explain the observed data. Results reveal CNDS were more likely than NNDS to reside in ZIP codes characterised by higher tobacco outlet density (likelihood ratio test statistic=G2=322.0, p<0.001). CNDS were also more likely than NNDS to buy all of their cigarettes rather than borrow them (table 2), and modelling results indicate buying all cigarettes was significantly associated with greater tobacco outlet density and a recently failed quit attempt (G2=73.3, p<0.001), as well as current intentions to quit within the next 6 months (G2=55.6, p<0.001). Thus, while outlet density may enable buying all cigarettes, the latter is associated with movement (albeit unrealised) towards cessation.
Model selection: tobacco outlet density effects
CNDS living in high-density ZIP codes were more likely to report the price of cigarettes influenced their decision to smoke less (G2=43.9, p<0.001; figure 1) compared with CNDS in lower density ZIP codes and NNDS. CNDS in high-density ZIP codes were also more likely to shop around for better prices (G2=59.3, p<0.001). While models including an interaction with brand selection were found to improve fit to the observed data, graphical inspection of the pattern of results makes it clear the price of cigarettes did not increase willingness to alter brand preferences (if anything, price sensitivity was associated with increased brand loyalty).
NDS with a failed past-year quit attempt were more likely to report price affected their use pattern (G2=16.4, p<0.001) and purchase locations (G2=13.3, p<0.001, figure 2) if they resided in ZIP codes with elevated tobacco outlet density. Parsimonious model selection also indicates NDS who resided in ZIP codes with greater tobacco outlet density were much less likely to hold intentions to quit within the next 6 months when they also reported price affected their use pattern (G2=66.1, p<0.001) and purchase locations (G2=85.2, p<0.001). However, the pattern of results indicates neither tobacco outlet density nor the price of cigarettes increased willingness to switch brands.
Discussion
Data on the way the rapidly evolving POS tobacco product landscape may be influencing emerging patterns of NDS are sparse in the literature. This paper provides initial evidence that the POS cigarette environment may be differentially associated with CNDS versus NNDS patterns.
Results support our hypothesis that CNDS would be more likely than NNDS to reside in ZIP codes with higher outlet density. CNDS living in high-density ZIP codes were more likely to report price influenced their decision to smoke less, and were also more likely to shop around for better prices. These associations are supported by past findings that tobacco outlet density is greater in areas characterised by lower socioeconomic status,34 and members of these communities may be more price sensitive. Findings suggest density and associated price concerns work together to support conversion rather than quitting among CNDS. This could be related to the tendency for CNDS to report the price of cigarettes affects the location they purchase cigarettes, which also increases along with tobacco outlet density. However, neither CNDS nor NNDS reported the price of cigarettes affected their choice of brand.
Smoking histories of CNDS and NNDS also differed. CNDS were more likely than NNDS to report a past-year quit attempt, and CNDS reporting a past-year quit attempt were more likely to report cigarette price influenced the amount they smoke. Additionally, CNDS who reported cigarette price influenced where they purchase cigarettes were more likely to have future quit intentions. The associations between cigarette price, past quit attempts and future quit intentions were stronger among CNDS compared with NNDS, suggesting this group may have a desire to quit smoking, but instead have decreased their smoking and converted from daily smoking to NDS.
A limitation of this paper is NDS classification and outcome measures were self-reported, and therefore subject to reporting biases, as with any survey-based work. Although participants were recruited from a national online panel recruited from across the country, participation was limited to those with internet access and to English speakers. Participants were recruited through voluntary enrolment, as opposed to random sampling, further limiting the generalisability of these results. The degree to which cumulative effects play some role is also unknown, and thus it would be useful for future research to explore the way tobacco use patterns interact with the tobacco product landscape over time. The paper is strengthened by the use of a national data set to assess tobacco outlet density across the country, along with KDE methods, which provide high-quality density estimates despite minor idiosyncratic flaws in the raw outlet data set, such as rolling closures and openings that reduce the precision of any outlet database. Another limitation is the use of ZIP code-level density values, which assume constant exposure and thus do not account for spatiotemporal variation as participants go about their daily activities. Future work using real-time measures of outlet exposure31 could reduce this ‘noise’ and would likely increase the magnitude of the associations documented here.
Conclusions
Increasing rates of NDS in the USA elevate the need to better understand these complex patterns of cigarette use, especially as they seem impervious to traditional tobacco control efforts. Findings from this study suggest that CNDS may be more sensitive to their local tobacco product landscape than are NNDS. This may be because conversion from daily smoking to NDS is a more viable and attractive alternative to cessation for smokers residing in areas with higher outlet density and associated lower prices. Even when retail zoning policies and taxes are enforced, outlet density remains higher in urban areas, increasing opportunities to shop around for prices and to make spontaneous purchases.
Future research should investigate the ways tobacco control efforts can be optimised to curb the rising tide of NDS in the USA. This study suggests that, particularly in dense urban ZIP codes, efforts to regulate the pricing and availability of tobacco products may do more to decrease rates of non-daily conversion among those who might otherwise quit than they will to prevent transitions to NNDS among non-smokers.
What this paper adds
Findings from this work suggest that converted non-daily smokers (CNDS) are more likely to live in ZIP codes of higher tobacco outlet density than native NDS (NNDS), and that CNDS living in high-density ZIP codes are more likely to be price sensitive, as well as less likely to hold intentions to quit smoking in the near future than NNDS.
Methodologically, this paper demonstrates the way information about the tobacco product landscape can be leveraged to improve our understanding of the complex association between tobacco product preferences and use patterns.
References
Footnotes
Contributors TRK and JSA conceived the paper. TRK led the design of the study, processed the data set, conducted the primary analyses and wrote the paper. AA-R, HG and HC contributed to the statistical analyses and the writing of the Methods section. MB, TSS and LRR contributed to study design, writing and revisions to the paper.
Funding This work was funded by Pfizer's Global Research Awards for Nicotine Dependence (JSA). JSA is also supported by the National Institute for Minority Health Disparities (NCMHD/NIH-1P60MD003422). TRK is supported by the National Institute on Drug Abuse, National Cancer Institute and Office of Behavioral and Social Science Research (NIH—R01DA034734). The Norris Cotton Cancer Center's GeoSpatial Resource performed the kernel density estimation procedures.
Competing interests None declared.
Ethics approval University of Minnesota Institutional Review Board.
Provenance and peer review Not commissioned; externally peer reviewed.