Article Text

Abstract
Background There is overwhelming evidence that increases in tobacco taxes reduce tobacco use, save lives and increase government tax revenue. High taxes, however, create an incentive to devise ways to avoid or evade tobacco taxes through contraband tobacco. The associated consequences are significant and call for an accurate measurement of contraband's magnitude. However, its illegal nature makes the levels and trends in contraband intrinsically difficult to measure accurately.
Objective To examine levels and trends in cigarette contraband in Canada.
Methods We employed 2 approaches: first, we contrasted estimates of tax-paid cigarettes sales with consumption estimates based on survey data; second, we used data from several individual-level surveys that examined smokers' purchasing and use behaviours. We placed a particular emphasis on the provinces of Québec and Ontario because existing research suggests that cigarette contraband levels are far higher than in any other province.
Results The estimates presented show a clear upward trend from the early 2000s in cigarette contraband in Québec and Ontario followed by, on the whole, a decreasing trend from about 2007 to 2009. None of the data presented provide support to the narrative that cigarette contraband has been increasing in recent years. Of note are Québec estimates which suggest relatively low levels of cigarette contraband since 2010, at levels no higher than in the early 2000s.
Conclusions The data presented suggest that policies to tackle cigarette contraband introduced from the mid-2000s to late 2000s, at both federal and provincial levels, may have dampened the demand for contraband cigarettes.
- Price
- Taxation
- Illegal tobacco products
This is an Open Access article distributed in accordance with the Creative Commons Attribution Non Commercial (CC BY-NC 4.0) license, which permits others to distribute, remix, adapt, build upon this work non-commercially, and license their derivative works on different terms, provided the original work is properly cited and the use is non-commercial. See: http://creativecommons.org/licenses/by-nc/4.0/
Statistics from Altmetric.com
Introduction
There is overwhelming Canadian and international evidence that increases in tobacco taxes reduce tobacco use, save lives and increases government tax revenue.1–8 However, high taxes create an incentive for tobacco users, manufacturers and others, most notably criminal networks, to devise ways to avoid or evade tobacco taxes. Tax avoidance by tobacco users involves legal purchasing behaviour such as cross-border shopping, duty-free shopping and internet purchases.9 Tax avoidance by manufacturers includes changing their products and prices with the objective of reducing their tax liability. Tax evasion involves illegal methods of eluding tobacco taxes. In Canada, methods of tax evasion can involve illicit trade or production of counterfeit or genuine tobacco products (traditionally called contraband) without proper licensing.10 In Canada, contraband cigarettes are typically cigarettes sold on First Nations Reserves or through clandestine networks operating off-reserves, without the collection of federal and provincial taxes. A large proportion of illicit cigarettes are believed to originate from the Akwesasne/Saint Regis Reservations which border the provinces of Ontario and Québec and the state of New York, and the Six Nations Reserve in southwestern Ontario.11
The illegal nature of cigarette tax evasion makes it intrinsically difficult to measure accurately. The magnitude of cigarette contraband can be estimated by comparing estimates of tax-paid cigarettes sales based on production, trade or tax revenue data with consumption estimates based on survey data while taking into account under-reporting.12–14 This approach has been used by researchers in Canada and the USA and by tax authorities in the UK in an attempt to identify trends in cigarette contraband.15–18 To measure the level of cigarette contraband, self-reported information obtained from survey data can be used such as collecting via questionnaire the source of a smoker's last or usual purchase of cigarettes (eg, purchasing cigarettes from First Nations Reserves in Canada). Information gathered by interviewers during face-to-face interviews or mail-in pack surveys can also provide key insights into tax evasion behaviours by revealing non-standard or missing health warnings, tax stamps or authenticity labels. For example, in Thailand, in an examination of the health warnings on packages during face-to-face interviews, the absence of warnings or warnings in a language other than Thai revealed whether cigarettes were likely to have been legally purchased or not.19 A similar approach was used in Taiwan where cigarette packs not bearing the tax seal served as an indicator of tax evasion based on telephone interview self-reports.20 In addition, the inspection of discarded cigarette packs or cigarette butts can be used to determine whether all taxes have been paid. This approach has been recently used in France,21 Canada,22 ,23 the USA,24 ,25 the UK26 and Warsaw, Poland.27
In Canada, the problem of cigarette contraband is substantial. Physicians for a Smoke-Free Canada, a non-governmental organisation, compared estimates of tax-paid cigarettes sales with consumption estimates from survey data, and estimated that about 10% of all cigarettes consumed in Canada escaped taxation in the early 2000s, jumping to between 23% and 30% in 2007 and 2008 (about 40% in Ontario and Québec) before gradually decreasing to between 14% and 20% in 2011.18 ,28 Euromonitor, a market research firm, estimated the Canadian cigarette contraband market to about 16% in 2005, peaking at 25% in 2008 and declining to 17% in 2013.29 Euromonitor illicit trade data, as data put forth by the tobacco industry and its allies such the National Coalition Against Contraband Tobacco (NCACT) and convenience stores associations, should be interpreted with caution. Blecher et al 30 examined Euromonitor data for Mexico and South Africa and found striking inconsistencies between country-specific estimates for the same years published in different editions of the report. It appears that Euromonitor retroactively adjusted its estimates to fit the tobacco industry narrative that increases in excise taxes caused increases in illicit trade.
A number of studies provide an array of estimates of the Canadian cigarette contraband market based on survey data. One study reported that in 2005–2006, of current Ontario smokers 12% usually and 26% recently purchased cigarettes on First Nations Reserves.31 ,32 Another study presented national trends between 2002 and 2011 in the percentage of respondents reporting a First Nations Reserve as the source of their last purchase of cigarettes showing a clear upward trend from about 2% in 2002 to 10% in 2007/2008.33 Recent estimates suggest conflicting trends. One set of self-reported data suggested a steep increasing trend in cigarette contraband in Canada, and Ontario in particular, peaking at about 40% in late 2014,34 while other estimates suggested that cigarette contraband in Ontario actually declined by more than 1/3 from 2008 to 2012.35
The use of contraband cigarettes in Canada is not limited to adult smokers. A study found that in 2006, 8% of Canadian youth who were current smokers reported that their usual brand of cigarettes was contraband while another study reported a figure of 13% among Canadian youth daily smokers (22% in Ontario and Québec).36 ,37 In 2009, 43% of cigarettes consumed by Ontario high school daily smokers were contraband.38
National and provincial tax, revenue and statistical agencies occasionally report cigarette contraband estimates. However, methodologies used are either not reported, unclear or overly simplistic. Estimated trends in the share of contraband in total tobacco sales from the early 1990s to 2011 by Statistics Canada show a clear upward trend from the late 1990s (about 10%) to 2008 and 2009 (about 39%) followed by a small decline to about 32% in 2010 and 2011.39
The scattered and at times conflicting estimates combined with the tobacco industry's narrative that cigarette contraband has been increasing in recent years warrant a more systematic and transparent approach to examine cigarette contraband in Canada. Our objective is to broaden and expand the work that has been done to date in order to better understand levels and trends in the magnitude of cigarette contraband in Canada. We placed a particular emphasis on the provinces of Québec and Ontario because existing research, briefly reviewed above, suggests cigarette contraband levels in these provinces are far higher than in any other province.
Methods
We employed two approaches to examine levels and trends in cigarette contraband. First, we compared estimates of tax-paid cigarette sales with consumption estimates based on survey data. As a measure of tax-paid sales, we used cigarette sales wholesale data as reported by tobacco manufacturers to Health Canada. We calculated self-reported cigarette consumption using data from two large national surveys, the Canadian Community Health Survey (CCHS) and the Canadian Tobacco Use Monitoring Survey (CTUMS)—renamed Canadian Tobacco, Alcohol and Drugs Survey (CTADS) in 2013. Under-reporting of self-reported cigarette consumption is well documented.13 Consequently, total cigarette sales typically exceed self-reported cigarette consumption. If there is little or no year-to-year change in the under-reporting of cigarette consumption, large swings in the difference between sales and self-reported consumption may indicate changes in the use of contraband cigarettes.
Second, we used data from several individual-level surveys. We used responses to survey questions relevant to purchases from First Nations Reserve or more generally to cigarette that may have been smuggled (as reported by respondents). We used 10 waves of CTUMS/CTADS conducted between 2004 and 2013, 9 waves of the International Tobacco Control Policy Evaluation Project (ITC) Canada surveys conducted between 2002 and 2014 and 5 waves of the Ontario Centre for Addiction and Mental Health (CAMH) monitor conducted between 2008 and 2013 and examined purchases of First Nations Reserve cigarettes or cigarettes that may have been smuggled. We also examined youth's use of contraband cigarettes using the last four waves of the Youth Smoking Survey (YSS) conducted between 2006–2007 and 2012–2013 and the last three waves of the Ontario Student Drug Use and Health Survey (OSDUHS) conducted in 2009, 2011 and 2013. Methodological details and additional figures are provided in online supplementary appendix.
Supplementary appendix
Results
Table 1 presents a roadmap of the data sources we used and associated figures. Figure 1 presents national and provincial estimates for Québec and Ontario for the ratio of self-reported cigarette consumption from CCHS and CTUMS/CTADS survey data to tax-paid cigarette sales, standardised to the ratio in 2001, the first year when data were available for both surveys. The top panels present estimates that used CCHS data to calculate self-reported consumption while the bottom panels used data from CTUMS/CTADS. A rising index indicates either an increasing share of illicit cigarette sales or a decrease in the under-reporting of self-reported cigarette consumption. These data show relatively little change in the early 2000s interrupted by a clear upward jump around 2005, and followed with a decreasing trend from about 2007 to 2009. Estimates for Québec and Ontario show similar trends but with greater magnitude. At its peak in 2007, the ratio of self-reported cigarette consumption from the survey data to tax-paid cigarette sales was between 30% and 40% higher relative to 1999–2001 in Québec and Ontario. The same estimates for Alberta and British Columbia (see online supplementary figure A1) where contraband has not been perceived as a problem, remained more or less stable through time suggesting no substantial changes in either under-reporting or contraband.
Supplementary figures
Roadmap of data sources and associated figures

Trends in the cigarette illicit market in Québec, Ontario and Canada, 1999–2013 (2001=100). Note: estimates based on the ratio of self-reported cigarette consumption to licit cigarette sales as reported by manufacturers to Health Canada. A rising index indicates either an increasing share of illicit cigarette sales or a decrease in the under-reporting of self-reported cigarette consumption; error bars represent 95% CIs. Source: Health Canada, CCHS, CTUMS/CTADS. CCHS, Canadian Community Health Survey; CTADS, Canadian Tobacco, Alcohol and Drug Survey; CTUMS, Canadian Tobacco Use Monitoring Survey.
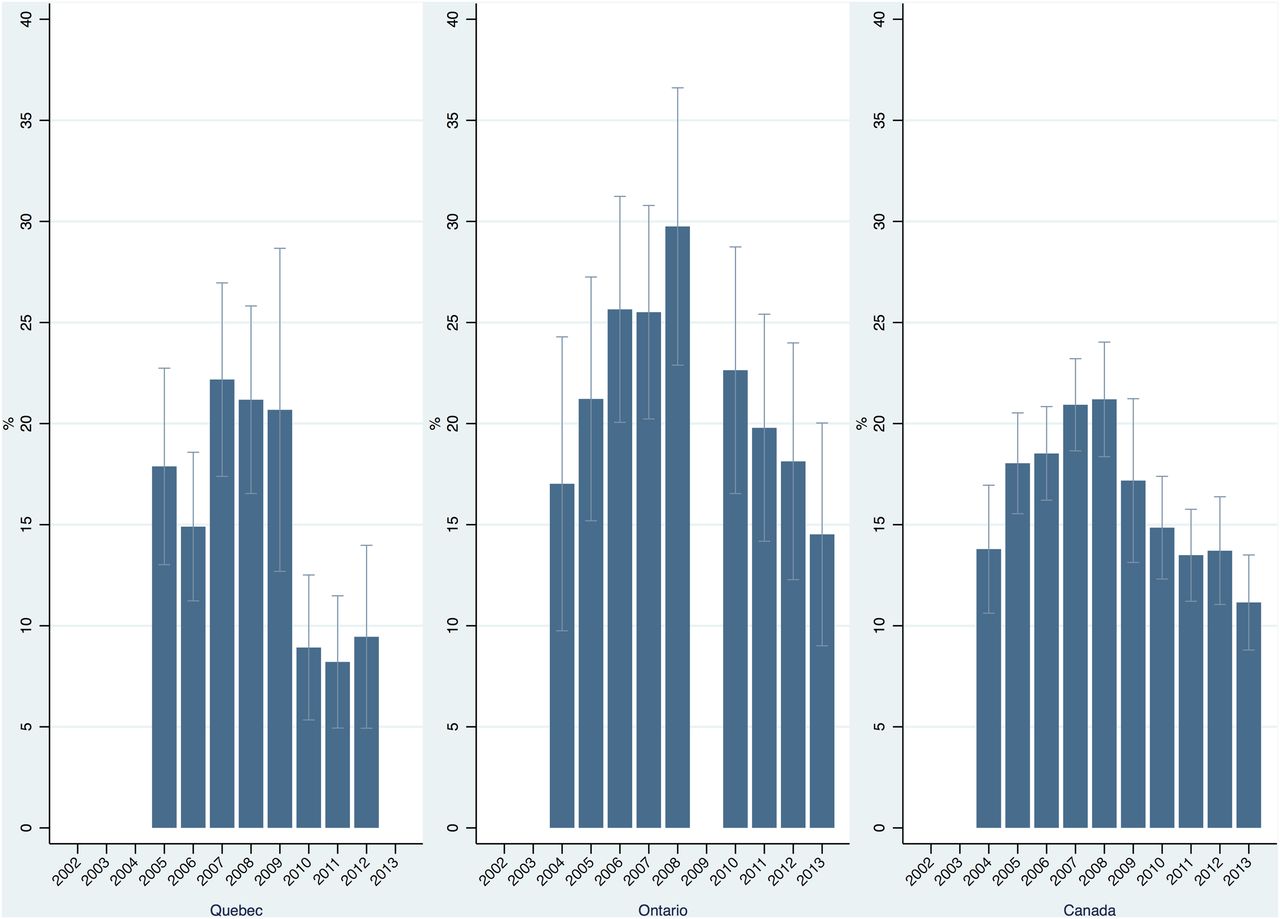
Percentage of smokers reporting any purchases in the past 6 months of First Nations Reserve cigarettes or cigarettes that may have been smuggled, Québec, Ontario and Canada, 2004–2013. Note: estimates for Québec (2004 and 2013) and Ontario (2009) are not reportable due to high sampling variability; estimates for Québec (2009–2012) and Ontario (2004) should be interpreted with caution due to moderate sampling variability; error bars represent 95% CIs. Source: CTUMS (2004–2012), CTADS (2013). CTADS, Canadian Tobacco, Alcohol and Drug Survey; CTUMS, Canadian Tobacco Use Monitoring Survey.
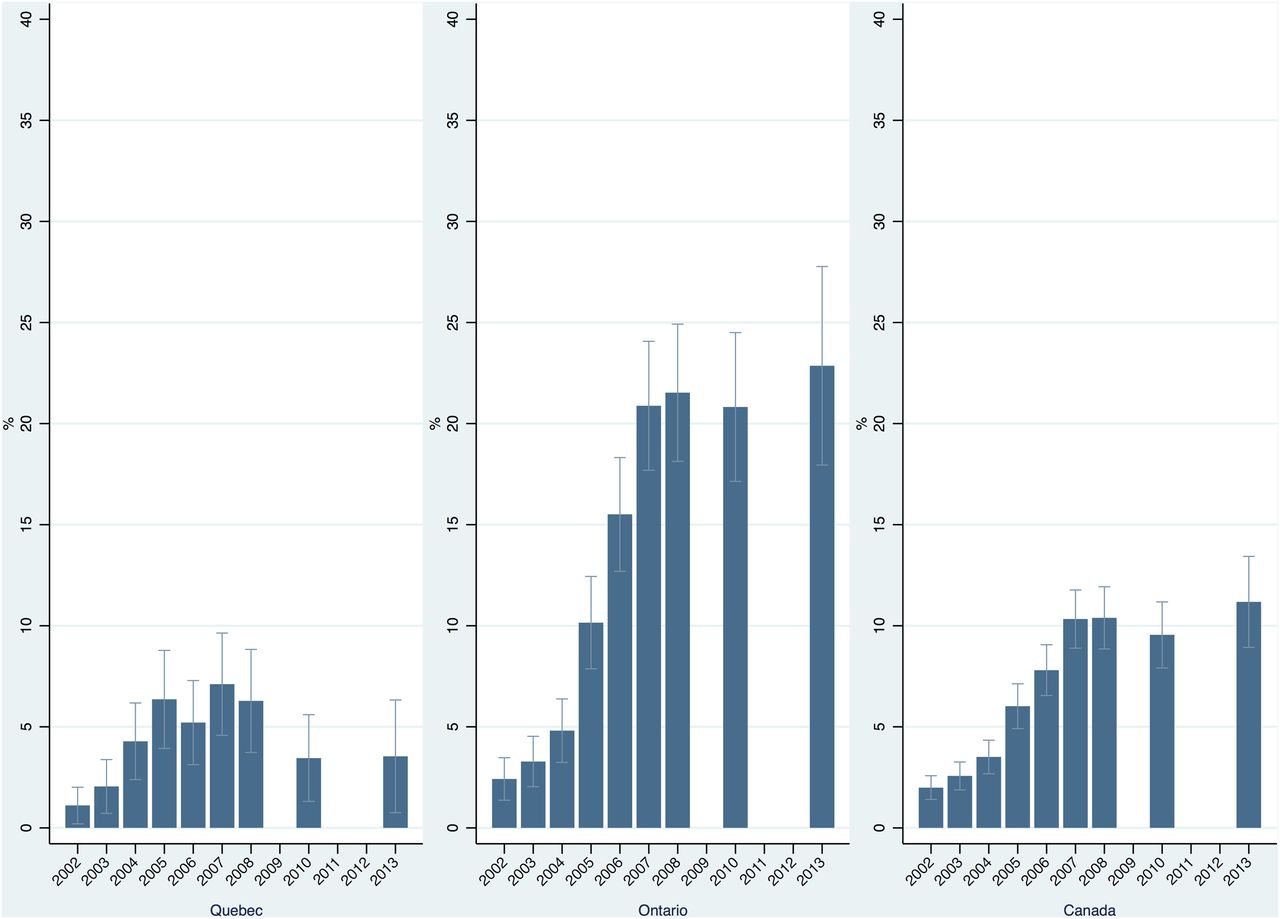
Percentage of smokers reporting a First Nations Reserve as the source of their last purchase of cigarettes, Québec, Ontario and Canada, 2002–2013. Note: data were collected between November and December 2002 (wave 1), May and September 2003 (wave 2), June and December 2004 (wave 3), October 2005 and January 2006 (wave 4), October 2006 and February 2007 (wave 5), September 2007 and February 2008 (wave 6), October 2008 and July 2009 (wave 7), July 2010 and June 2011 (wave 8), and February 2013 and August 2014 (wave 9); error bars represent 95% CIs. Source: ITC-Canada surveys. ITC, International Tobacco Control Policy Evaluation Project.
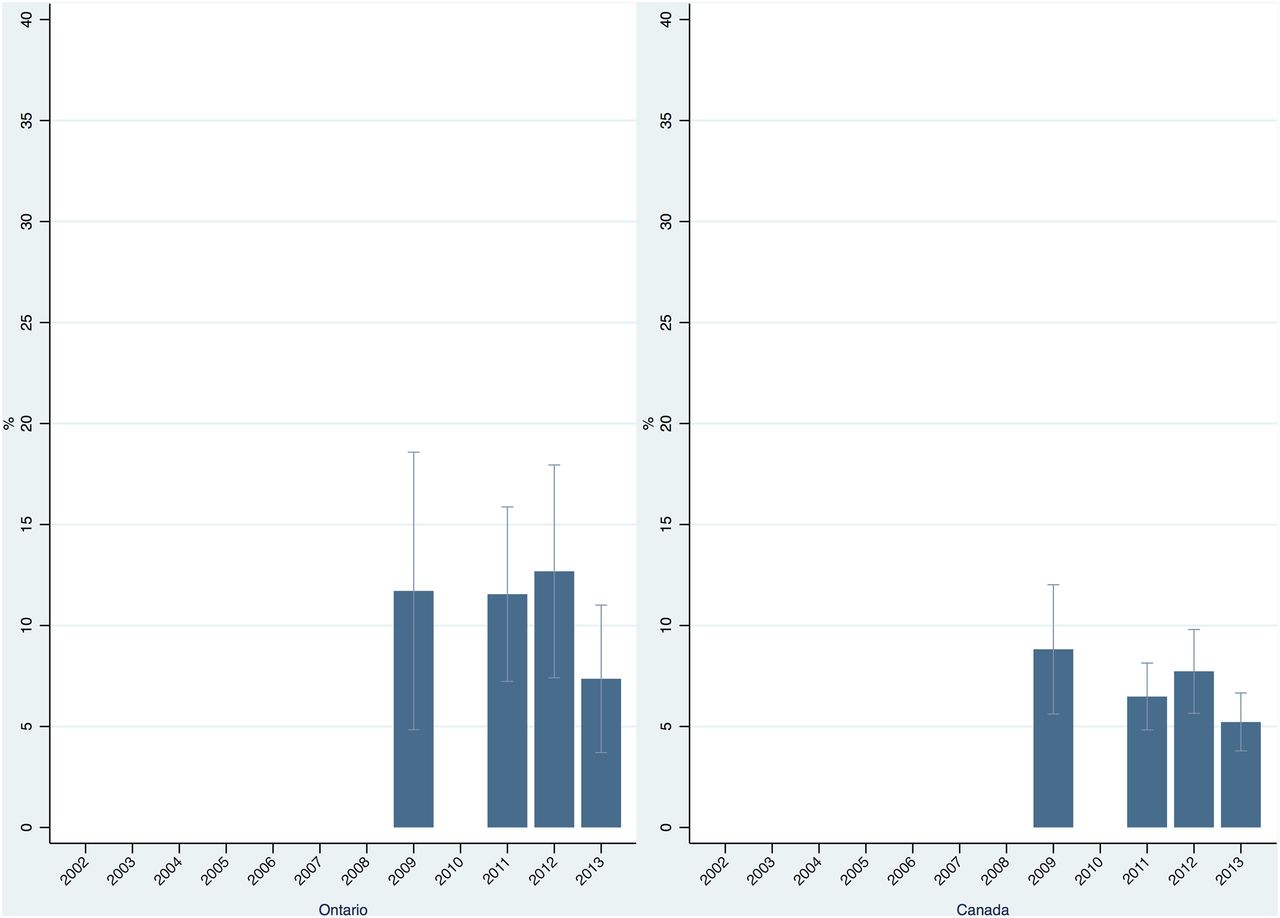
Cigarette consumption from First Nations Reserves as a proportion of total cigarette consumption, Ontario and Canada, 2009, 2011–2013. Note: estimates for Québec are not reportable due to high sampling variability; estimates for Ontario (2009, 2011–2013) and Canada (2009) should be interpreted with caution due to moderate sampling variability; error bars represent 95% CIs. Source: CTUMS (2009–2012), CTADS (2013). CTADS, Canadian Tobacco, Alcohol and Drug Survey; CTUMS, Canadian Tobacco Use Monitoring Survey.

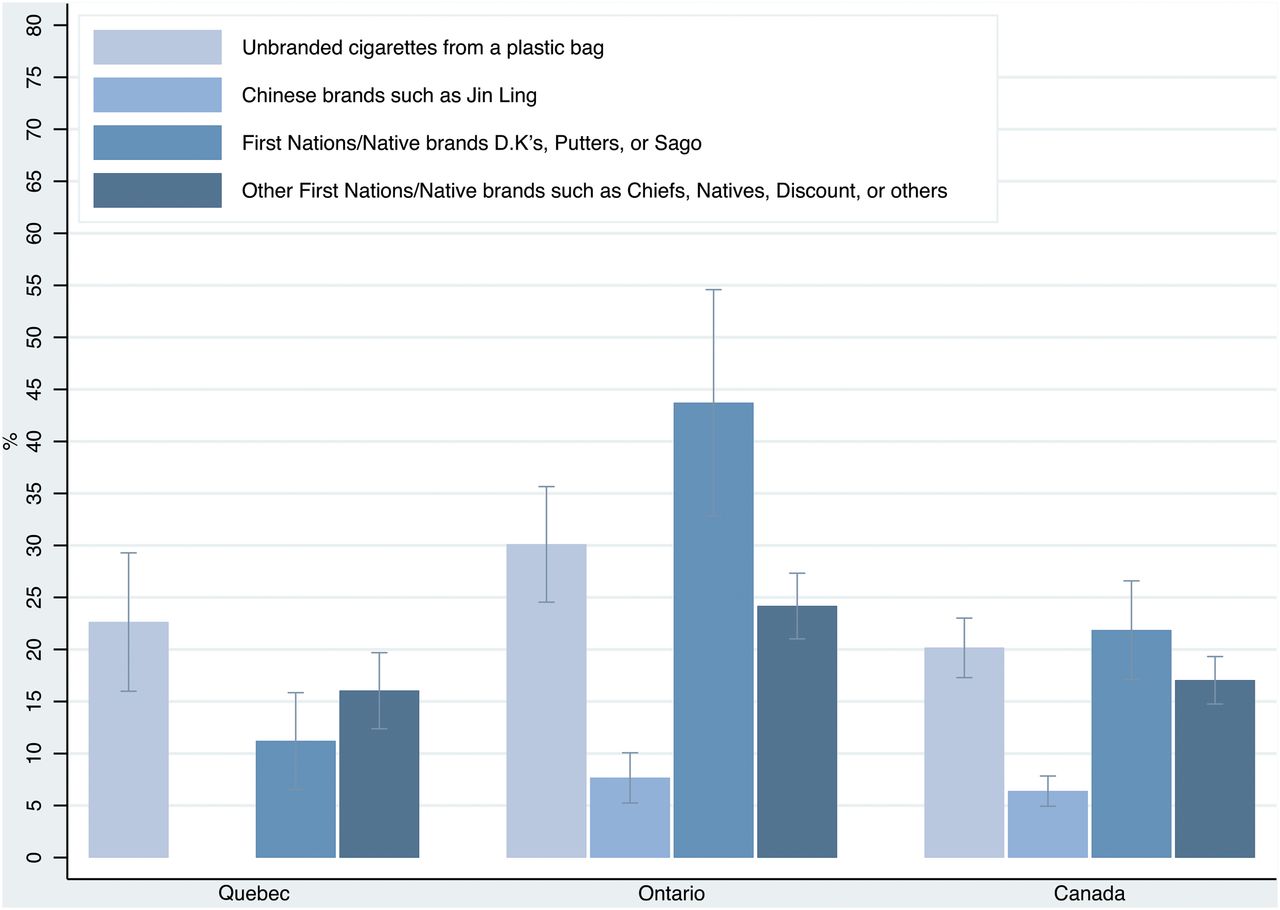
Percentage of youth current smokers who smoked contraband cigarettes at least once a month, by type of cigarettes, Québec, Ontario and Canada, 2010–2011. Note: estimate for Québec (Chinese brands such as Jin Ling) is not reportable due to high sampling variability; estimate for Québec (First Nations/Native brands D.K's, Putters or Sago) should be interpreted with caution due to moderate sampling variability; error bars represent 95% CIs. Source: YSS. YSS, Youth Smoking Survey.
It is important to note that these estimates represent trends in cigarette contraband and not actual levels of illicit consumption. To obtain an estimate of the levels of cigarette contraband, assumptions about the actual level of under-reporting have to be made. For example, CCHS data from Alberta and British Columbia and early 2000s data from Ontario suggest that self-reported consumption represented about 65% of tax-paid consumption (the equivalent figure for CTUMS data is about 50–60%). Using this estimate for under-reporting would suggest that, in Ontario, about 28% of total cigarette consumption was composed of contraband cigarettes in 2007 and 2009, decreasing to about 18–20% in 2010 and 2011, and dropping further to about 11% in 2013. Assuming that self-reported consumption represented about 60% of tax-paid consumption raises the Ontario estimate to about 33% in 2007 and 2009, 25% in 2010 and 2011, and 18% in 2013.
The per cent of smokers who purchased First Nations Reserve cigarettes or smuggled cigarettes showed a clear upward trend from 2004 to 2007–2008, followed by a decrease (figure 2). At its peak, about 30% of Ontario and 22% of Québec smokers reported having bought cigarettes on a First Nation Reserve or cigarettes that may have been smuggled in the past 6 months. Of note are the relatively low Québec estimates since 2010 (<10%). It is important to note that these figures do not show the volume of cigarettes purchased on First Nation Reserves or cigarettes that may have been smuggled. These data represent 6-month prevalence estimates and may include individuals who have bought cigarettes on a First Nation Reserve or cigarettes that may have been smuggled only once in the past 6 months.
Starting in 2009, CTUMS also asked respondents about their usual source of cigarettes; however, due to high sampling variability, provincial estimates are not reportable. Between 2009 and 2012, about 5% of Canadian smokers reported usually getting their cigarettes from First Nations Reserves, decreasing to about 2.4% in 2013 (see online supplementary figure A2).
Estimates from the ITC survey show a similar upward trend up to 2008 but with lesser magnitude, which is expected since the question asks about the ‘last purchase’ as opposed to ‘any purchases in the past 6 months’ (figure 3). Of note, estimates for Québec are low (<10%) in every ITC wave. Unlike CTUMS/CTADS data, however, the ITC data do not show a substantial decrease between 2008 and 2013. Online supplementary figure A3 presents similar estimates from the Ontario CAMH monitor for the period 2008 to 2013. Both data sources show a similar trend but CAMH estimates are somewhat lower than ITC estimates.
Other survey data allow for the estimation of the volume (prevalence×intensity) of cigarette consumption from First Nations Reserves (see online supplementary appendix). Approximately 12% of all cigarettes consumed in Ontario in 2009, 2011 and 2012 came from First Nations Reserves, decreasing to <8% in 2013 (figure 4). National estimates fall in a relatively narrow range, between 5% and 10%.
Results for youth tobacco smokers
Between 2006–2007 and 2010–2011 in Québec and Ontario, between 12% and 16% of youth who smoked a usual brand often smoked cigarettes from First Nations Reserves (see online supplementary figure A4). Between 2008–2009 and 2012–2013, about 84–88% of Ontario youth daily smokers reported having smoked cigarettes from Native Reserves (see online supplementary figure A5).
Data from YSS for 2010–2011 allow for a closer look at the smoking intensity of First Nations or Native brands. In Ontario, current youth smokers (ie, respondents who smoked in the last month) reported having smoked First Nations/Native brands at least once a month (14%), weekly (17%) or daily (18%) in the past 12 months (see online supplementary figure A6). Nationally, <10% of current youth smokers had smoked First Nations/Native brands at least once a month, weekly or daily. Online supplementary figure A7 presents the same data for smokers (ie, respondents who ever tried smoking a cigarette, even just a puff). These data show that of youth ever-smokers in Ontario about 10% smoked First Nations/Native brands weekly and 7% smoked these brands daily. Figure 5 presents data on cigarette smoking that likely entail tax evaded cigarettes among current youth smokers. These data show that the most popular tax evaded cigarettes among Canadian youth were unbranded cigarettes from a plastic bag and First Nations/Native brands. Of note is the high number of current Ontario youth smokers who smoked such cigarettes at least once a month. Online supplementary figure A8 presents the same data for ever-smokers.
Discussion
Secondary analyses of multiple surveys show a clear upward trend in contraband cigarette in Québec and Ontario followed by, in most surveys, a decreasing trend from about 2007 to 2009. None of the results support the tobacco industry's narrative that cigarette contraband has been increasing in recent years. Of note are Québec estimates which suggest relatively low levels of cigarette contraband since 2010, at levels no higher than in the early 2000s. The data we presented contradict Statistics Canada estimates which suggest that the Canadian cigarette contraband market was 2–3 times larger in 2010 and 2011 than it was in 1998–2003. Similarly, the most recent estimates from Statistics Canada for 2010 and 2011 that about 32% of the cigarette market is from contraband cigarettes appear to be too high by a factor of at least two. Although few Canadian students consume cigarettes regularly, a non-negligible number of Québec and Ontario students usually smoked First Nations or Native brands.
The above figures should be put into the broader context of tax evasion. Between 1992 and 2011, the estimated share of the underground economy in the Canadian economy ranged between 2% and 3% and illegal tobacco was estimated to account for 5.1% of total underground economic activities in 2011.39 It is estimated that roughly 14–19% of Canada's gross domestic product was unreported in 1998 and 2004 and that ∼35–50% of households under-reported at least some income.40 The Québec government estimated that about 10% of the tobacco sector evaded taxation, while other sectors such as construction and renovation, restaurants, alcoholic beverages and vehicle maintenance showed larger tax losses (between 14% and 20%).41
After the well-documented massive cigarette tax reductions in the early 1990s (eg, Ontario decreased its tax rate from $C0.065 to $C0.017 per cigarette stick), taxes slowly increased until the early 2000s.5 From about 2000/2001, the rate of increase in cigarette taxes accelerated. In Ontario, cigarette taxes rapidly increased from 0.0365 to 0.045 in 2001, 0.086 in 2002, 0.0985 in 2003, 0.111 in 2004 and 0.1235 in 2006. This period of rapid cigarette excise tax increases ended in 2006; from 2006 to 2014, the cigarette excise tax rate in Ontario remained at $C0.1235 per stick.42 Excise cigarette taxes in Québec followed a similar trend. From 2000 to 2004, cigarette taxes rapidly increased from 0.043 to 0.103 and remained at $C0.103 per stick until 2011. The rate was subsequently increased to 0.106 and 0.109 in 2011 and 0.129 in 2012.43 ,44 Trends in cigarette prices in Québec and Ontario closely followed changes in excise taxes.45 The increase in excise cigarette taxes in Québec and Ontario in the early 2000s coincides with the increase in cigarette contraband we documented in figures 1 ⇑–3. The decrease (or at least levelling-off) in cigarette contraband observed seems to lag the levelling-off in cigarette taxes by at least a few years which may suggest that policies introduced to tackle cigarette contraband from the mid-2000s to late 2000s, may be a more plausible explanation for the observed trends in cigarette contraband.
Strengths and limitations
Unlike existing studies that typically rely on a single methodological approach based on one data source, often using few or just a single survey wave, we took a systematic and transparent approach and used different methods and multiple data sources. In particular, we used all available data from 1999 to the most recent data available as of August 2015. Additionally, unlike many existing studies that present only point estimates, we took great care to present uncertainty intervals around all our estimates. A previous approach assumed that consumption per smoker remained the same as it was in 2000–2001 and effectively obtained ‘upper bound’ estimates (ie, any decrease in consumption per smoker was attributed to contraband).18 In contrast, we used information on smoking rates and quantity consumed.
For the difference between tax-paid sales and self-reported consumption to suggest changes in the use of contraband cigarettes, under-reporting of self-reported cigarettes needs to remain relatively constant between survey waves. Large fluctuations in under-reporting over time would make it impossible to disentangle changes in contraband from changes in under-reporting. Such large fluctuations are, however, unlikely. A recent systematic review found no trend of increasing or decreasing bias in the accuracy of reported estimates over time in studies that examined the relationship between self-reported and cotinine-assessed smoking status.46 Moreover, a recent Canadian study using urinary cotinine concentrations to assess the validity of self-reported cigarette smoking concluded that self-reported measures provided accurate estimates of smoking status.47 Nevertheless, even if the number of smokers is measured accurately, under-reporting of cigarette consumption by smokers could have increased. This is also unlikely as changes in smoking intensity have been relatively small since the mid-2000s. Consequently, the decreasing trend in cigarette contraband observed since the late 2000s is unlikely due to a decrease in the under-reporting of self-reported cigarette consumption. As is the case with most self-reported measures, social desirability bias cannot be ruled out. Cigarette contraband, an illegal activity, may be particularly affected.48 However, even if point estimates are affected, it is unlikely that social desirability has changed appreciably over the past 15 years to affect the direction of the trends suggested by the data presented. Finally, a number of estimates, notably for youth populations are not reportable due to high sampling variability or should be interpreted with caution due to moderate sampling variability.
Conclusion
Our results suggest that policies introduced to tackle cigarette contraband from the mid-2000s to late 2000s, at both federal and provincial levels, may have dampened cigarette contraband. In 2007, the federal government renewed its Canada's Federal Tobacco Control Strategy. An important component of the renewed Strategy was the implementation of programmes to tackle contraband tobacco. For example, Public Safety Canada established the ‘First Nations Organized Crime Initiative’ and the Royal Canadian Mounted Police launched the ‘Contraband Tobacco Enforcement Strategy’ which led to the creation of the ‘Task Force on Illicit Tobacco Products’.49–51 At the provincial level, Québec introduced a number of legislative measures including measures to better control and track raw tobacco, higher fines and new powers at municipal level.43
Unlike previous YSS waves that asked several relevant questions, the 2012–2013 wave included only a single and very narrow question related to cigarette contraband (see online supplementary figure A9). This is unfortunate as YSS (now called the Canadian Student Tobacco, Alcohol and Drugs Survey (CSTADS)) is the only national survey with a specific focus on youth smoking. Given that the validity of some of our estimates rely on under-reporting of self-reported cigarettes remaining relatively constant over time, assessing trends in the validity of self-reported smoking measures would contribute to our understanding of cigarette contraband in Canada. Three cycles of the Canadian Health Measures Survey conducted between 2007 and 2013 contain self-reported smoking status information as well as a measure of urinary cotinine, a biomarker of exposure to tobacco smoke, which can be used to assess the validity of self-reported smoking. An analysis of these data would be beneficial. Finally, the methods we used can be easily replicated in a number of countries, including many low-income and middle-income countries that conduct regular health surveys. For countries that are awash in data such as Canada, we feel that using a systematic approach that uses all available data and reports uncertainty intervals is warranted.
What this paper adds
There is overwhelming evidence that increases in tobacco taxes reduce tobacco use. High taxes, however, create an incentive to devise ways to avoid or evade tobacco taxes.
The illegal nature of tax evasion makes it intrinsically difficult to measure its levels and trends accurately.
Employing complementary methods and a number of data sets, we constructed annual point estimates and 95% CIs of cigarette contraband in Canada with particular focus on the provinces of Québec and Ontario from 1999 to 2013. None of the data presented provide support to the tobacco industry narrative that cigarette contraband has been increasing in recent years.
Acknowledgments
The authors thank Alexandra Joukova, Nghia Nguyen and Dennis Ren for their research assistance and N Bruce Baskerville, Pete Driezen, Mathieu Poirier and members of McMaster University's Polinomics Group for their comments and discussion. The authors are grateful to Rita Luk, Bo Zhang and Shawn O’Connor for providing the Ontario Centre for Addiction and Mental Health (CAMH) monitor and the Ontario Student Drug Use and Health Survey (OSDUHS) estimates and to the International Tobacco Control Policy Evaluation Project (ITC) for data access. Some data used for this research was taken from Health Canada’s Youth Smoking Survey (YSS; newly named Canadian Student Tobacco, Alcohol and Drugs Survey (CSTADS)), which was conducted for Health Canada by the Propel Centre for Population Health Impact at the University of Waterloo. Health Canada has not reviewed, approved, nor endorsed this research. Any views expressed or conclusions drawn herein do not necessarily represent those of Health Canada. The ITC Canada Project is supported by grants from the Roswell Park Transdisciplinary Tobacco Use Research Centre (R01 CA 100362 and P50 CA111236), the US National Cancer Institute (P01 CA138389 and the Canadian Institutes of Health Research (57897, 79551 and 115016).
References
Footnotes
Contributors GEG and KSB conceived the study. GEG drafted the paper. GEG and RB conducted the analyses. All authors contributed substantially to the interpretation of the findings, revised the article critically for important intellectual content, approved the final version to be published and agreed to act as guarantors of the work.
Funding This study was supported by the Ontario Tobacco Research Unit and the Canadian Cancer Society (grant 702176 to GEG). The publication of this manuscript was supported by the Canadian Cancer Society (grant #2011-701019), through the Propel Centre for Population Health Impact. GEG holds the Centre for Health Economics and Policy Analysis (CHEPA)/Ontario Ministry of Health and Long-Term Care (MOHLTC) Chair in Health Equity, an endowed Chair funded in part by the MOHLTC.
Competing interests None declared.
Provenance and peer review Not commissioned; externally peer reviewed.
Data sharing statement Cigarette wholesale sales data are available from Health Canada. Data from the Canadian Tobacco Use Monitoring Survey (CTUMS), the Canadian Tobacco, Alcohol and Drug Survey (CTADS) and Canadian Community Health Survey (CCHS) are available from Statistics Canada. Data from YSS and CSTADS are available from the Propel Centre for Population Health Impact, University of Waterloo. Researchers who wish to use YSS/CSTADS data must first submit a data request application to the Population Health Data Repository advisory committee. Data from ITC are available 2 years after the date of issuance of cleaned data sets by the ITC Data Management Centre to approved researchers. Researchers interested in using ITC data are required to apply for approval by submitting an ITC Data Repository (ITCDR) request application and subsequently to sign an ITCDR Data Usage Agreement. The criteria for data usage approval and the contents of the Data Usage Agreement are described online (http://www.itcproject.org).