Article Text

Abstract
Background The price of tobacco products in relation to the income of tobacco users—affordability—is recognised as a key determinant of tobacco use behaviour. The effectiveness of a price increase as a deterrent to tobacco use depends on how much price increases in relation to the income of the potential users. The aim of this paper is to examine the distribution of and trends in the affordability of tobacco products in Bangladesh.
Method Using four waves of International Tobacco Control Survey data on Bangladesh, this study measures affordability of tobacco products at the individual level as the ratio of self-reported price and self-reported income. The trends in affordability by brand categories of cigarettes and of bidi and smokeless tobacco are estimated using multivariate linear regression analysis.
Results Despite significant increase in price, the affordability of cigarettes increased between 2009 and 2014–2015 due to income growth outpacing price increase. The increase was disproportionately larger for more expensive brands. The affordability of bidis increased over this period as well. The affordability of smokeless tobacco products remained unchanged between 2011–2012 and 2014–2015.
Conclusion The tax increases that were implemented during 2009–2015 were not enough to increase tobacco product prices sufficiently to outweigh the effect of income growth, and to reduce tobacco consumption. The findings from this research inform policymakers that in countries experiencing rapid economic growth, significant tax increases are needed to counteract the effect of income growth, in order for the tax increases to be effective in reducing tobacco use.
- Economics
- Price
- Taxation
Statistics from Altmetric.com
Introduction
Affordability, or the price of tobacco products in relation to the income of tobacco users, is recognised as a key determinant of tobacco use behaviour.1 While higher prices can reduce consumption of tobacco products, the effect of income growth in increasing demand can more than offset the negative effect of price increases and the net effect can be an increase in demand. Thus, the effectiveness of price increases as a deterrent to tobacco use depends on how much prices increase in relation to the income of potential users. The affordability of tobacco products is widely recognised as an index for evaluating progress in tobacco taxation in low/middle-income countries (LMIC), especially in countries that are experiencing rapid economic growth.2 In this research, we examine affordability trends of tobacco products in Bangladesh, which graduated from low-income to lower middle-income status in 2015.3
Affordability has been measured in several different ways, such as the minutes of labour or percentage of daily income required to purchase a pack of cigarettes,4–7 and percentage of annual per capita gross domestic product (GDP) required to purchase 100 packs of cigarettes called relative income price (RIP).1 8 The limitation of these aggregate measures is that they do not provide insight into the variation of affordability across population subgroups and different points of the price and income distribution. The only study that used individual-level data from the Global Adult Tobacco Surveys from 15 LMICs derived consumption-weighted average price and used it with per capita GDP to calculate RIP.9 In contrast, this research uses a modified RIP based on individual-level data on self-reported price and household income group from four waves of the International Tobacco Control (ITC) Bangladesh Surveys to study the distributions and trends of affordability of multiple tobacco products including cigarette, bidi and smokeless tobacco that are widely in use in Bangladesh.10
Methods
Source of data
The data came primarily from the ITC Bangladesh Survey Waves 1–4, a cohort survey of tobacco users and non-users aged 15 and older with multistage complex survey design conducted in 2009, 2010, 2011–2012 and 2014–2015.11 The survey protocol was approved by the Ethical Review Committees of the University of Waterloo, Waterloo, Canada, and Bangladesh Medical Research Council, Dhaka, Bangladesh. Self-reported data on prices of tobacco products paid in the last purchase, household income and other individual and household-specific sociodemographic characteristics from 6463 observations on cigarette smokers and 1733 observations on bidi smokers pooled over the four waves and 407 observations on smokeless tobacco users pooled over the third and the fourth waves were used. These observations include both exclusive and multiple users of tobacco products. Cross-sectional individual-level survey weights were used for representativeness of the sample estimates. In addition, the cross-sectional weights were multiplied by the daily use of tobacco (eg, number of cigarettes/bidis smoked per day, frequency of smokeless tobacco use) to assign higher weight to individuals with heavier tobacco consumption. The analysis was restricted to daily tobacco users.
Excise tax rates for cigarette, bidi and smokeless tobacco over the period under observation were obtained from the National Board of Revenue (NBR) of the Government of Bangladesh. The online supplementary data on per capita household income by income categories were derived from the Bangladesh Household Income and Expenditure Survey (HIES) 2010.12 The data on inflation and per capita GDP growth rates were taken from the World Economic Outlook13 and the World Development Indicators data base.14
Supplemental material
Self-reported price
Smokers reported prices from their last purchases either in sticks or in packs of 10 or 20 sticks. To obtain the standardised price per pack of cigarettes, first the price per stick of cigarettes was calculated for both types of purchases and then multiplied by 20 to convert it to price per pack. In Bangladesh, the prices of cigarettes by brand are determined by the NBR and are used as the tax base for calculating the tax liability of the cigarette manufacturers. Based on these administered prices by brands, cigarettes are categorised into four brand tiers—premium, high, medium and low. The ad valorem excise tax rate (known as supplementary duty), which is based on the administered retail price, varies by these price categories (table 1). In addition, there is value-added tax (VAT) at 15% of the administered retail price.
Tiered ad valorem excise tax rates for cigarettes in Bangladesh, 2009–2015
The price gaps between tiers, as shown in table 1, are set by the NBR to prevent cigarette manufacturers from declaring higher price brands in lower price categories to take advantage of lower tax rates. However, prices reported in the survey do fall in the gaps. We strictly maintain the upper limit in the defined price band for identifying low-price brands based on the observation that market prices do not differ from the administered prices for low-price brands. For medium-price, high-price and premium brands, variations exist between market prices and administered prices with a tendency of market prices to be higher than administered prices. Thus, we include the prices in the gap between medium-price and high-price brands in the medium-price category. It allows for mark-up in the market price beyond the defined price band of medium-price brands. Similarly, we include the prices in the gap between high-price and premium brands in the high-price category.
The prices of bidis are determined by the bidi manufacturers themselves and their tax liability is calculated based on a predetermined tariff value per pack of bidis. The VAT is imposed on the tariff value plus the excise tax. The excise tax rate differentiates between unfiltered and filtered bidis. Between 2009–2010 and 2010–2011, the tariff values and tax rates remained unchanged (table 2). In 2011–2012, the bidi manufacturers were allowed to market both unfiltered and filtered bidis in smaller pack sizes with lower tariff values. This resulted in additional tiers with smaller size and lower value bidi packs. However, 98% of total bidi sales were in the form of unfiltered bidis with 25-stick packs. So for bidis, the price per pack is calculated by multiplying the price per stick by 25. Bidis produced in Bangladesh are essentially handmade cigarettes made in a smaller size than manufactured cigarettes. In the absence of any reliable information on the equivalence of weight of cigarette and bidi packs manufactured in Bangladesh, we consider 25-stick bidi packs that are most commonly available in the market. The price of smokeless tobacco is expressed in 20 g as an equivalent of a 20-cigarette pack based on the assumption that one cigarette typically weighs about 1 g.15 The excise tax rate on the most widely used smokeless tobacco products (zarda and gul) increased from 10% to 60% of ex-factory price between 2009 and 2015 (table 3).
Tiered excise tax rates for bidis in Bangladesh, 2009–2015
Excise tax rates for smokeless tobacco products (zarda, gul) in Bangladesh, 2009–2015
Per capita household income
The ITC survey collects data on household income classified into five groups reported by household head. In the absence of any information on household size in ITC data to be able to calculate per capita household income, we used average per capita household income from Bangladesh HIES 2010 corresponding to each household income group of ITC survey. We then assigned it to each individual tobacco user in the sample who reported household income in one of the five groups.12
The HIES is not available for other years of ITC survey. To obtain per capita income values for other survey years of ITC data, the 2010 values of per capita income variable for the five groups were adjusted using national-level inflation and per capita GDP growth rates. The details of the method of derivation are provided in the online supplementary file on Derivation of Per Capita Income Variable. The underlying assumption of adjustment for economic growth is that the growth rate of per capita income is the same across all income groups. In cross-sectional samples, this assumption would imply growth in per capita household income at the same rate as per capita GDP. In the longitudinal design of ITC surveys, however, we observe significant mobility across income groups. For individuals experiencing upward mobility, the growth in per capita household income would be faster than in per capita GDP. On the other hand, for individuals experiencing downward mobility, the growth in per capita household income might be negative or slower than in per capita GDP. The overall growth rate of per capita household income in relation to per capita GDP would depend on the relative strengths of upward and downward mobility.
In using individual-level per capita annual household income, this study departs from the convention of using per capita GDP as an aggregate measure of household purchasing power. There are four distinct advantages of using per capita household income in place of per capita GDP. First, while per capita GDP takes into account the impact of overall economic condition of the country, per capita household income is a closer representation of the individual-level disposable income and purchasing power. Income generated in informal transactions, for example, is not reported in GDP accounting while it contributes to personal disposable income. Per capita GDP is generally a broader measure of income as it takes into account both private and public income and expenditures. On the other hand, per capita household income takes into account only private income and is more sensitive to tax liability. Second, the per capita GDP-based measure ignores the effect of income distribution on individual-level affordability.7 Third, measuring affordability at the individual level allows one to examine the distributional shift in the affordability of tobacco products over time beyond the average measure. Finally, in an open economy, a significant proportion of GDP can accrue to foreign nationals which can bias the measure of affordability among the natives.
One limitation of using household income in measuring affordability is that it may not fully reflect the purchasing power of respondents. For example, people may receive loans to finance their purchases and their expenditures are greater than their income. Besides, income reported in the surveys often suffers from under-reporting bias and can cause understatement of affordability as well. The use of average per capita income in this paper based on a nationally representative household survey overcomes these measurement issues.
Relative income price
The affordability index RIP is given by the ratio 100 × price per unit/per capita annual household income. The lower the value of RIP, the more affordable the tobacco products are. The summary statistics of RIP by brand types of cigarettes and survey waves are presented in table 4. In measuring the price per pack of cigarette, we took into account both stick and pack purchases, in view of the large proportion of stick purchase and typically higher prices associated with stick purchase than with pack purchase (table 5). Generally, stick purchases reflect higher RIP and lower level of affordability among cigarette smokers.
Summary statistics of relative income price (RIP) (%) of cigarettes by brand types in Bangladesh, 2009–2015
Average price (in current prices) and RIP (in percentages) of cigarettes in Bangladesh by type of purchase, 2009–2015
Based on this affordability measure, we conducted multivariate analyses as changes in demographics and socioeconomic characteristics, such as age (AGE), gender (GEN), socioeconomic status (SES), educational categories (EDU), occupational categories (OCC), rural-urban residence status (URB) and village of residence (VILL), may have a significant impact on income and tobacco users’ choices of products, brands and prices. We examine the trend in affordability controlling for individual i’s characteristics using a pooled cross-sectional ordinary least squares (OLS) regression of affordability as follows:
 (1)
(1)
VILL is the primary sampling unit and controls for the time-invariant regional differences in price and income. The primary sampling units were selected in Wave 1 in 2009. Due to the longitudinal design of the study, when some households from the initial sample moved out of those areas, they were lost to ‘attrition’ and were replaced by households picked from the same sample area. Thus, VILL represents a regional fixed effects (FE) in the model. There is no underlying assumption about the immobility of sample households.
SES is a composite index derived from the characteristics of housing of the respondents.11 The information on housing was collected at the census prior to the survey in 2008–2009 in order to stratify the enumerated households by the housing index. This variable controls for the initial socioeconomic condition of the respondents prior to the beginning of the panel survey. The income variable, on the other hand, was collected in every wave of the survey. SES is a predetermined variable by construction and thus exogenous to the current income.
Individual education level is included as an independent variable to predict individual purchase price, which is the numerator in RIP. If we used individual earning to measure income in the denominator of RIP, individual education would also be a strong predictor of individual earning following the human capital approach. The relationship between household income and education of household members is, however, less straightforward. Household income is an outcome of the level of education attained by the earning household members in the past. Household income is also a strong determinant of the level of education of children whose future earning will be determined by their current educational attainment. There is intergenerational causality running from parental education to current household income to children’s education. The smokers in the sample include all household members aged 15 and above including parents and children, barring us to establish causality from income to education. Thus, we preclude the possibility of endogeneity of the education variable.
The coefficients of the WAVE variables indicate the time trend of affordability with reference to Wave 1. A negative sign of the coefficient of each wave variable indicates that affordability increased in that wave compared with Wave 1.
For estimating the time trend coefficients of affordability of each of the four tiers of cigarette brands separately, the WAVE variable is interacted with the BRAND variable as follows:
 (2)
(2)
The BRAND variable codes low-price, medium-price, high-price and premium cigarettes according to the classification of cigarettes by price bands corresponding to the four tax tiers (table 1). Equation (1) is estimated for cigarette, bidi and smokeless tobacco; equation (2) is estimated for cigarettes only.
The policy variable TAX is used for cigarettes only to identify the effect of differential rate of excise tax on the affordability of cigarettes. The TAX variable is constructed by multiplying the self-reported retail price per pack of cigarette in last purchase with the tax rate corresponding to the price band that the self-reported price belongs to. Considering that the tax variable is dependent on the retail price and can be endogenous to affordability, we used two-stage least squares instrumental variable (IV) estimation using village of residence of respondents as the instrument for tax in the first stage and removing the village variable from the second stage (see online supplementary appendix tables A1 and A2). The adjusted R2 from the first-stage regression of tax is 0.90, suggesting strong predictability of variations in tax using village-level variation. The effect of the tax policy variable on the affordability of bidi and smokeless tobacco is not identifiable due to the uniform rate of taxation for smokeless tobacco and the almost uniform rate of taxation applied to 98% of bidi sales.
Supplemental material
All the estimations were done using STATA V.13. Since the OLS and IV regressions pool observations from four waves of data, there may be multiple observations on a single individual that are not independent. The SEs of estimates are, therefore, corrected for possible autocorrelation of disturbances within repeated observations on a single observational unit using the option vce (cluster individual identification number) in the regression command. The sensitivity of the trend in affordability is tested further using FE regression that controls for unobserved individual-level heterogeneity. All prices, taxes and income variables are adjusted for inflation, unless otherwise noted.
The methods presented in this section are modified and improved upon the methods used in an earlier version of the paper.16
Findings
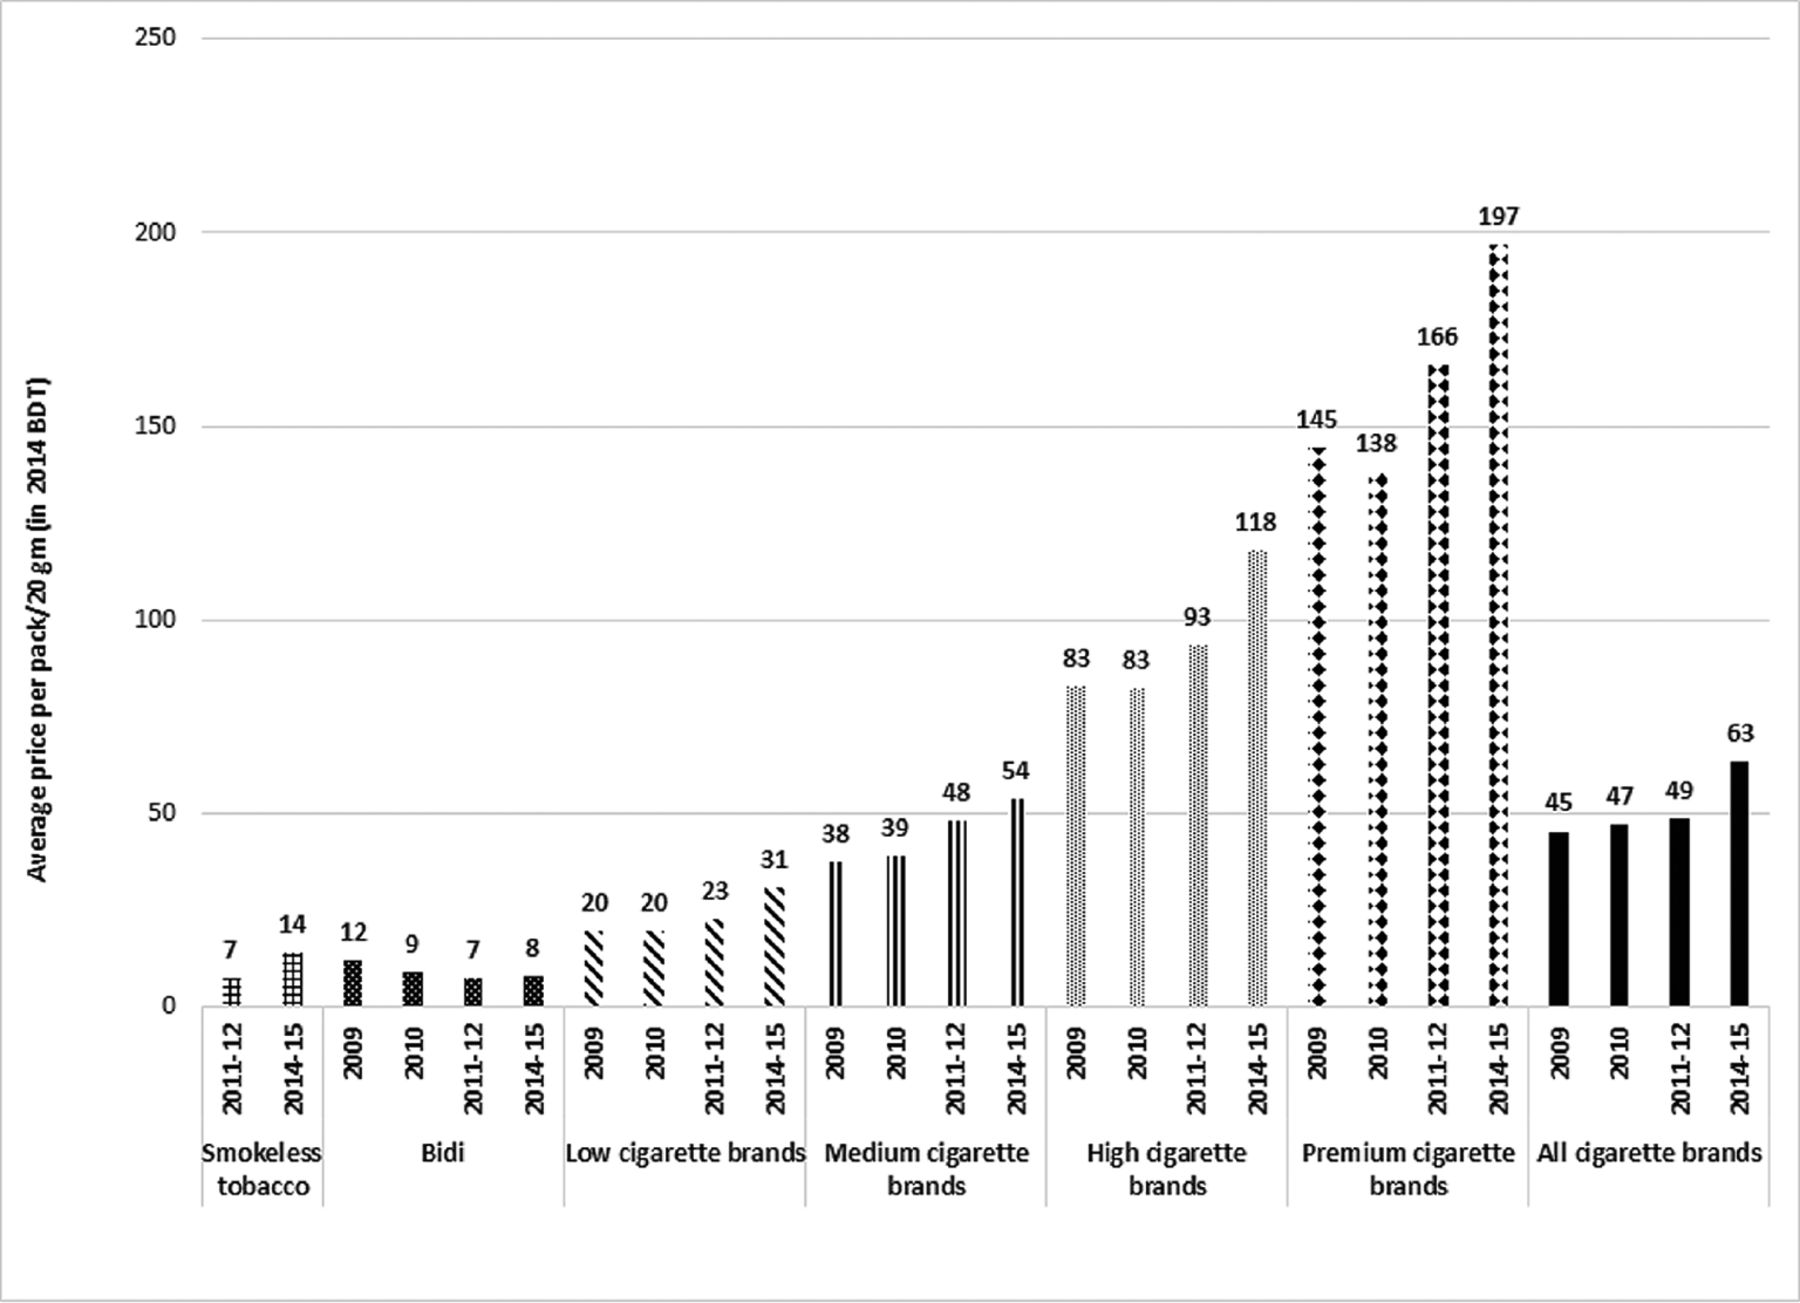
The average cigarette price generally increased in real terms for the four brand tiers (low price, medium price, high price and premium) between 2009 and 2014–2015 (figure 1). On average, inflation-adjusted cigarette prices for all brands increased at an annual rate of 6.9% between 2009 and 2014–2015. This increase in real price of cigarettes is attributable to the upward adjustment of the administered price every year above the annual inflation rate along with minor increases in the tax rates by the NBR (table 1). The per capita GDP increased at an annual average rate of 5% over the same period.14 The faster growth in average price compared with per capita GDP may lead one to conclude that affordability of cigarettes has been decreasing in Bangladesh in the recent past. However, per capita annual household income in the ITC sample increased faster than per capita GDP between 2009 and 2014–2015 from 31 740 Bangladeshi taka (BDT) to 49 832 BDT in 2014 prices, implying 9% annual rate of growth.

Average price per 20 g of smokeless tobacco, per pack of bidis and cigarettes (by brand types) in Bangladesh, 2009, 2010, 2011–2012 and 2014–2015 (in 2014 Bangladeshi taka (BDT)). (Source: Authors’ calculations from International Tobacco Control (ITC) Bangladesh Survey Waves 1–4)
The average price of bidis decreased at an annual rate of 7.3% between 2009 and 2014–2015 (figure 1) when the adjustments in the tax rates or the tariff values were minimal (table 2). In contrast, the average price of smokeless tobacco products almost doubled between 2011–2012 and 2014–2015 (figure 1) attributable in part to the tripling of the tax rate during this period (table 3).
As shown in figure 2A, the RIPs for bidis (4.8%) and for all cigarette brands (16.4%) in 2009 are much higher than the earlier estimates of 1.2% and 5%, respectively, based on average price and per capita GDP data.9 This divergence is attributable to two factors. First, the former study used aggregate-level measures that fail to take account of price and income distributions as well as the effect of price minimisation or tax avoidance behaviour on the paid prices. Second, the per capita GDP used in the former studies is much higher than the per capita household income used in the present study and therefore overstates the affordability of tobacco products.

(A) Relative income price (RIP) of cigarettes, bidis and smokeless tobacco in Bangladesh, 2009–2015. (B) Percentage point change in RIP of cigarettes, bidis and smokeless tobacco in Bangladesh, 2009–2015. The change in RIP for smokeless tobacco is for 2011/2012–2014/2015. (Source: Author’s calculations from the International Tobacco Control (ITC) Bangladesh Survey Waves 1–4)
Figure 2B reveals that the affordability of smokeless tobacco did not change between 2011–2012 and 2014–2015. The affordability of bidis increased over 2009 through 2014–2015. The affordability of cigarettes increased overall, although the affordability of low-price brand cigarettes decreased by two percentage points (pp). Previous estimates show that between 2008 and 2014, cigarettes became less affordable in Bangladesh.17 This conclusion is based on the difference between 2008 and 2014 for just the most sold brand, which was within the low-price category, for which average affordability decreased. Because of the possibility that the trend in affordability for this single brand may not be representative of the market as a whole, we examined the percentage point change in RIP by brand types of cigarettes in figure 2B. It shows that the absolute increase in affordability is greatest for premium cigarette brands by 4.7 pp, then for high-price (3.9 pp) and medium-price (2.1 pp) brands. These increases in affordability of higher priced cigarette brands are primarily driven by rapid income growth, as mentioned earlier, that superseded real price increases for smokers at the high end of the price distribution. Besides, the overall price distribution of cigarettes shifted leftward between 2009 and 2014–2015. The median price fell from 45 to 40 BDT in 2014 prices during this period, which is indicative of shifting composition of cigarette market towards cheaper brands.
The estimated coefficients of RIP of cigarettes obtained from OLS, IV and FE regression of equations (1) and (2) are presented in tables 6 and 7, respectively. The coefficients of interest for identifying the trend of RIP are those of the wave variables. The statistical significance and negative sign of the coefficients of the wave variables indicate that RIP decreased and affordability increased in the corresponding wave compared with Wave 1. For example, according to the OLS estimates, RIP decreased by 1.29 pp in Wave 2, 2.48 pp in Wave 3 and 7.11 pp in Wave 4 in relation to Wave 1. The increase in the absolute value of the coefficients for successive waves indicates persistent increase in every wave compared with the previous wave. The evidence of increasing affordability of cigarettes, with little variation in the magnitude of the estimated trend, is robust across all three models of estimation.
Estimated coefficients of the ordinary least squares (OLS), instrumental variable (IV) and fixed effects (FE) regressions of relative income price (RIP) of cigarettes in Bangladesh, 2009–2015
Estimated coefficients of the ordinary least squares (OLS), instrumental variable (IV) and fixed effects (FE) regressions of relative income price (RIP) of cigarettes with interactions of trend and brand types in Bangladesh, 2009–2015
Similarly, the coefficients of the wave variables by brand types presented in table 7 indicate that affordability increased for medium-price, high-price and premium brands persistently in each wave. For low-price brands, affordability remained unchanged through Wave 3 and then increased in Wave 4. This finding contradicts the observation on average RIP in figure 2B that indicates decrease in affordability of low-price brands. It suggests the importance of isolating the trend in affordability from the effects of demographic and socioeconomic composition of smokers that might be shifting the distribution of affordability as well. Besides, the magnitude of increase in affordability is much larger in the regression estimates than those measured by the change in average RIP. It is more pronounced for premium brands showing increase in RIP from Wave 1 to Wave 4 by 22.18 pp (according to OLS estimate in table 7). It indicates that it would require about 22 pp less of income to purchase 100 packs of premium brand cigarettes in Wave 4 than in Wave 1. The high magnitude of the change in RIP for premium brands is understandable in view of the much higher price of premium brands (figure 1) and large values and wide range of RIP of premium brands compared with other brands (table 4).
In both tables 6 and 7 and in all models of estimation, the tax variable appears to significantly affect RIP—the higher the tax, the higher the RIP and the lower the affordability. Affordability increases with age, as shown in OLS and IV estimates, which can be driven by the correlation of age with time trend, income and price. The positive correlation between age and time trend arises due to the ageing of the cohort in a longitudinal survey design (pairwise correlation coefficient 0.13, p<0.001). The correlation is, however, less than perfect because of panel attrition, replenishment of respondents with different ages and inclusion of the replenished sample in the OLS and IV regressions. In the FE regression, there is perfect collinearity between age and waves and we drop the age variable. The correlation between age and per capita income is weak (pairwise correlation coefficient 0.03, p<0.001). This is attributable to the use of per capita household income (which implies same value assigned to adults of all ages in the same household) in place of individual earning as a measure of income. What is more important from a policy perspective is the negative correlation between age and price (pairwise correlation coefficient −0.13, p<0.001), which suggests that older smokers tend to purchase cheaper cigarettes.
Affordability is not significantly different between men and women. Compared with smokers with 0 year of education, affordability is not significantly different for those with 1–8 years of education, but it is higher for those with 9 or more years of education. Individuals without employment, such as students, unemployed and household managers, generally have lower level of affordability. The estimates for employment status are not always statistically significant, perhaps because household income smooths out the effect of individual employment status. For individuals employed in different occupational categories, the estimates are not consistent across the models of estimation. Cigarettes are more affordable for people from high SES compared with low and moderate SES. There is no significant difference in affordability between rural and urban residents in the OLS estimates. The rural-urban variation has likely been captured by the village-level variation in this model. The average level of affordability is higher for lower price brands, as observed in the cross-sectional estimates.
The results of both the OLS and FE regressions of the RIP of bidis, presented in table 8, confirm that the affordability of bidi increased in the recent past in Bangladesh. The increase in RIP of cigarettes was, however, faster than that of bidis, as evident in the coefficients of Wave variables in tables 6 and 7. The results of OLS regression of the RIP of smokeless tobacco, presented in table 8, confirm that there was no change in affordability for smokeless tobacco products between Waves 3 and 4.
Estimated coefficients of the ordinary least squares (OLS) and fixed effects (FE) regressions of relative income price (RIP) of bidis and smokeless tobacco in Bangladesh, 2009–2015
Discussion
Using data from Waves 1–4 of the ITC Bangladesh Survey, this research demonstrates that the real prices of cigarettes and smokeless tobacco increased, while the real price of bidi decreased. The increase in the real price of smokeless tobacco is consistent with the declining trend in smokeless tobacco use in Bangladesh observed over 2009–2012.10 The scenario is different with respect to the change in cigarette and bidi smoking prevalence. The law of demand suggests that the increase in the real price of cigarettes and the decrease in the real price of bidi should lead to a decrease in cigarette smoking and an increase in bidi smoking. To the contrary, prevalence data show that the rate of exclusive cigarette smoking increased from 7.2% to 10.6% between 2009 and 2012. It resulted in 4.1 million additional cigarette smokers, while the number of bidi smokers went down.10 There is clearly a shift of the composition of smokers from bidi to cigarette use. The shift is likely induced by increase in affordability of cigarettes relative to bidi as well as shift in preference of smokers for higher quality machine-made products due to income growth. The positive income elasticity of cigarette smoking prevalence in Bangladesh estimated at 0.13 using the same data set lends support to this finding.18 Furthermore, historical data show that the retail volume of cigarettes increased from 48.6 to 86.1 billion sticks during 2002–2016 registering 77% increase in 14 years.19
The growing consumption of cigarettes implies that tobacco control initiatives need to be strengthened in Bangladesh. The contribution of the tax increase in reducing affordability, as observed in this research, suggests that significant increases in tax and price of cigarettes outpacing the growth of income is a necessity for reversing the upward trend in cigarette smoking. The current cigarette excise tax in Bangladesh is imposed with tiered ad valorem rates, a tax system that creates the incentive of switching down to cheaper cigarettes in response to tax and price increases. It is evident in this research that affordability is higher among older smokers who tend to purchase cheaper brands. They are expected to trade down to cheaper brands when price goes up. Global evidence indicates that a uniform excise system—that is, no tiers—would remove the incentive of switching down to cheaper cigarettes and encourage quitting behaviour.20 Additionally, ad valorem taxes like Bangladesh’s are less efficient in increasing price, reducing consumption and generating revenue.18 Switching to a specific tax would improve the system.
However, consideration of the multiple types of tobacco products used in Bangladesh is also important, as changing the tax system and increasing the price level of cigarettes in isolation from bidis and smokeless tobacco may induce switching from cigarettes to bidis or to smokeless tobacco. Therefore, the excise systems on bidis and smokeless tobacco, which are also ad valorem, must be changed to a specific system. Tobacco tax policy should be geared to bring forth simultaneous increases in smokeless tobacco, bidi and cigarette prices and close the price gap between them.
A key contribution of this paper lies in the identification of much faster income growth experienced at the household level compared with the national level GDP growth and its impact on the trend in affordability of tobacco products. The results demonstrate that the use of per capita GDP in place of per capita household income may mislead the conclusion about the trend in affordability. This is particularly relevant for Bangladesh receiving significant and increasing volume of remittance, which increased from US$10.5 billion in 2009 to US$15 billion in 2014 (equivalent to approximately 9%–10% of GDP).14 The increased flow of remittance increased household disposable income and consumption substantially especially at the lower income strata. It is not accounted in the GDP measure because it does not represent goods and services produced in the economy.
Moreover, the government of Bangladesh implemented three consecutive national pay scales in 2005, 2009 and 2015 with a significant increase in the salary of government sector employees.21–23 It resulted in annual rate of increase of inflation-adjusted salary of formal sector employees varying between 7% and 10% at different grades. Even the real wage rate for low-paid labour in the agricultural sector, which employs nearly half of the employed labour force, increased at an annual rate of 6% between 2009–2010 and 2014–2015.24
These facts suggest that households in low SES experienced tangible upward income mobility, which is not reflected in national level per capita GDP growth. The ITC survey, being longitudinal, captures the upward income mobility of tobacco users in low SES and its impact on affordability. A sensitivity analysis of the trend in affordability using interaction of SES with the trend variable does indicate that the increase in affordability of cigarettes has been driven by the increase in affordability among the smokers in low SES.
Nevertheless, the faster income growth in the ITC sample may be subject to the following three biases. First, the per capita income in the sample (34 292 in 2014 BDT) was lower than the national average per capita income (41 750 in 2014 BDT) in Bangladesh HIES in the corresponding year (2010). It indicates that the ITC sample over-represented the lower income population when it was started in 2009. It is expected because tobacco use is higher among lower income people and we selected the households with tobacco users for this analysis. So, there is likely a sample selection bias. Second, the sample cohort of tobacco users selected in 2009 may not be representative of the tobacco user population in the follow-up waves, especially with respect to their age and income distribution. Third, in estimating affordability, we included the sample who continued to use tobacco. The self-selection process in the choice to use tobacco can cause an upward bias.
Another limitation of this research lies in examining an absolute measure of affordability instead of a relative measure to compare affordability of tobacco products with that of non-tobacco products. Relative price is more important than absolute price in making consumers’ choices of products. This limitation derives from the unavailability of data on purchases of non-tobacco products in the ITC surveys. It remains for future research to study the relative affordability of tobacco products using other household surveys that collect data on both tobacco and non-tobacco product purchases.
Conclusion
The current price and tax policy in Bangladesh falls short of the objective of effective tobacco control through taxation. It is evident from the increasing affordability of tobacco products in the country. For reasons of public health, it is important to put into place changes in the tax system that would keep pace with inflation and rising income. The tax reform also needs to eliminate or greatly reduce the structural features of the tax system that weakens the impact of tax and price increases on reducing tobacco use. It includes shifting reliance on specific excise away from ad valorem system. This is more important in countries experiencing rapid economic growth.
What this paper adds
The affordability of tobacco products is widely recognised as an index for benchmarking tobacco taxation in low/middle-income countries, especially in countries that are experiencing rapid economic growth.
Tax-induced price increases over and above the rate of inflation and income growth can make tobacco products less affordable over time and reduce tobacco consumption and prevalence.
Existing affordability indices compare the aggregate level measures of price of cigarettes (eg, price of the most sold brand) relative to income (eg, per capita gross domestic product or national level wage) over time.
These measures lack representativeness of population-level affordability, often leading to biased estimates of the level and trend of affordability. Moreover, previous studies measuring affordability have been primarily based on univariate analysis.
This paper constructs an affordability index based on self-reported data on the purchase price of tobacco products (cigarette, bidi and smokeless tobacco) and household income by individual tobacco users from four waves of nationally representative International Tobacco Control Bangladesh Surveys spanning from 2009 to 2015.
Based on both univariate and multivariate analyses, we find that in Bangladesh, cigarette and bidi became more affordable and smokeless tobacco remained as affordable as the base year, despite tax and price increases taking place during the period under observation.
Acknowledgments
The authors are thankful to Emmanuel Guindon, Genevieve Sansone and Evan Blecher for their valuable comments in drafting the paper. The authors acknowledge the contribution of three anonymous referees for their comments and suggestions that greatly benefitted the revisions of the paper.
Footnotes
Contributors NN, MS, JD, AKMGH and GTF contributed to the study design. NN conducted the quantitative analysis and wrote the first draft of the manuscript. All authors contributed to interpretation of results and to writing, revising and editing of the final manuscript.
Funding The ITC Bangladesh Survey was supported by the International Development Research Centre (IDRC Grant 104831-002) and Canadian Institutes of Health Research (MOP 79551 and MOP 115016), and the US National Cancer Institute (P01 CA138389). Additional support was provided to GTF from a Senior Investigator Award from the Ontario Institute for Cancer Research and a Prevention Scientist Award from the Canadian Cancer Society Research Institute. CS is funded by 1K99AA024810 (NIAAA). Additional support in preparing this paper was provided to University of Waterloo by the Canadian Institutes of Health Research (FDN-148477).
Disclaimer The authors alone are responsible for the views expressed in this article, and they do not necessarily represent the views, decisions or policies of the institutions with which they are affiliated.
Competing interests None declared.
Patient consent Obtained.
Ethics approval Office of Research Ethics, University of Waterloo, Canada and Bangladesh Medical Research Council.
Provenance and peer review Not commissioned; externally peer reviewed.
Correction notice This paper has been corrected since it was published Online First. Funding information for CS has been added to the ’Funding' section. Details of additional support have also been added.