Article Text

Abstract
Background Identifying factors shaping knowledge of and attitudes towards tobacco products in preadolescence is a key component supporting tobacco control policies aimed at preventing smoking initiation. This study quantified exposure to tobacco retailing environments within the individual-level activity spaces of children across a socioeconomic gradient.
Methods One week of global positioning system (GPS) tracking data were collected at 10 s intervals from a nationally representative sample of 10–11-year olds (n=692). Proximity of GPS locations (n=~16 M) to the nearest tobacco retailer (n=9030) was measured and exposure defined when a child came within 10 m of a retailer. Duration, frequency, timing and source of exposure were compared across income deprivation quintiles, along with retail density within children’s home neighbourhoods.
Results On average, children were exposed to tobacco retailing for 22.7 min (95% CI 16.8 to 28.6) per week in 42.7 (35.2–50.1) independent encounters. However, children from the most deprived areas accumulated six times the duration and seven times the frequency of exposure as children from the least deprived areas. Home neighbourhood retail densities were 2.6 times higher in deprived areas, yet the average number of businesses encountered did not differ. Most exposure came from convenience stores (35%) and newsagents (15%), with temporal peaks before and after school hours.
Conclusions By accounting for individual mobility, we showed that children in socially disadvantaged areas accumulate higher levels of exposure to tobacco retailing than expected from disparities in home neighbourhood densities. Reducing tobacco outlet availability, particularly in areas frequently used by children, might be crucial to policies aimed at creating ‘tobacco-free’ generations.
- denormalization
- end game
- environment
- prevention
- socioeconomic status
Statistics from Altmetric.com
Background
There is growing acceptance that tobacco ‘endgame’ strategies—which seek to end, rather than control, the tobacco pandemic—are needed to reduce the global burden of preventable disease.1–3 Endgame goals vary internationally but typically set a target for reducing smoking prevalence to less than 5% of the population.4 A variety of tobacco-related interventions will be required to achieve these ambitions and will almost certainly have to include measures designed to reduce the local supply of tobacco products.4 Most adult smokers start during adolescence,5 so mitigating against risk factors connected to smoking initiation during adolescence has been identified as a priority in tobacco control policies.6 However, much of the research into the availability of tobacco products has focused on adults and adolescents,7–12 and less is known about exposure among younger children. This is a key omission because preadolescence is a significant formative period during which knowledge and attitudes to health-related behaviours, including smoking, become ‘hard-wired’.13
The availability of tobacco products has been identified as a potential causal factor in promoting smoking initiation and as a barrier to cessation.14 15 It is well established that tobacco retailing is disproportionately located in more socially deprived neighbourhoods,16–20 where smoking prevalence and premature deaths attributable to tobacco are also higher.21 22 Research suggests that ubiquitous availability of tobacco normalises and reinforces smoking in the local population, which in turn may make young people in the area more likely to become smokers themselves.2 15 16 Early smoking experience is strongly linked to later behaviour.23–25 Two-thirds of youths who initiate smoking aged 11 years become regular smokers versus less than half of those who initiate aged 16.26 Even a single smoking experience at age 11 is associated with an increased risk of smoking in the future compared with those who never smoked at this age.27 Hence early childhood interventions, such as those designed to denormalise smoking behaviours by reducing tobacco availability in socially disadvantaged areas, should benefit disadvantaged children who are already more vulnerable to smoking.28
Research linking exposure to tobacco retailing and youth smoking has typically quantified exposure within local neighbourhoods delimited using fixed areal units, such as census tracts, postcodes or distance buffers from schools and/or homes.12 17 19 29 30 However, such methods are potentially biased by the areal units for which data are reported and may not account for highly variable movements of individuals during their daily activities.31 For example, measuring exposure within an individual’s residential neighbourhood can leads to considerable underestimates compared with those based on an individual’s daily movements.32 33 To overcome this, researchers are increasingly quantifying environmental exposures, such as to food or tobacco retail environments, within individual ‘activity spaces’, that is, the set of locations visited in the course of daily activities and routes used to access them.33–36 Importantly, novel research linking individual-level mobility patterns to point-of-sale tobacco marketing exposure has revealed substantial differences in when and where individuals encounter tobacco.35 36 Kirchner et al conclude that (1) fixed measures of exposure environments fail to account for differences in the mobility, preferences and behaviour of individuals as they interact with the built environment, and (2) quantifying individual-level exposure can identify previously unrecognised patterns of association among individual mobility, the built environment and behavioural outcomes.35 36
The focus of this study is Scotland where recent tobacco control policies—including banning point-of-sale tobacco product displays in shops; raising the legal purchase age to 18 years old; and making it an offence to buy tobacco for under 18s—have led to significant declines in smoking in Scotland in the last decade.37 38 Adolescent smoking rates are at a historical low, with just 2% of 13-year olds and 9% of 15-year olds reporting regular smoking.39 However, rates of smoking in 13 and 15-year olds remain higher in the most deprived areas.37 39 If the government’s aim of making Scotland tobacco free by 2034 is to be achieved, it is clear that further action to reduce inequalities in smoking is necessary.38
In this paper, we determine if individual mobility patterns of children exacerbate exposure to tobacco retailing above what would be expected based on tobacco outlet density (TOD) alone. To achieve this, we provide a nationally representative assessment of daily exposure to tobacco retailing within the individual-level activity spaces of preadolescent children (n=692) in Scotland. One limitation highlighted by Kirchner et al was that the low frequency of geospatial locations recorded (once every 15 min) in their study meant some exposures may have been missed, and exposure duration could not be estimated.36 Here, we use location data collected every 10 s to quantify real-time exposure duration and make comparisons across area-level income deprivation quintiles. We calculated traditional measures of TOD in the home environment to determine if socioeconomic inequalities in exposure duration reflect those in TOD. In addition, we quantify the frequency of independent exposures, the number of unique retailers encountered per day and the timing and source (ie, outlet type) of exposures.
Methods
Calculating individual-level exposure of children to tobacco retailing took the following steps: (1) geocoding tobacco retailer locations; (2) measuring proximity of children’s GPS locations to the nearest tobacco retailer; (3) calculating mean hourly exposure rates to derive daily and weekly rates for comparison across area-level deprivation quintiles.
Tobacco retail data
The addresses of all premises registered for tobacco sales in 2015–2016 were obtained from the Scottish Tobacco Retailers Register (n=9043) and cleaned to remove duplicates, resulting in 9030 premises. The longitude/latitude coordinates for each address were geocoded using the R package40 ggmap.41 Most addresses (91%) were geocoded to rooftop accuracy, but those that failed (n=830; 9%) were manually geocoded using Google Maps.
Neighbourhood deprivation
We obtained an indicator of socioeconomic deprivation for the data zone (a commonly used census data reporting unit comprising 500–1000 residents) containing each participant’s home address. The measure came from the Scottish Government’s Scottish Index of Multiple Deprivation (SIMD) 2016, a tool for measuring area-level deprivation. The SIMD is made from seven domains that characterise social, economic and physical environment in the area, ranging from education to crime. Following previous precedent, we used the income deprivation domain to measure area level deprivation.19 This domain indicates the proportion of population in each area experiencing income deprivation as measured by receipt of means-tested benefits and government support. Eligibility for means tested benefits is based on income and savings, and benefits are used to top-up income if it is below a certain level.
Child activity space data
We used data from participants in the ‘Studying Physical Activity in Children’s Environments across Scotland’ (SPACES) study42 who were recruited from the Growing Up in Scotland (GUS) study—a nationally representative longitudinal cohort study originating in 2005. From a possible 2402 children who participated in GUS sweep 8 interviews, 2162 consented to be approached by SPACES researchers, of which 51% (n=1096) consented to take part. Participants were provided with an accelerometer (ActiGraph GT3X+) and a GPS (QstarzSTARZ BT-Q1000XT; Qstarz International, Taiwan) and asked to wear them over 8 consecutive days between May 2015 and May 2016 when the participants were 10–11 years old. SPACES inclusion criteria required at least 4 weekdays of accelerometer data and 1 day of weekend data, resulting in a subset of 774 participants. Of these, 692 participants (381 females, 311 males) met our inclusion criteria of providing at least 1 hour of GPS data (table 1).
Unweighted sociodemographic characteristics and summary of GPS data of 692 study participants
Quantifying exposure
The straight-line distance from each GPS location to every retailer location was measured using the geosphere package43 in R, and the nearest tobacco retailer retained along with information regarding retailer outlet type. Locations were classed as ‘exposed’ when distance to nearest retailer was <10 m. The 10 m threshold was used because this is the distance a child walking at 1 m/s (3.6 kph) would travel between each GPS location. Each exposed location represented a 10 s epoch, and the duration of exposure in minutes was calculated by multiplying counts of locations by 10, then dividing by 60. The frequency of independent exposures was also quantified. Independent exposures occurred when an exposed location was preceded by an unexposed location and thus gives a measure of encounter rates with retailers. The unique identifier of retailers on the register was used to quantify the number of unique retailers encountered by participants.
Participants were asked to wear GPS devices during waking hours, leading to variation in wear time per day. To account for this, we standardised rates of exposure (duration and frequency) per hour of wear for weekdays and weekend days. Hourly exposure rates of each participant were then averaged to provide the mean hourly rate per day type per child. Mean hourly rates were multiplied by 16 hours to calculate the daily exposure in an average week or weekend day (0600–2200) for each participant. Rates were average across week/end day types and used to scale estimates per average week.
Comparison of our sample with the national level demographic distributions (see online Supplementary material) indicates slight under-representation of children from low middle-income households (£10 000—£29 000) and the two most socially deprived quintiles (SIMD 1 and 2) and over-representation of high-income households (>£50 000) and the least socially deprived quintiles (4 and 5). However, after applying individual-level cross-sectional weights that were generated for all GUS respondents in sweep 8,42 our sample could be considered nationally representative. Hourly exposure rates were weighted by each participant’s unique weighting score and used as response variables in models against income deprivation quintile.
Supplemental material
Home environment TOD
We calculated home neighbourhood TOD as the number of tobacco outlets within 800 m of each participant's geocoded home address.9
Data analysis
Mean weighted exposure rates (duration and frequency) of participants, home environment TOD and mean and maximum number of unique retailers encountered were compared across income deprivation quintiles using one-way analysis of variance. Separate models were run for week days, weekend days and average weeks. We controlled for season (winter: October—March) in all models, although 54%–64% of participants in all income quintiles were tracked in winter (table 1). All analyses were conducted in R using the lme4 package.44 The proportion of total daily exposure per hour of day and the proportion of total daily exposure per retailer type were also quantified. Exposure by retailer type was compared against availability in the environment with χ2 tests, as was the distribution between most and least income deprivation quintiles. The distribution of exposure by time of day was compared between most and least income deprivation quintiles. All means are presented with 95% CIs.
Results
A total 52 166 hours of GPS data were collected from 692 participants, with an average 63.0 hours (61.7–64.2) of wear time per participant across an average 6.0 (5.6—6.4) days of tracking, equalling an average 10.0 hours (9.9–10.1 hours) per participant per day (table 1).
Duration and frequency of exposure to tobacco retailing
Our results showed that an average 10–11 year-old child was exposed to tobacco retailing for 2.7 min (1.9–3.4) per weekday and 4.7 min (3.4–5.9) per weekend day, totalling 22.7 min (16.8—28.6) per week (table 2). However, a significant socioeconomic gradient existed in which children from the most income-deprived areas experienced five times more exposure than children from the most affluent areas on weekdays, six times more on weekend days and six times more in an average week (p<0.001: table 2). An even greater disparity was apparent in the frequency of independent exposures (table 3). While the average child encountered exposures 5.2 (4.2–6.1) times per weekday, 8.5 (6.9–10.2) time per weekend day and 42.7 (35.2–50.1) times per week, children in the most income deprived areas encountered exposures seven times more frequently per weekday and week than children in the least deprived areas (and six times on weekends: p<0.001: table 3). The total number of businesses encountered by each child was higher in the most deprived areas 6.7 (5.3–8.1) than the least deprived 6.0 (5.3–6.7) but not significantly so (p=0.63).
Mean duration of exposure per average day and week with 95% CIs in parenthesis
Mean frequency of independent exposures per day and week with 95% CIs in parenthesis
Tobacco outlet density in the home environment
The average number of retailers within 800 m of participant’s homes was 6.2 (5.6–6.7). Home environments of participants in the most deprived quintile had significantly more retailers (11.8; 10.1–13.4) than those in the least deprived areas (4.5; 3.7–5.2: p<0.001). The mean density in the most deprived areas was 2.6 times greater than that in the least deprived.
Source of exposure by outlet type
We found a significant difference between the distribution of exposure source across all income deprivation levels and the availability of those sources in the environment (p<0.001). Overall, most exposure during a week came from convenience stores (35.0%) and newsagents (14.5%), although the level of exposure was roughly proportionate with the availability of these outlets (37.5% and 15.3%, respectively: table 4). Exposure from supermarkets (9.8%) was significantly higher than expected given their availability (5.4%), particularly on weekends (13.6%). Exposure from off-licences, hotels and businesses classed as ‘other retail’ (eg, discount stores) was also greater than expected given their availability.
The percentage of independent exposures by retailer type and availability of retailer types by income deprivation
We found significant differences between the distribution of exposure sources of children in the most deprived areas compared with those in the least deprived areas and with their availability in the environment (both p<0.001). Children in deprived areas got significantly more exposure from convenience stores (41.0%) than children in the least deprived areas (28.1%). However, this reflected differences in the availability of convenience stores, which were three times more numerous in the most deprived areas (n=929) than the least (n=306). Children in deprived areas also got almost three times more exposure from supermarkets (13.2%), particularly on weekends (21.7%), than availability in these areas (4.8%) would predict. Children in deprived areas got less exposure from newsagents (12.7%) or public houses (3.9%) than expected given their availability (17.6% and 7.6%, respectively). Whereas, children from the least deprived areas got more exposure from these two sources (15.1% and 11.8%, respectively) than expected given their availability (11.1% and 9.7%, respectively).
Timing of exposures
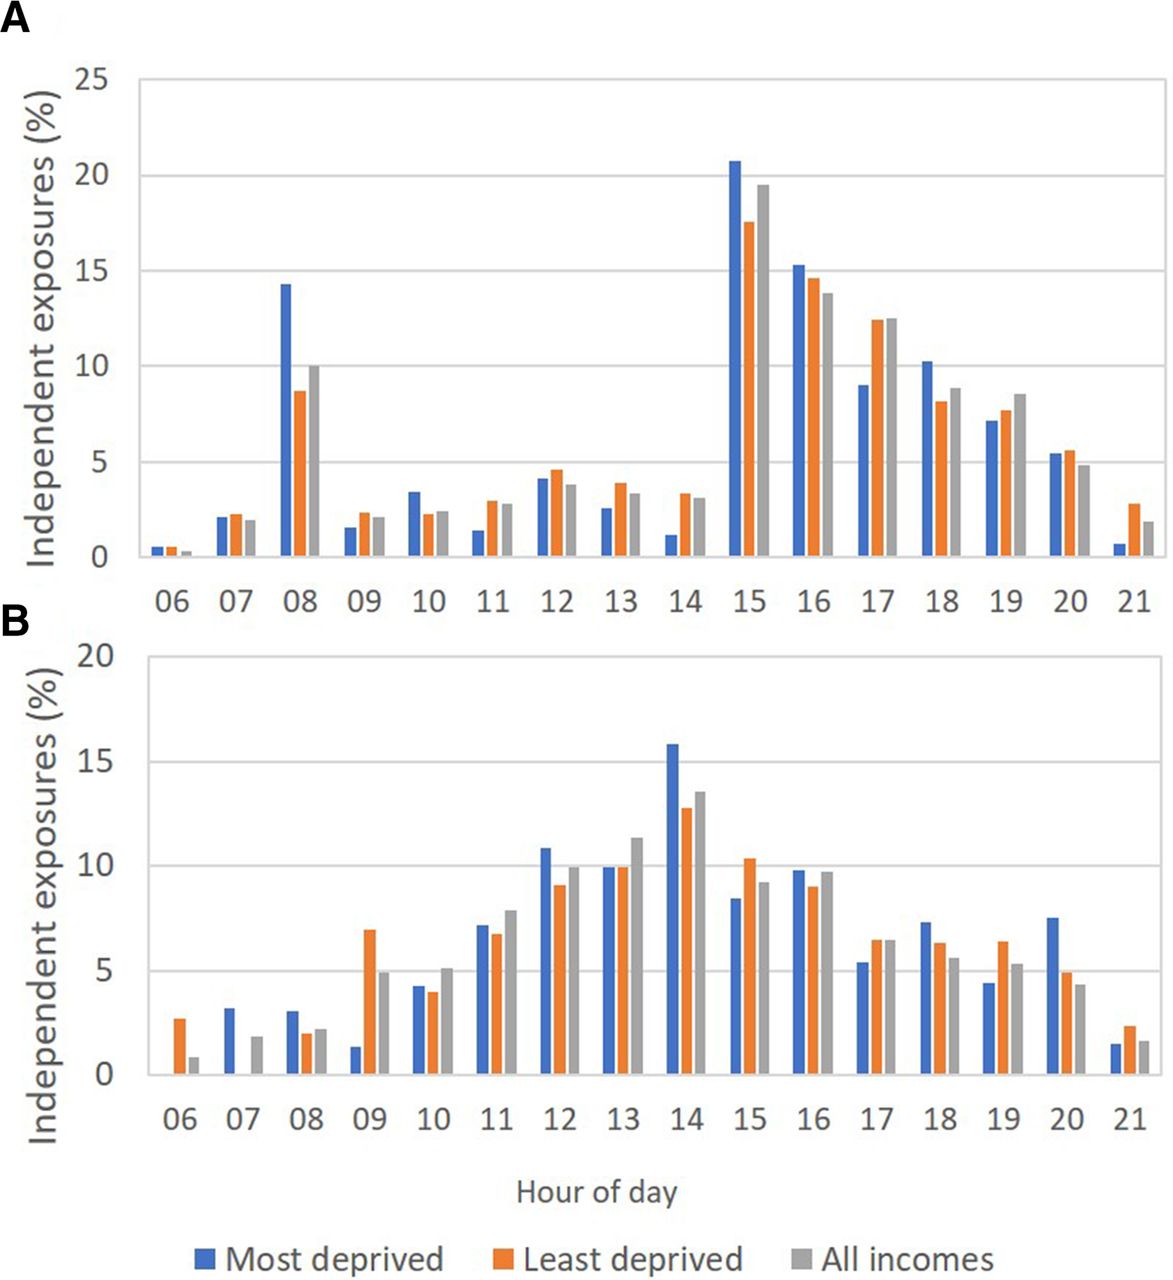
Considerable peaks were seen in the timing of exposure for children from across all income deprivation levels. On weekdays, 46% of total exposure occurred after immediately school between 1500 and 1800, with 10% occurring before school between 0800 and 0900 (figure 1A). Rates of exposure were reduced during school hours (0900–1500). On weekends, exposure was elevated between 1200 and 1700 when 59% of exposure occurred (figure 1B).
Proportion of daily exposure to tobacco retailing experienced by participants by hour of day and income deprivation level on weekdays (A) and weekends (B).
Despite following a similar temporal trend, the hourly distribution of exposure was significantly different on weekdays and weekend days between children from income deprived and non-deprived areas (both p<0.001). The weekday morning (0800–0900) and afternoon (1500–1600) peaks were higher among children from income-deprived areas. Weekend days also saw a higher peak in exposure during the hours 1200–1500 among those from income-deprived areas compared with those from non-deprived areas.
Discussion
This is the first large-scale (n=692 participants) study to quantify exposure to tobacco retailing environments within the individual daily activity spaces of preadolescent youths and socioeconomic associations therein. As such, it represents a significant advancement in our understanding of how often tobacco retailers are encountered in an understudied, yet key, demographic group. We found that an average 10–11-year-old child in Scotland is exposed to tobacco retailing for 22.7 min (16.8–28.6) per week. Most notable, however, was the significant socioeconomic gradient in exposure, in which children from areas with the most income deprivation accumulated six times the duration, and seven times the frequency, of exposure than children from areas with the least income deprivation. In other words, children in income-deprived areas typically experienced more exposure in 1 weekend day (13.0 min: 5.8–20.2) as those from non-income-deprived areas experienced in a whole week (11.3 min: 7.4–15.1). From a public health perspective, this is a concern given that exposure to tobacco products is a potential pathway to smoking initiation.14 15 It means that children from income-deprived areas, who are already vulnerable to smoking initiation,45 experience the most exposure to tobacco products prior to adolescence, a critical period of addiction vulnerability.46 Additionally, the magnitude of the socioeconomic inequality in exposure revealed by our study is considerably larger than the 2.6-fold difference in tobacco retailer density in the home neighbourhood. This strongly suggests that static aerial measures, such as outlet density, may underestimate exposure inequalities compared with use of activity spaces that account for interactions between individual mobility and environment.35 36
Simulation studies show that socioeconomic inequalities in smoking prevalence will persist in 2034 if the UK continues with ‘business as usual’ tobacco control policies, with smoking rates of <3% in the upper income quintile smoking compared with 15% in the lowest income quintile.47 Radical actions are therefore required if the ‘tobacco-free generation’ ambition is to be realised. Our results suggest that targeting policies to address the timing and type of retailer selling tobacco, or the spatial distribution of retailers, may be ways to reduce the gap. We found that a third of all exposure came from convenience stores, rising to over 40% in deprived areas, which reflected their availability. Exposure from supermarkets was disproportionate to availability across all income deprivation levels, particularly on weekends when children presumably accompany their parents grocery shopping. Interestingly, children from deprived areas got less exposure from newsagents, while the opposite was true for the least deprived, which may reflect differences in spending power between quintiles. Clear temporal trends were also apparent, with peaks just before and after school hours on weekdays and around midday into early afternoon on weekends. Extended exposure after the morning peak into school hours among those from income-deprived areas may suggest the schools they attend have tobacco retailers close by.
Policy implications
Possible policy responses to our results are to prohibit sales of tobacco either in shops frequented regularly by children (eg, convenience stores, newsagents, supermarkets) or at the times of day when children are more likely to visit (eg, before and after school hours). Previous studies suggest that such policies may be heavily resisted, however. In a feasibility study to determine willingness of New Zealand convenience store owners to stop selling tobacco, or restrict hours of sale, almost all (93%) refused to do so voluntarily.48 This was primarily because tobacco is perceived as a key product for small local businesses for generating footfall.48 Reducing the availability of tobacco in communities may therefore require a combination of building public consensus and legislation to disincentivise retailers from selling tobacco products. Encouragingly, policy options such as banning sale of tobacco products near schools can be effective at reducing retailer density in lower income areas and reducing socioeconomic disparities while receiving strong public support.49 50 Determining policy interventions that are most effective in reducing overall exposure and socioeconomic inequalities is therefore a priority for future research.
Strengths and limitations
The main strength of our study lies in our quantifying individual-level exposure within child activity spaces using precise child and retailer location data from a large and nationally representative sample of children. This offers a significant advantage over previous studies adopting neighbourhood or density measures, which assume exposure by virtue of residential or school location. Collecting GPS data at 10 s intervals allowed us to quantify continuous real-time exposure, unlike previous studies quantifying exposure to tobacco retailing with GPS data collected at 15 or 30-minute intervals.35 36 Our methodology takes our understanding further by providing additional insight into the temporal distribution and the sources of exposure. Additionally, we now have a baseline of tobacco exposure for our sample who will be followed up longitudinally as part of GUS, allowing us to track their future smoking trajectories. Our use of an area-based measure of income deprivation also meant we were able to explore how differences in exposure are driven by the positive skew in retailer density towards more deprived areas.
Our study was limited, however, in that we do not know whether the children entered a shop or what the prominence and visibility of tobacco products was within shops. We also did not remove GPS locations at speeds indicative of travel by bicycle or motor vehicle. We do not know how successive exposures accumulate and influence subliminally—or what a suitable threshold speed would be. Instead we assume that all exposure adds environmental cues to the social normalising process of tobacco availability. In addition, we know little of how a spatial concentration of outlets may relate to other smoking stimuli in the environment to further normalise smoking behaviours. Finally, children from income-deprived areas were less well represented in the sample than those from less-deprived areas due to non-responses by those approached to be involved in the study.
Conclusions
Our study highlights how exposure can be more precisely quantified in tobacco studies to better understand everyday encounters with tobacco retailing. In doing so, our findings raise important questions regarding children’s exposure to the tobacco retailing environment and the significant inequalities therein. Understanding of the timing, frequency, duration and source of tobacco retail exposure provides some of the evidence required to open the debate on tobacco retailing in Scotland. Reducing exposure through licensing, restricting sales in ‘child spaces’ or restricting sale times may become essential elements of a strategy to eliminate the tobacco epidemic.
What this paper adds
This study is significant because it reveals how much greater socioeconomic disparities in tobacco retail exposure become when individual mobility is accounted for.
By implementing cutting-edge methodology for measuring continuous real-time exposure to tobacco retailing, we were able to identify socioeconomic inequalities of greater magnitude than disparities in neighbourhood measures of density would indicate.
This forms a significant contribution to the policy debate on tobacco availability.
Our findings highlight a need to take interactions between individual patterns of mobility and the retail environment into account when considering any supply-side intervention.
However, the observed socioeconomic gradient in exposure (as measured by income deprivation level) suggests that any moves to either reduce retail outlets, or restrict time of sales, will have a greater impact on, and indeed benefit to, more deprived income groups who suffer the greatest amount of tobacco-related harm.
Acknowledgments
The authors thank Linsay Gray, Rebecca Mancy, Jon Olsen, Laura MacDonald and Natalie Nicholls for comments that greatly improved previous drafts of this manuscript.
References
Footnotes
Contributors All authors designed the study. FC devised methodology, extracted data and conducted the analysis. All authors contributed to writing, revision and approved the final manuscript.
Funding This research was funded by NHS Health Scotland. FC and RM are part of the Neighbourhoods and Communities Programme supported by the Medical Research Council (MC_UU_12017/10) and the Chief Scientist Office (SPHSU10).
Competing interests No, there are no competing interests.
Patient consent for publication Not required.
Provenance and peer review Not commissioned; externally peer reviewed.
Data sharing statement No data are available.