Article Text

Abstract
Background While there is a large literature on the magnitude of price elasticity of cigarette demand, less is known about the same for chewed tobacco. Moreover, the studies on cigarette demand in Pakistan tend to ignore the heterogeneity in the smoking behaviour. This study estimates price elasticity for cigarette and chewed tobacco demand across different income groups, provinces and regions; and use these coefficients for simulating Pakistan’s tax policy and its impact on revenue and health outcomes.
Method Deaton model was applied on the 2015–2016 Household Integrated Income and Consumption Survey dataset to estimate price elasticities of different tobacco products.
Results The demand for cigarettes is unitary elastic (−1.06), suggesting that a 1% increase in cigarette price would reduce its consumption by 1.06%. On the other hand, the demand for chewed tobacco is relatively inelastic (−0.55). Provincially, the own-price elasticity of cigarettes is negative and significant for all but Kyber Pakhtunkhwa (KP) province; whereas that of the chewed tobacco is negative and significant only for KP and Balochistan. Besides, the price elasticity of demand for both tobacco products is negative and significant only for lower income group and the rural region. The tax simulations favour a two-tiered tax system over the existing three-tiered system as the former will bring significantly better tax revenue and health outcomes.
Conclusions While confirming the effectiveness of tax policies in curbing tobacco use, this study concludes that higher tobacco taxes could increase tax revenue and improve public health in Pakistan.
- tobacco consumption
- cigarette demand
- price elasticity
- Pakistan
Statistics from Altmetric.com
Introduction
With around 24 million active adult tobacco users, Pakistan ranks among the largest tobacco consuming countries in the world.1 The prevalence rates among men and women are 32.4% and 5.7%, respectively.2 Among in-school youth (aged 13–15 years) in different cities, tobacco prevalence ranges between 6.1% and 14.1%. According to Household Integrated Income and Consumption Survey (HIICS 2015–2016), 45% of the Pakistani households reported some sort of tobacco consumption. Considering that tobacco consumption takes heavy toll on human health,3 4 Pakistan needs strict tobacco control measures. To this end, the country has already signed the WHO’s Framework Convention on Tobacco Control in 20055 and since then has introduced various non-taxation policies including pictorial warnings on cigarette packs; smoking bans; ‘No Smoking’ signs in public places and vehicles; bans on cigarettes sale to minors, active advertisements campaigns and distribution of free samples.4 6 However, the policies’ implementation is generally weak7 and raising concerns that contrary to its commitment of 30% reduction in the tobacco prevalence by 2025, the trend may actually rise in Pakistan.8
The weakest action area in the country’s combat against tobacco is its taxation policy despite it being an effective tool to reduce tobacco consumption. Globally, ample evidences exist for tobacco taxation policies that simultaneously result in curbing tobacco consumption and raising revenues.9 Assuming a complete pass-through of tax to price, the extent of reduction in tobacco consumption in response to a tax increase depends on price elasticity of the tobacco demand. Hence, price elasticity is an important factor for tobacco prevalence and may vary between −0.25 to −0.50 and −0.5 to −1.00 in high-income and low-income countries, respectively.10
Tobacco is also subject to multiple taxes in Pakistan including sales tax, corporate income tax and local tobacco cess. However, federal excise duty (FED) is the prime instrument to discourage its consumption. In practice, however, it is generally perceived as an important industry and a major source of government revenue.11 In 2015–2016, the cigarette industry contributed 2.15% of total tax collections and 43% of the FED which stood around US$1 billion.12 Nevertheless, in the South Asian region, cigarettes are the cheapest in Pakistan, and in 2018, a Pakistani consumer could buy 4.9 and 2.5 packs of Marlboro against the one pack price of the same in Sri Lanka and India, respectively.13 Still cigarette industry in Pakistan oppose any tax increase that could raise prices, arguing that with ~40% illicit trade, tobacco consumption may remain unabated, but the country would certainly lose tax revenue. In the absence of any reliable estimates of price elasticities and illegal trade, policymakers often resort to industry data and decide tax regimes that may favour them. The latest example is of 2017 when the industry obtained a favourable tax regime through the introduction of a three-tiered system without restricting the tier shifting of brands. Consequently, the brands in the second tier were shifted to the third tier (with lowest FED rates) by the industry, bringing the cigarette prices down.13
Unfortunately, tobacco research in Pakistan in general and that on the price elasticities in particular is scarce. Previously, only two studies4 14 estimated such elasticities using time series data of prices, income and cigarette sales at national level. However, these studies not only assume individual behaviour to be homogenous across the entire population but also ignore heterogeneity in price elasticity across income groups, region (rural/urban), and provinces. Any simulation (say, a tax increase) based on these estimates may hinder effective policymaking. Likewise, since chewed tobacco products are used in large amounts but remain untaxed, price elasticity estimates for these products need to be accounted for in tobacco control policies. Since, Pakistan lack such comprehensive estimates of price elasticities of cigarette and chewed tobacco demand, the current study estimates these price elasticities using microlevel data and conduct a heterogeneous analysis with respect to income, region and province. These estimates advance the understanding of tobacco tax changes’ impact on different populations, and also provide input for the simulation modelling used for recommending policies related to the tax structure.
Methods
Data
We used HIICS 2015–2016, to calculate the price elasticities and simulate the impact of different tax regimes on tobacco consumption.15 HIICS 2015–2016 is a nationally representative dataset of 24 238 households spreading over 1605 primary sampling units across the four provinces and adequately represents rural and urban areas in each of the province. The urban sample consisted of 16 155 households selected from 1087 enumeration blocks. The remaining households constituted the rural sample living in 518 villages. The consumption module required households to report the total quantity consumed and the total expenditure incurred on various tobacco items in 1 month preceding the survey. Following the study’s objective of estimating price elasticity across various dimensions, a meaningful disaggregate analysis was plausible only when focusing on cigarettes and chewed tobacco, and setting aside other scarcely reported tobacco items such as pan, biri, betel leaves, betel nuts and so on. The HIICS provide information on Capstan and Gold Leaf separately. The remaining brands are collectively categorised as ‘others’. However, the major brands’ quantities were reported in per pack of 20 sticks while that of the others in numbers of sticks. We standardised different quantities of cigarettes to the number of sticks using simple multiplication, whereas, the unit values per pack were obtained simply by dividing each brands’ total consumption (expenditure) by their respective quantities in sticks. All brands’ unit values were then summed up to get overall unit value per stick for cigarette. Chewed tobacco, on the other hand, was recorded as a composite commodity which also includes saunf, naswar, gutka.
Empirical methodology
A drawback of relying on cross-sectional surveys to estimate price elasticity is the lack of data on prices for tobacco products. Ideally, one may utilise regional price data as used for the construction of consumer price indices. However, due to unavailability of location specific tobacco prices, one cannot opt for this approach.16 Alternatively, unit values (expenditure/quantity) can also be used but these are plagued by measurement errors and quality variations. Nonetheless, it encompasses important information regarding prices which could be utilised in the estimation of price elasticities. Deaton17 18 provided a fairly intricate model having two-equation system of budget shares and unit values that correct measurement errors and quality variation issues. The model assumes no within-cluster variations. The Deaton model is worked out on three distinct stages: (1) the effects of household characteristics are purged from the budget shares and unit values. These characteristics include household size, mean household education, highest degree obtained by a member of the household, education of the head of the household, number of adults in the household, number of male members in the household, number of earners in the household, region and province of residence. The number of adults and male members have been taken as ratio to the household size in the empirical analysis. (2) The unit values and budget shares are averaged over clusters (villages or enumeration blocks) and then used to estimate intercluster error-in-variables regressions. (3) By applying the separability assumption, the quality and price effects are extricated. The symmetry restrictions are added to increase the precision of the parameters.
The HIICS provides cross-sectional information on households’ expenditure and consumed quantity of various tobacco products. It collects data from clusters of households that are living in a small geographical area, with no substantive intracluster variation in market prices. These data are exactly according to the requirements of Deaton’s Model making it the obvious methodological choice for the estimation of the price elasticities of tobacco demand. Further technical details on the empirical specification of the model are available from the authors.
Based on price elasticity estimate, we simulated the impact of different cigarette tax regimes on tobacco-related outcomes such as cigarette consumption, tax revenue, number of current and future smokers as well as the number of smoking related deaths. For simulation exercise, similar to the one used by Goodchild and coauthors19 the three-tier structure of 2017–2018 is used as the baseline. The retail price for each tier is calculated by adding the production price, FED, value added tax (VAT) and profit margin for that tier. The overall average retail price is then averaged across tiers and weighed by their respective market shares. The average FED and VAT are calculated on the same lines. The VAT is assumed to be 17% of the value obtained after adding production price, FED and retail margin. Based on the average FED and VAT and reported production of cigarette sticks, the baseline revenue is worked out to be PKR 92.4 billion (US$770 million). For the baseline calculation of smoking-related deaths, the parameters are assumed as follows: the smoking prevalence @ 10.5% for adults and 3.3% for youth based on GATS1 and GYTS,20 respectively. Following previous studies,19 the risk of smoking-attributable death and the mortality adjustment factor are assumed to be 50% and 70%, respectively. The number of smoking-attributable deaths averted as a result of tax increase is estimated as 70% of 50% of the reduction in the number of daily smokers caused by the tax-induced increase in cigarette prices.
Results
Tobacco prevalence
Tobacco consumption is widely prevalent with 45% of the HIICS households reporting using it in some form, of these 26% had cigarettes smoking and 13% had tobacco chewing members (table 1 Panel A). Prevalence of all tobacco products is reportedly higher in rural than urban areas. Furthermore, households allocate ~3% of their budget to tobacco products. In both regions, this share is higher for cigarette consumption than for users of chewed tobacco owing to the latter’s lower prices. While budget shares for chewed tobacco do not show regional differences, urban households do allocate higher budget share than their rural counterparts for cigarette consumption.
Household-level tobacco prevalence across regions, provinces and income groups (%)
The provincial layer reveals interesting regional variations in tobacco prevalence (Panel B). Two-thirds of the households in Balochistan reported tobacco consumption having the highest and second highest percentages of cigarette and chewed tobacco users, respectively. Punjab has the lowest percentage of tobacco consuming households (40%) among all provinces. Khyber Pakhtunkhwa (KP) presents the lowest prevalence of smoking but has the highest percentage of chewed tobacco. The highest chewed tobacco consumption in KP followed by Balochistan has to do with the tradition of chewing naswar by Pashtuns—the ethnic group dominating the population in both provinces. Sindh maintains its third position in consuming cigarettes and chewed tobacco though its overall tobacco prevalence stands as the second highest in the country. Budgetary allocations for tobacco expenses are the highest in Sindh and lowest in KP.
Panel C reveals the prevalence and budgetary shares of tobacco products across the two income groups, namely upper 40% and lower 60%. Clearly, the prevalence of smoking exceeds that of the chewed tobacco in both the groups. The lower income group, however, apportions higher share of their budget on tobacco consumption and may, therefore, face strong welfare toll compared to their higher-income counterparts.
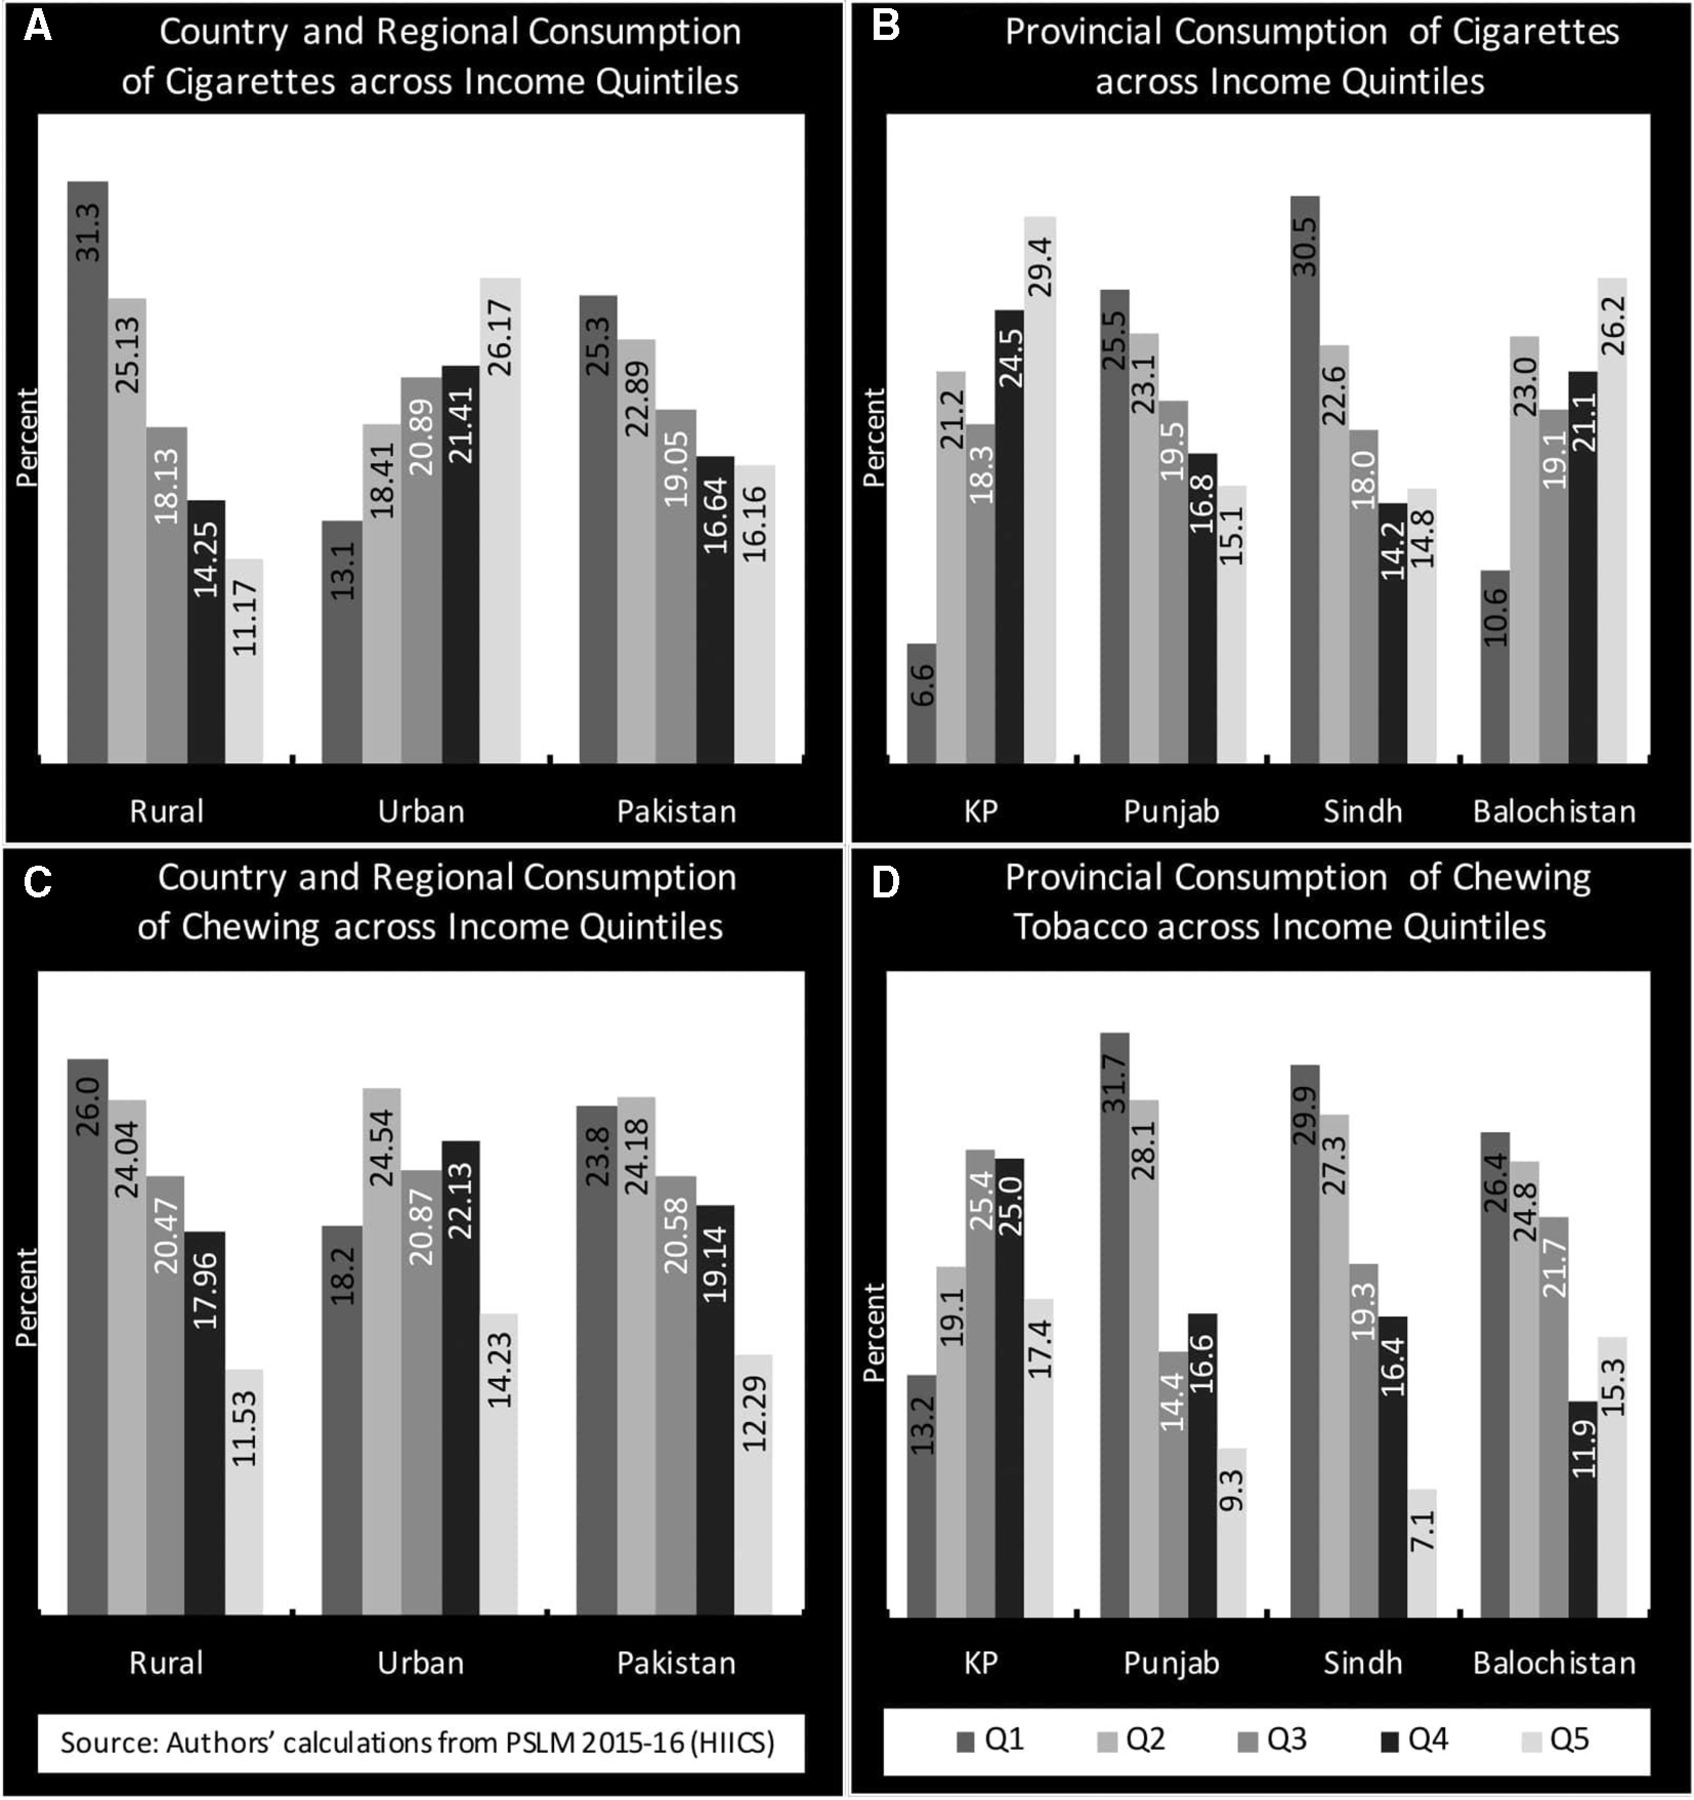
Figure 1 demonstrates cigarette and chewed tobacco consumption across income quintiles by region and province. These tobacco products are mostly consumed by the lower/middle-income households while the prevalence rate for these products, barring a few exceptions, is lower among the highest income quintiles. The World Health Survey report for Pakistan corroborates the consumption pattern found in this study vis-à-vis the income levels.2

Tobacco consumption by income quintiles across regions and provinces. KP, Khyber Pakhtunkhwa.
As evident from figure 1 (panel A), regional cigarette consumption reveals different consumption patterns for rural and urban areas. Contrary to the trend in rural areas, the prevalence rate in urban areas is highest in the upper income quintiles. For chewed tobacco, higher consumption is observed in the lower income quintiles in the rural areas. The urban areas, on the other hand, have a mixed distribution of consumers; yet we observe that highest income group has the lowest proportion of tobacco chewers (figure 1, panel C).
The provincial graphs reveal interesting patterns of cigarette consumption across income quintiles (figure 1, panel B). For instance, both Punjab and Sindh follow a similar pattern of cigarette consumption as is observed for Pakistan. However, in case of KP, the pattern is reversed. Not only does the province have the lowest percentage of cigarette consuming households (see table 1, panel B), it also has the highest proportion of consumers in the top income quintiles. This can have important implications for price elasticity of cigarettes in the province. A similar trend, though a less pronounced one, can also be observed for Balochistan. Households in the fourth and fifth-income quintiles (the top 40%) in KP and Balochistan consume 54% and 47% of the total smoked cigarettes, respectively. Figure 1, panel D presents chewed tobacco consuming households across income quintiles in the four provinces and show trends somewhat similar to those of the cigarette, except in case of KP which has a bell-shaped distribution implying that chewed tobacco is consumed in significant proportions across all income groups. Interestingly, in all the four provinces, >50% of the consuming households lie in the lower income group (the bottom 60%).
Unit values and price elasticity
If the unit values were to be treated as prices, then the price of cigarettes and chewed tobacco in Pakistan is PKR 1.91 (US$0.02) per stick and PKR 0.42 (US$0.003) per gram, respectively. These prices do not vary significantly across regions. Cigarettes are found to be expensive in Balochistan (PKR 2.28) and cheapest in KP (PKR 1.63). Similar pattern is observed for chewed tobacco. The unit value for cigarette is higher (PKR 1.87) for upper income group compared with the lower one (PKR 1.02). For chewed tobacco, however, these are broadly similar for both income groups.
Before discussing the price elasticities, one must look for evidence that spatial variation in unit values explains significant variation in prices. This can be obtained by regressing the log of unit values on village (cluster) dummies and observing the values of F-statistics and R squared. Due to relatively small intra-cluster variation over a short time period, a larger share of variation should be coming from inter-cluster disparities in prices. Empirically, this means a larger R squared or a significant F-statistics. The analysis of variance (ANOVA) analysis in Panel A of table 2 reports these values. These results suggest that the cluster effects explain 43% and 72% variation in prices of cigarette and chewed tobacco, respectively. The significance of both F-statistics at conventional significance level provides sufficient evidence for link between variation in unit values and spatial price variation.
Variation in log unit values and price elasticity for tobacco products
The results of symmetry-constrained own-price elasticities for cigarettes and chewed tobacco as well as the cross-price elasticities are presented in table 2 (Panel B) with their respective bootstrapped SE estimates in parentheses. The own-price elasticities for the given tobacco products have negative signs and are statistically significant at 1% level. The own-price elasticity of cigarettes is −1.06 suggesting that a 10% increase in the price of cigarettes in Pakistan will decrease its demand by almost the same percentage (ie, 10.6%).
The own-price elasticity for chewed tobacco in Pakistan is −0.55, suggesting that a 10% increase in the price of chewed tobacco products will decrease its demand by 5.5%. There are no comparable studies for this product, perhaps due to the aggregated nature of this commodity. As far as the cross-price elasticities are concerned, they are economically small and statistically insignificant indicating that these products are independent of each other. Table 3 presents the disaggregate analysis of own-price elasticity estimates across regions, provinces and incomes groups. The own-price elasticities of cigarette and chewed tobacco products are negative and significant for the rural but insignificant for the urban regions. This could be due to the fact that, in contrast to urban consumers who mostly belong to higher income group, the rural consumers, constrained by their budgets, are forced to cut down the tobacco use in face of a price hike.
Disaggregate analysis of own-price elasticities
On the provincial level, the own-price elasticity of cigarettes is insignificant for KP while it is negative and significant for the others. This outcome is substantiated with findings in table 1 and figure 1. The cigarette price elasticity estimates for the rest of the provinces are similar in sign, significance and magnitude. The own-price elasticity of chewed tobacco product is negative and significant for KP and Balochistan but insignificant for Punjab and Sindh. Although these elasticity estimates indicate provincial differences in demand for chewed tobacco products, one cannot accurately interpret these due to the aggregated nature of this commodity.
Tax simulation
As mentioned in the Empirical methodology section, the baseline revenue is found to be PKR 92.4 billion (US$70 million). Consequently, the current analysis simulates three tax regimes using the price elasticity estimate (−1.069) reported in table 2. The first regime (scenario 1 in table 4) simulates the effect of the most recent changes in the FED rates for the three tiers. The second scenario (scenario 2) simulates the impact of a two-tiered system that was effective prior to the three-tiered system. The third regime (scenario 3) equalises the FED rate between the second and the third tier, essentially making it a two-tiered system. In this case, the FED rate in the first tier is kept unchanged as it makes the average final cigarette price include a tax up to 70%. Since the cigarette manufacturers absorb a significant portion of tax increase in Pakistan, the pass-through effect of cigarette tax increases into final price is 80%.21 The study, therefore, runs these simulations for complete pass-through effect as well as when it is 80%.
Model simulations of pass-through effect of different tax regimes
Scenario 1
The first simulation examines the impact of recently revised FED rates on tax revenue and various other smoking-related outcomes. The revised rates are PKR 90.0 (US$0.75), PKR 36.8 (US$0.30) and PKR 25.0 (US$0.21) per 20-cigarettes pack for the first, second and third tiers, respectively. table 4 reports the projected values for both, complete and 80% pass-through. For practical reasons, focus here is solely on the outcomes obtained using a partial pass-through. The projection results reveal that the average FED and retail price (weighed by market shares of tiers) for a pack of 20 cigarettes is expected to increase to PKR 31.8 and PKR 67.7, respectively. Although FED makes 47% in this average price, the share of total taxes (including VAT) would increase to 62% resulting in a reduction of 16% in cigarette consumption, compelling 1.2 million adults to quit smoking and a 6% decrease in smoking related premature deaths. On the other hand, the excise tax revenue will increase by PKR 11.62 billion (US$96.8 million) contrary to that attainable under the baseline tax rates. The increase in total tax revenue, however, would be PKR 11.59 billion, suggesting a reduction in revenue collected through VAT. That is, increase in revenue due to increase in VAT is outweighed by the reduction in revenue due to people quitting smoking.
Scenario 2
The feasibility of this option in terms of revenue and other outcomes necessitates simulating this scenario as well. Here, the simulations are run for a two-tiered structure with FED values prevailing prior to the current regime, when the corresponding FED rates for the first and second tiers were PKR 74.1 and PKR 32.98, respectively. For 80% pass-through, the average retail price would be PKR 71.8, and excise tax would make ~50% of this price. Nonetheless, the share of total taxes in the price, increases to 65%, reducing the cigarette consumption by 23.6% (7.5% higher than scenario 1), encouraging 1.7 million adults to quit smoking and avert 600 000 deaths among the current adult smokers. Compared with the three-tiered tax system, this regime would refrain 80 000 adults from being future smokers and avert premature deaths of 40 000 young smokers. Addition in excise tax revenue would be PKR 13.59 billion (US$113 million) which is significantly higher than the current tax structure. The overall tax revenue would be PKR 105.43 billion (US$878.5 million) (PKR 13 billion increase compared with tax collection using baseline FED rates). The improved values for tax collections as well as for the public health outcomes establish the superiority of the two-tiered system over prevailing three-tiered structure. Abolishing the current three-tiered system altogether is preferred over increasing the FED rates within it.
Scenario 3
With the superiority of the two-tiered structure established, it would be interesting to see how such system would behave with the recently revised FED rates. This is done by increasing the FED rate of the third tier from PKR 25 to the second tier’s FED rate of PKR 36.8, effectively converting the three tiers into two tiers. The average FED will now increase to PKR 40.95 resulting in an average retail price of PKR 77.1. The share of FED and total taxes in the retail price would be 53% and 68.5%, respectively, with the latter being very close to the 70% recommended by the WHO. The resultant decrease in cigarette consumption will be about 33% which is 10% higher than scenario 2. As for the smoking-related outcomes, the new scenario is expected to reduce the number of adult smokers by 2.4 million, premature deaths in adult smoker by ~0.86 million besides refraining ~0.12 million young persons from being future smokers. The total reduction in the number of smokers is projected to be around 2.6 million which is significantly higher than previous two scenarios. Similar results emerge for premature deaths among adult and future smokers. Additional FED revenue would be similar as was in scenario 2 but there would be a net reduction of PKR 1.25 billion (US$10.4 million) in total tax revenue.
Discussion and conclusions
This paper is the first attempt to estimate the price elasticity of cigarettes and chewed tobacco using household level data while also considering the spatial heterogeneity across regions and provinces as well as income groups. The unitary price elasticity for cigarette demand found in this paper is in contrasts with that of Burki and coauthors4 whereby the same elasticity was found to be –0.58 for Pakistan. This high price elasticity can be explained with the fact that majority of the consumers come from the lower income group who are relatively more responsive to price changes (see figure 1 and table 3). Existing literature from Pakistan,14 India,22 Bangladesh23 and Nepal24 too shows that getting a unitary elastic demand for cigarette is not uncommon in the South Asian region. From policymaking perspective, the introduction of a three-tiered tax structure by the government and the subsequent increase in cigarette sales confirm the validity of these findings of price responsiveness of tobacco demand. Thus, we tend to support the idea that tax increase would reduce cigarette demand without raising illicit trade as argued by tobacco manufacturers when opposing any increase in tax rates.
Moreover, the simulation exercise establishes superiority of the two-tiered over a three-tiered tax system. The two-tiered system would be easier to implement, disincentivise tobacco companies to manipulate prices and increase the overall tax collections. Although the total tax collections do not significantly differ between the two variants of the two-tiered tax scenarios, in one (scenario 3) we, however, see a significant improvement in public health outcomes. The decision of whether to opt for scenario 2 or scenario 3 is, thus, contingent on the importance assigned to the respective outcomes that is, the tax collection or public health outcomes. This finding accentuates the need for estimating the health cost attributable to tobacco consumption to get accurate estimates for the assessment of various tax regimes. An important limitation of the study is that we could not perform the scenario analysis for chewed tobacco. This was due to lack of data on different variables and parameters required for this exercise. Future studies may consider conducting this analysis if and when the data get available.
What this paper adds
What is already known on this subject
The price elasticity of cigarette demand in Pakistan has been estimated using time series macrolevel data. However, macro (particularly of the national scope) tend to aggregate the behaviour of different individuals with varying characteristics and thereby ignores the heterogeneity in behaviour. These studies do not control for potential covariates either.
What important gaps in knowledge exist on this topic
Price elasticity of demand has not been estimated for chewed tobacco products in Pakistan. Moreover, price elasticity for tobacco products across income groups, regions and provinces are also not available.
What this paper adds
Using microlevel data, Household Integrated Income and Consumption Survey 2015–2016, the study estimated price elasticity of tobacco demand, and conducted a heterogeneous analysis with respect to income, province and region. These estimates advance the understanding of the impact of tobacco tax changes on different populations, and also provide inputs for the simulation modelling. The simulation exercise confirms the superiority of the two-tiered tax structure over the three-tiered system.
Acknowledgments
These data were previously presented as part of 'Economics of Tobacco Taxation and Consumption in Pakistan', Nayab D, Nasir M, Memon JA et al, Pakistan Institute of Development Economics 2018.
Footnotes
Contributors DN conceived the idea, supervised all steps, obtained the funding and revised the draft versions. MN designed the study, conducted empirical analysis and drafted the manuscript. JAM provided support in drafting the manuscript and revised the draft versions. MK and AH obtained and cleaned all the data and critically reviewed the draft at various stages. All authors read and approved the final version.
Funding This research is funded by the University of Illinois at Chicago’s Institute for Health Research and Policy through its partnership the Bloomberg Philanthropies.
Competing interests None declared.
Patient consent for publication Not required.
Provenance and peer review Not commissioned; externally peer reviewed.
Data availability statement Data are available in a public, open access repository.