Article Text

Abstract
Objective Through a modelling study, we assessed the impact of tobacco price increases on smoking and smoking inequalities by income, and then quantified the subsequent effects on mortality and inequalities in mortality in Korea.
Methods Eleven-year pooled data from the Korea National Health and Nutrition Examination Survey (KNHANES) (n=65 197) were used to estimate the income group-specific price elasticity. The price elasticity was then used to calculate changes in current smoking prevalence and per capita cigarette consumption resulting from a spectrum of hypothetical tobacco price increases. The mortality risk function from the 10-year mortality follow-up data of the National Health Insurance Service-National Sample Cohort (n=293 858, numbers of deaths=14 953) and the current distributions of smoking-related variables from the KNHANES 2015–2017 were employed to estimate the effect of tobacco price increases on inequality in mortality.
Results Low-income Korean smokers were more responsive to changes in tobacco price. Increasing the tobacco price by 100% would achieve the overall reduction of 2.0% for 10-year mortality. For mortality inequalities by income, the relative index of inequality (slope index of inequality) would be reduced by 3.8% (4.8%) for 10-year mortality.
Conclusions This modelling study showed that tobacco price increases in Korea can reduce current smoking prevalence and per capita cigarette consumption in the whole population, and especially among the poor, which in turn would reduce the gap in mortality between income groups.
- disparities
- price
- public policy
- socioeconomic status
- taxation
Statistics from Altmetric.com
Introduction
Tobacco use, an important risk factor for adverse health outcomes,1 2 is concentrated among the disadvantaged subgroups of a society,3–5 thereby contributing to health inequalities.6 7 Prior Korean studies also showed gender gaps in smoking and widening socioeconomic inequalities in smoking prevalence8 and demonstrated significant contributions of smoking to mortality inequalities.6 A previous review indicated that increasing the tobacco price via taxation is the policy measure with the greatest potential to decrease socioeconomic inequalities in smoking.9 Recent reports also support the importance of tobacco price increases in attenuating inequalities in smoking prevalence or cigarette consumption.10–12 Several studies have quantified the magnitude of mortality inequalities (differences in mortality across socioeconomic groups) when socioeconomic gaps in risk factors are reduced.13–17 A few studies also examined the impact of tobacco price increases on health inequalities according to ethnicity and income.18–20 These studies were based on assumptions regarding tobacco price elasticity or health outcomes, derived from other studies. However, to the best of our knowledge, no prior studies directly estimated tobacco price elasticity according to socioeconomic position and its impact on inequalities in smoking and health outcomes, fully using national data. Considering that tobacco price increases through taxation are often criticised as being regressive consumption taxes that disproportionately impact lower income groups,21 examining the population health impact of tobacco price increases according to income level could provide important policy implications. In this study, we developed a two-stage model to explore the impact of tobacco price increases on current smoking prevalence, per capita cigarette consumption and smoking inequalities by income (stage 1) and the impact of those changes on mortality and inequalities in mortality by income (stage 2).
Methods
Setting
This study was conducted in the Republic of Korea (‘Korea’ hereafter) using nationally representative multiyear cross-sectional survey data between 1998 and 2007 and large-scale mortality follow-up data between 2006 and 2015.
Data sources and data usage
In the first stage, data from the Korea National Health and Nutrition Examination Survey (KNHANES) were used to analyse the impact of tobacco price increases on current smoking prevalence and per capita cigarette consumption. The KNHANES is a nationwide cross-sectional survey conducted annually to assess the health and nutritional status of Koreans.22 We used a pooled sample of the 1998, 2001, 2005, 2007, 2008, 2009, 2013, 2014, 2015, 2016 and 2017 waves of the KNHANES. Although they are not panel data, the multiyear repeated cross-sectional data provided sufficient time variation and cross-sectional variation. Information from the KNHANES on sex, age, income and other risk factors related to cigarette smoking was used to estimate the price elasticities of smoking prevalence and smoking intensity through a two-part model.23 In this study, the real price of tobacco, defined as the price of a pack of 20 cigarettes reported at the market level divided by the consumer price index with 1998 as the base year, was used. The KNHANES contained complete information on all variables for 28 514 men and 36 683 women 19 years of age or older. The summary statistics of the variables used in the analysis are shown in table 1 and online supplementary table 1a and b for sex-specific results.
Supplemental material
Summary statistics of study subjects (28 514 men and 36 683 women) from the Korea National Health and Nutrition Examination Survey, Korea
In the second stage, data from the National Health Insurance Service-National Sample Cohort 2.0 DB (NHIS-NSC) (with baseline data from 2006 and follow-up information through 2015) were used to obtain a risk function (Cox regression model) explaining the associations between smoking and the 10-year absolute risk (AR) of mortality. The NHIS-NSC is a population-based sample cohort with a sample size of 1 million people established by the National Health Insurance Service (NHIS) in Korea.24 The Cox regression model was derived using information from the NHIS-NSC on the sex, age, income group, current smoking status, the duration of smoking cessation and per capita cigarette consumption of participants at the 2006 baseline and on the date of death of subjects who died during the follow-up period until 2015. The tobacco price, which has been 2500 Korean won in 2005–2014, was raised by 80% to 4500 Korean won in 2015 (equivalent to US$4). Thus, data from the KNHANES 2015–2017 were used to determine the current distributions of smoking-related variables (ie, current smoking prevalence, the duration of smoking cessation and per capita cigarette consumption). This was done because, for example, the NHIS-NSC at the 2006 baseline would overestimate the current smoking prevalence because the smoking prevalence has decreased since 2006.25
The risk function obtained from the NHIS-NSC was applied to the current distributions of smoking-related variables obtained from the KNHANES 2015–2017 to predict the absolute 10-year risk of mortality under the current distributions of smoking-related variables. The mortality risk in 2015–2017 was obtained for each income group by including an income group variable in the risk function. The risk function from the NHIS-NSC was also applied to the distributions of current smoking prevalence and per capita cigarette consumption modelled under various scenarios (eg, a tobacco price increase from 0% to 100%). We assessed the expected risks under various scenarios against the current predicted risk to examine the effects of adjusting the tobacco price on inequalities in mortality by income.
In both the NHIS-NSC and KNHANES 2015–2017, data from participants aged 19 years or older (the legal age for purchasing and consuming tobacco products) with complete information on all variables were used for analysis. The NHIS-NSC included 149 619 men and 144 239 women, while the KNHANES 2015–2017 included 7630 men and 9835 women. Of a total of 293 858 subjects in the NHIS-NSC, 14 953 died during the 10-year period (see online supplementary table 6).
Socioeconomic position
This study used income as a socioeconomic position indicator for examining socioeconomic inequalities, considering the controversy regarding whether raising tobacco prices is a regressive consumption tax according to income level. In addition, the Korean national health plan, HP2020, set health equity goals by income.26 In the KNHANES, income groups were created by dividing the equivalised household income (household income/(household size)0.5) from household surveys into five groups (income Q1–income Q5) according to sex and 10-year age groups. In the NHIS-NSC, income groups were created by dividing the income-based insurance contributions in 2006 (a proxy for household income) into five groups according to sex and 10-year age groups. Previous Korean studies on socioeconomic inequalities in mortality and life expectancy have used income-based insurance contributions as a measure for income.6 27 28
Statistical analysis
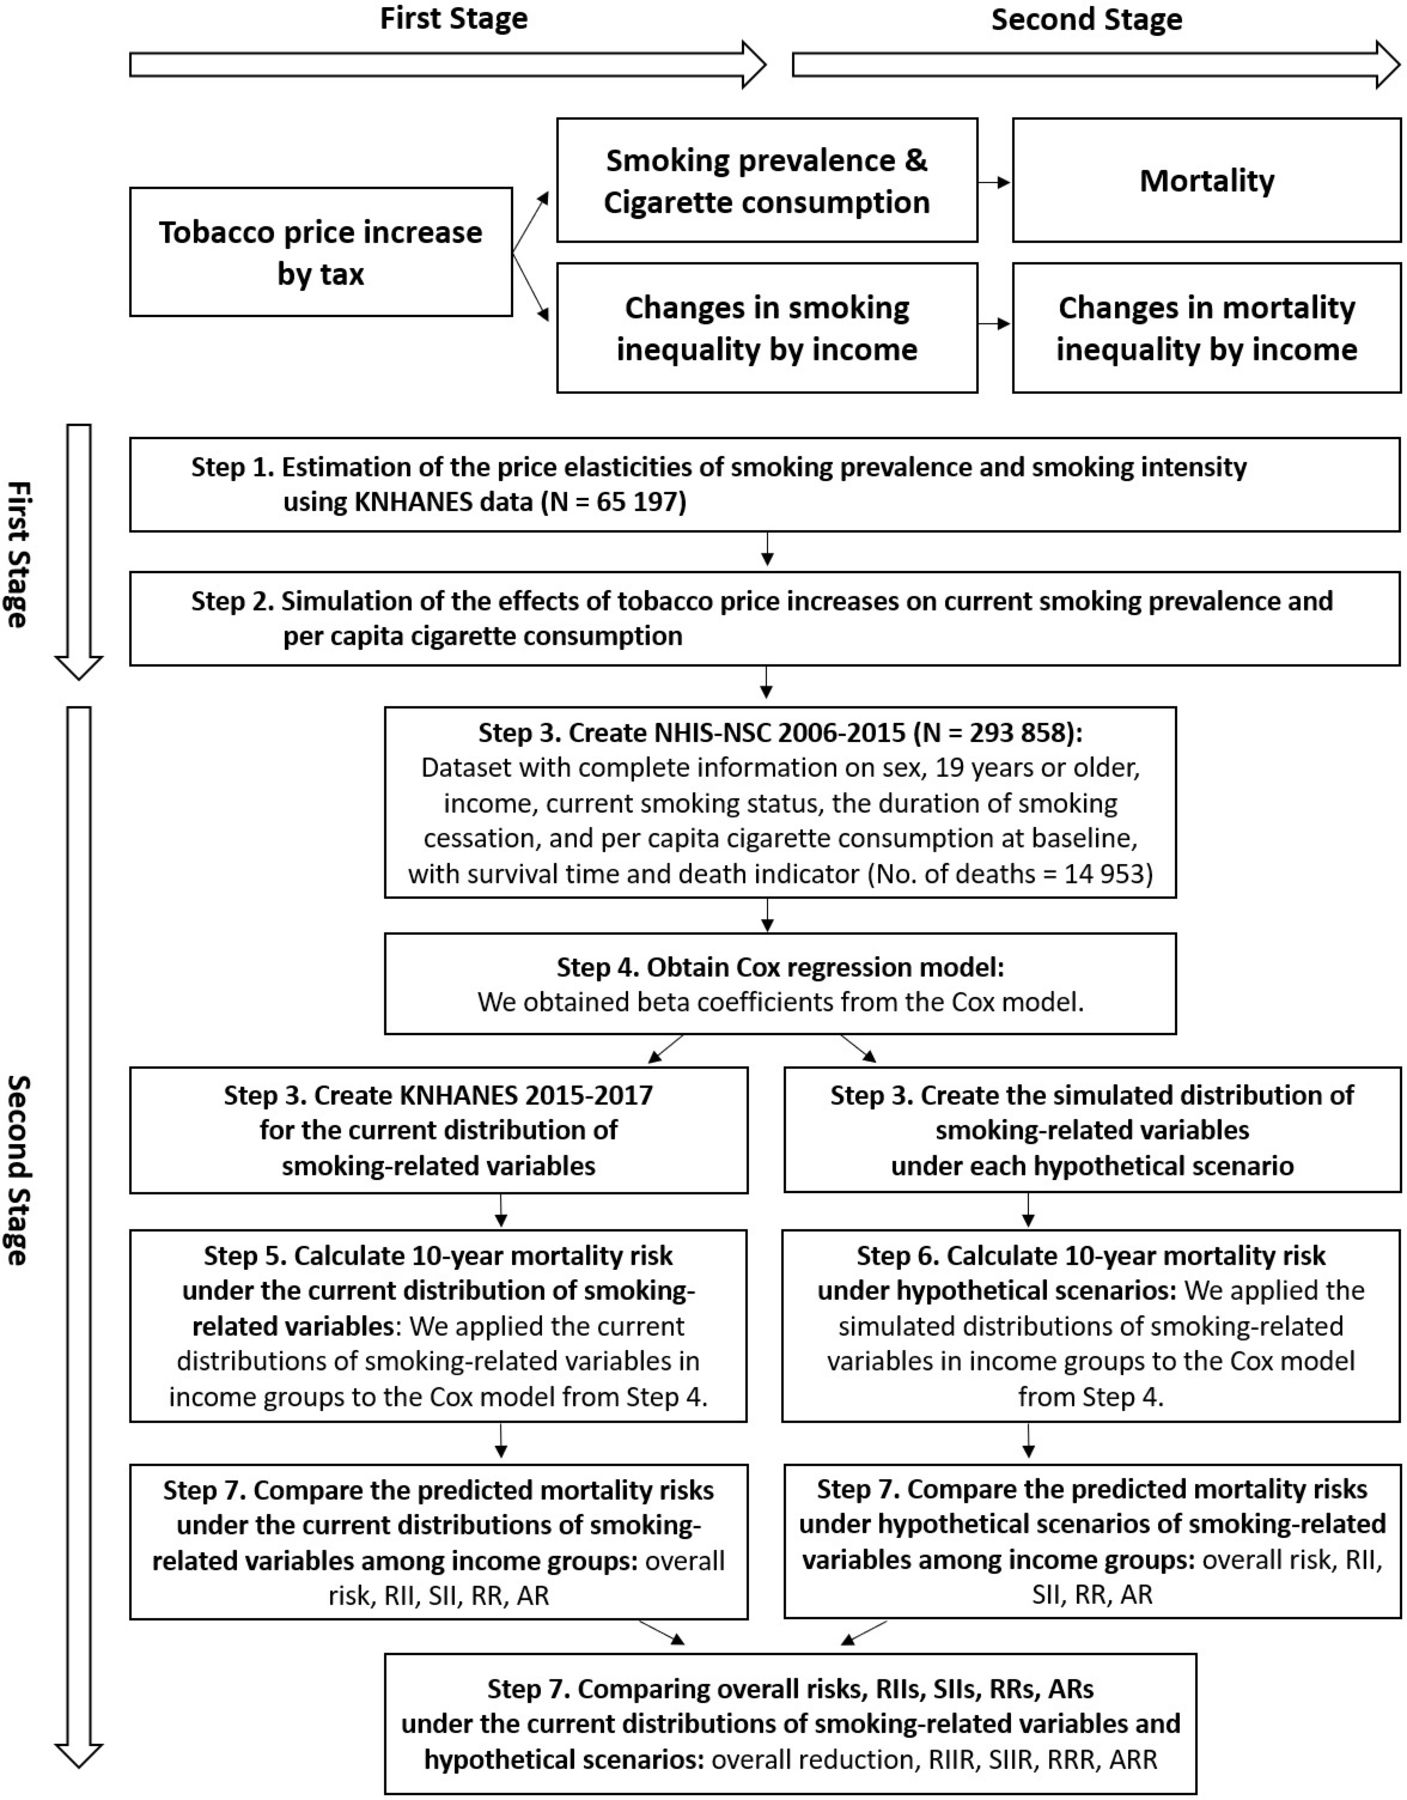
Our analysis was conducted in seven steps (see figure 1 for the analysis flow chart). Further details on the methods used are provided in the online supplementary material.
Graphic representation of the stages performed in the analysis. AR, absolute risk; ARR, AR reduction; KNHANES, Korea National Health and Nutrition Examination Survey; NHIS-NSC, National Health Insurance Service-National Sample Cohort; RII, relative index of inequality; RIIR, RII reduction; RR, relative risk; RRR, RR reduction; SII, slope index of inequality; SIIR, SII reduction.
S1 (price elasticities of smoking prevalence and smoking intensity): we constructed a two-part model for current smoking status and cigarette consumption by current smokers (people smoking cigarettes) using the repeated cross-sectional KNHANES dataset with complete information on sex, age, income and other variables related to cigarette smoking (online supplementary tables 2a-2c3a-3c), and then estimated the price elasticities of smoking prevalence and smoking intensity. The 95% CIs for price elasticities were calculated from 1000 bootstrap samples drawn from the KNHANES.
S2 (scenarios for current smoking prevalence and per capita cigarette consumption according to changes in tobacco price): using the estimated price elasticities of smoking prevalence and smoking intensity together with exponential response assumptions, we calculated the expected current smoking prevalence and cigarette consumption of current smokers according to relative increases in tobacco price (from 0% to 100%): exp (the price elasticity of smoking prevalence * % price increase) * current smoking prevalence; exp (the price elasticity of smoking intensity * % price increase) * cigarette consumption of current smokers, and the expected per capita cigarette consumption was calculated by the weighted average of non-smokers’ smoking amount (0) and current smokers’ expected cigarette consumption, and then set each as a scenario for a modelling study.
S3 (datasets): we obtained NHIS-NSC and KNHANES 2015–2017 datasets with complete information on sex, age, income group, current smoking status, the duration of smoking cessation, per capita cigarette consumption and death indicator and survival time (for the NHIS-NSC).
S4 (Cox regression model for the NHIS-NSC): we constructed a Cox regression model for survival time using sex, age, income group, current smoking status, the duration of smoking cessation and per capita cigarette consumption from the NHIS-NSC data as explanatory variables, and then we obtained β coefficients (online supplementary table 7). The predictive accuracy of the Cox regression model was evaluated by the C-statistic, and all predictive models had excellent abilities. The C-statistics of the models were 0.88 for both sexes and 0.87 for men, respectively. Since the numbers of death by the duration of smoking cessation among women was small (online supplementary table 6), we only presented findings on mortality and mortality inequalities for men.
S5 (10-year mortality risk under the current distributions (KNHANES 2015–2017) of smoking-related variables): we calculated the predicted 10-year mortality risk for each income group under the current distributions of smoking-related variables using the Cox regression β coefficients obtained from S4 and the recalibration method (online supplementary methods).
S6 (10-year mortality risk under hypothetical scenarios): as in the method of S5, we obtained the predicted 10-year mortality risk for each income group under hypothetical scenarios by changing the current distributions of smoking-related variables in the KNHANES 2015–2017 to the distributions of smoking-related variables corresponding to each hypothetical scenario.
S7 (mortality risk reduction): we examined the reduction in mortality risk by comparing the predicted mortality risks obtained from S5 and S6. First, we examined the impact of inequalities in smoking by income on mortality at the whole-population level. Second, we examined the impact of inequalities in smoking by income on mortality inequalities using the following indicators: AR, relative risk (RR), slope index of inequality (SII) and relative index of inequality (RII). The AR and RR were used for absolute and relative pairwise comparisons of different income groups, respectively. The SII and RII are summary measures of absolute and relative inequality, respectively, that are recommended when making comparisons across the population ordered by income level, rather than comparing the two extremes of the social hierarchy.29 30 The results for both sexes combined are presented in the main text, and results for men are presented in the online supplementary materials.
All statistical analyses were performed using SAS V.9.4 and R (www.r-project.org) software.
Results
Table 1 shows the summary statistics of the repeated cross-sectional KNHANES dataset. The dataset consisted of 26% smokers and 74% non-smokers. Most smokers (89%) were male. Younger generations, alcohol drinkers, divorced or single individuals and more stressed people were more likely to smoke.
Based on the estimated price coefficients from a two-part model and Eq. 3 in the online supplementary methods, the price elasticities of smoking prevalence and smoking intensity by income group were calculated, as shown in table 2. For the total samples, the price elasticity of smoking prevalence was −0.442, suggesting that a 10% increase in tobacco price would lead to a 4.42% reduction in current smoking prevalence. The negative price elasticity of smoking prevalence generally declined in absolute terms as income level increased: −0.471, −0.420, −0.371, −0.300 and −0.318, respectively. The price elasticity of smoking intensity conditional on current smokers was −0.241, and the income differences in the price elasticity of smoking intensity were not significant.
Price elasticities (95% CI) of smoking prevalence and smoking intensity by income group, Korea
In the modelling study, the effect of tobacco price increases on current smoking prevalence and per capita cigarette consumption was examined by considering 10% increases in tobacco price, up to 100% of the current tobacco price. As shown in table 3, the estimated current smoking prevalence and per capita cigarette consumption based on the KNHANES 2015–2017 data were 22.93% and 2.94 cigarettes per day, respectively, all of which decreased as income level increased. If the current tobacco price were to be increased by 10%, the current smoking prevalence would decrease from 22.93% to 21.94%, a 0.99% p decrease (=0.2293×(1–exp (–0.442 × 0.1)) based on the estimated price elasticity of smoking prevalence of –0.442, and the per capita cigarette consumption would decrease from 2.94 to 2.87 cigarettes per day for the total sample. Here, the per capita cigarette consumption was calculated by the weighted average of non-smokers’ smoking amount (0) and current smokers’ expected smoking intensity, where current smokers’ smoking intensity according to the tobacco price increases was expected based on the estimated price elasticity of smoking intensity of –0.241, current smokers’ current smoking intensity (13.54 cigarettes per day) and an exponential response assumption. With a gradual increase in the tobacco price from 10% to 100%, current smoking prevalence and per capita cigarette consumption would gradually decrease, and the gap between the high-income group (Q5) and low-income group (Q1) would also gradually decrease in current smoking prevalence and per capita cigarette consumption. A 100% increase in the current tobacco price would cause the current smoking prevalence to decrease from 22.93% to 14.74% and the per capita cigarette consumption to decrease from 2.94 to 2.31 cigarettes per day, and the gap between Q5 and Q1 would decrease from 6.84%p to 2.32%p in the current smoking prevalence and from 1.23 to 1.08 cigarettes per day in the per capita cigarette consumption. All results for the scenarios of tobacco price increases from 0% to 100% are in the online supplementary files.
Simulated impact of tobacco price increases on current smoking prevalence and per capita cigarette consumption by income quintiles, Korea
The first row of table 4 shows the overall mortality risks in the total population in the KNHANES 2015–2017. Under the current distributions of smoking-related variables, the 10-year overall mortality risk is 5.09%. If the current tobacco price were to be increased by 100%, the 10-year overall risk would be reduced by 0.099% p (=5.09%–4.99%), which means that the number of deaths according to the 10-year overall risk would be reduced by 11.6 persons per day (=0.00099 × 42 678 353 persons (population aged 19 years or older in 2017) / 10 years / 365 days), and the relative reduction in 10-year overall mortality risk would be 2.0%.
Effects of tobacco price adjustments under different scenarios on the overall 10-year mortality risk at the whole population level, the relative index of inequality (RII) and slope index of inequality (SII) by income, and relative risk (RR) and absolute risk (AR) by income (income Q1 vs income Q5 presented), Korea
Table 4 presents RII and SII, which are summary measures of relative and absolute inequality, respectively. As the tobacco price increases, the magnitude of the reduction of the RII and SII increases. If the current tobacco price were to be increased by 100%, the reduction in the RII and SII would be 3.8% and 4.8%, respectively.
As shown in table 4, the RR and AR present a comparison of two income groups (the bottom 20% of income (Q1) compared with the top 20% of income (Q5)). If the current tobacco price were to be increased by 100%, the reduction in RR and AR would be 3.3% and 4.7%, respectively. For ease of interpretation, these results can be presented as number of deaths. If the current tobacco price were to be increased by 100%, the AR per 100 000 between income Q1 and income Q5 would be reduced by 102 (=2166–2064), which means that the number of deaths in the low-income group would be reduced by 2.4 more persons per day (=0.00102 × 42 678 353/5 persons (population aged 19 years or older in each income group in 2017) / 10 years / 365 days) than in the high-income group.
Discussion
In this study, we conducted a two-stage model-based study to quantitatively analyse the relationships among tobacco price increases, current smoking prevalence and per capita cigarette consumption (and smoking inequalities by income), and mortality (and mortality inequalities by income). In the first stage, we calculated the expected current smoking prevalence and per capita cigarette consumption (and smoking inequalities by income) according to tobacco price increases (from 0% to 100%). If the current tobacco price were to be increased by 100% (ie, 9000 Korean won=about US$8), the current smoking prevalence and per capita cigarette consumption would decrease by 8.19% p and 0.63 cigarettes per day, respectively, and the gap between the top 20% of income (Q5) and the bottom 20% of income (Q1) would decrease by 4.52% p for the current smoking prevalence and by 0.15 cigarettes per day for the per capita cigarette consumption. In the second stage, we assessed the impact of the changes in the expected current smoking prevalence and per capita cigarette consumption (and smoking inequalities by income) induced by tobacco price increases on mortality (and mortality inequalities by income).
Since smokers in Korea are mostly men, the results for men are of particular interest. The price elasticities of smoking prevalence and smoking intensity for men obtained from the first stage were −0.493 and −0.229, respectively. In the analysis by income group, the negative price elasticity of smoking prevalence for men declined in absolute terms as income level increased: −0.450, −0.446, −0.413, −0.406 and −0.349, respectively, while income differences in price elasticities of smoking intensity for men were not significant (see online supplementary table 4a). If the current tobacco price were to be increased by 100%, the relative reduction in 10-year overall mortality risk for men would be 3.3% (online supplementary table 9). The reduction of the RII and SII for men in response to a 100% increase in the current tobacco price would be 3.1% and 5.5%, respectively (online supplementary table 10).
This study showed a graded decrease (in absolute terms) in the price elasticity of smoking prevalence with income level. The result agrees with prior investigations presenting a linear relationship of income level with the price elasticity of tobacco consumption.20 21 31 32 This study also corroborated findings on price elasticity by income level in Korea.12 The results of the study also indicated that approximately 3%–5% reductions in both relative and absolute inequalities in mortality would be possible with an aggressive tobacco tax policy (100% increase in tobacco price). A prior Korean study reported that a 10%–20% reduction in all-cause mortality inequalities would be expected if absolute gaps between income groups in major risk factors including smoking, high blood pressure, high blood cholesterol, high serum glucose and overweight were halved.17 These results suggest that, from a practical standpoint, an approximately 5%–10% reduction in health inequalities would be possible with health policies focusing on health risk factors; however, more aggressive policies on social determinants of health would be needed to substantially reduce health inequalities.
The tobacco price in Korea, which has been 2500 Korean won in 2005–2014, was raised to 4500 Korean won in 2015 (ie, 80% increase). The tobacco price increases have been criticised in Korea as a policy that makes low-income smokers more economically difficult. There is still a dispute on equity regarding tobacco taxes, since low-income people are more likely to smoke and spend a greater share of their income on tobacco products than high-income people. However, according to the results of this study, it is expected that an increase in tobacco prices would reduce the number of deaths in the whole population and would reduce the number of deaths in the low-income group more than in the high-income group. Therefore, this study has important policy implications for implementing aggressive tobacco price increases, and it could also help to set indicator targets for the reduction of tobacco use and inequalities in tobacco use in the Health Plan 2030 in Korea.
A strength of this study is that, in addition to examining the impact of tobacco price increases on current smoking prevalence, per capita cigarette consumption, and health outcomes, we explored their impact on inequalities in smoking and mortality by income. Several studies have presented price elasticities of smoking prevalence or tobacco consumption by income.20 21 31 32 The impact of tobacco price increases on health inequalities has been also explored.18–20 However, to the best of our knowledge, no studies have simultaneously quantified the impact of tobacco price increases on smoking prevalence (or cigarette consumption) and inequalities in smoking by income, as well as on mortality and inequalities in mortality. Second, this modelling study benefited from rich local data. Data on price elasticity, the RRs for mortality associated with smoking and their heterogeneity by income group for the inequality analyses were driven by the KNHANES and NHIS-NSC.
This study also has several limitations. First, the main text presents results for the entire population assuming that the likelihood of smoking is the same for men and women. Since smoking in men is more common than in women, it may be more practical to combine the sex-specific results and then present the results for the entire population. However, in our analysis, we could not obtain reliable results for women because the estimated price elasticities of smoking prevalence and smoking intensity for women by income level did not show any significant difference due to the insufficient number of female smokers in Korea. This limited our ability to present the results for the entire population after combining the sex-specific results. In addition, because the numbers of death among women according to the duration of smoking cessation were small (see online supplementary table 6), analyses on the impact of tobacco price increases on mortality and mortality inequalities were not possible for women. We only presented results for men in the supplementary files. Second, the KNHANES data used in the analysis of the price elasticities provide top-coded data for sensitive information such as income for the purpose of non-identification of personal information, resulting in a loss of information on income data at high-income levels. Therefore, we performed the analysis after removing approximately 3% of the data from the highest income levels that contained the top-coded data. If real income data, such as data from the National Tax Service (NTS), can be obtained by year (1998–2017), the sample data from the Pareto distribution estimated using NTS data might be used to replace the top income data of the KNHANES. Third, the KNHANES has been conducted annually since 2007, but prior to that, surveys were only conducted in 1998, 2001 and 2005, so continuous time series data could not be obtained. Therefore, a limitation of this study is that it was not possible to include data from all years in which tobacco price increases occurred, even though there have been several tobacco price increases since 1998. Fourth, the income percentiles of the fifth KNHANES (2010–2012) were much higher than the income percentiles of the other periods, even though increases in income over time were considered. That is, the high-income group seems to have been disproportionately sampled in the fifth KNHANES. Thus, we excluded data from the fifth KNHANES from our analysis. Fifth, although the Cox models contain many covariates, missing variables or crudely categorised variables could cause residual confounding, which might overestimate mortality reduction. On the contrary, misclassification of smoking (eg, under-reporting of smoking prevalence among Korean women)33 might have underestimated the association between smoking and mortality. Sixth, a rapid 20% price increase over a day is likely to have a different effect on consumption than a gradual 20% price increase over 10 years, but our model does not capture such differences.
In conclusion, this study provided evidence that tobacco price increases can reduce current smoking prevalence and per capita cigarette consumption in the whole population and especially among the poor, which in turn can reduce the gap in mortality between income groups. More aggressive tobacco price increases through taxation should be implemented to improve the health of the whole population and to reduce health inequalities in Korea.
What this paper adds
There is a paucity of information on the quantified impact of tobacco price increases on current smoking prevalence, per capita cigarette consumption and smoking inequalities by income, mortality and and mortality inequalities by income.
This study provides evidence that increases in tobacco price can reduce the current smoking prevalence and per capita cigarette consumption in the whole population and lower the current smoking prevalence and per capita cigarette consumption more among the poor, which in turn can reduce both mortality in the whole population and mortality inequalities.
Considering the dispute on the equity of tobacco taxes, as low-income groups are more likely to smoke and spend a greater share of their income on tobacco products than high-income groups, the propoor population health impacts of tobacco price increases found in this study provide important implications for implementing a more aggressive tobacco tax policy.
References
Footnotes
Contributors Y-HK conceived and supervised the study. H-KL conducted the data analysis and wrote the first draft of the manuscript. Both authors contributed to drafting and critical revision of the manuscript and have approved the final article.
Funding This article has been adapted and developed from a research report, titled 'A Modelling Study on the Effects of Change in Smoking Inequality according to Tobacco Control', which was supported by the Korea Health Promotion Institute. This research was supported by a grant of the Korea Health Technology R&D Project through the Korea Health Industry Development Institute (KHIDI), funded by the Ministry of Health & Welfare, Republic of Korea (grant number: HI18C0446).
Competing interests None declared.
Patient consent for publication Not required.
Ethics approval This study was approved by the Seoul National University Hospital Institutional Review Board (IRB No. E-1806-144-953).
Provenance and peer review Not commissioned; externally peer reviewed.
Data availability statement Data are available on reasonable request. The Korea National Health and Nutrition Examination Survey data are publicly available. The National Health Insurance Service (NHIS)-National Sample Cohort data might be available to Korean researchers upon request to the Big Data Steering Department of the NHIS.