Article Text

Abstract
Background The 2018 National Academies of Sciences, Engineering, and Medicine Report found substantial evidence that electronic cigarette use (vaping) by youth is strongly associated with an increased risk of ever using cigarettes (smoking) and moderately associated with progressing to more established smoking. However, the Report also noted that recent increases in vaping have been associated with declining rates of youth smoking. This paper examines the temporal relationship between vaping and youth smoking using multiple data sets to explore the question of whether vaping promotes smoking initiation in the USA.
Methods Using publicly available, nationally representative data on smoking and vaping among youth and young adults, we conducted a trend line analysis of deviations from long-term trends in smoking starting from when vaping became more prevalent.
Results There was a substantial increase in youth vaping prevalence beginning in about 2014. Time trend analyses showed that the decline in past 30-day smoking prevalence accelerated by two to four times after 2014. Indicators of more established smoking rates, including the proportion of daily smokers among past 30-day smokers, also decreased more rapidly as vaping became more prevalent.
Conclusions The inverse relationship between vaping and smoking was robust across different data sets for both youth and young adults and for current and more established smoking. While trying electronic cigarettes may causally increase smoking among some youth, the aggregate effect at the population level appears to be negligible given the reduction in smoking initiation during the period of vaping’s ascendance.
- electronic nicotine delivery devices
- surveillance and monitoring
- harm reduction
This is an open access article distributed in accordance with the Creative Commons Attribution Non Commercial (CC BY-NC 4.0) license, which permits others to distribute, remix, adapt, build upon this work non-commercially, and license their derivative works on different terms, provided the original work is properly cited, appropriate credit is given, any changes made indicated, and the use is non-commercial. See: http://creativecommons.org/licenses/by-nc/4.0/.
Statistics from Altmetric.com
Introduction
Considerable attention has been devoted to the public health implications of electronic cigarette use (‘vaping’) and cigarette smoking (‘smoking’).1–3 While a growing literature4–7 indicates that vaping may increase smoking cessation among established smokers, there is concern that any such benefits may be offset by an increase in smoking initiation among youth and young adults.8–10 This concern arises from a potential ‘gateway effect’ in which vaping leads non-smoking youth to take up cigarette smoking.
A growing literature indicates that vaping is associated with future smoking initiation. The 2018 National Academies of Sciences, Engineering, and Medicine (NASEM) Report2 concluded: ‘There is substantial evidence that e-cigarette use increases risk of ever using combustible tobacco cigarettes among youth and young adults’. The analysis is supported by a meta-analysis11 as well as more recent studies with generally consistent findings.12–16 The NASEM Report2 also considered studies examining the relationship of vaping to smoking frequency and intensity,17–20 and concluded that ‘Among youth and young adult e-cigarette users who ever use combustible tobacco cigarettes, there is moderate evidence that e-cigarette use increases the frequency and intensity of subsequent combustible tobacco cigarette smoking’. These conclusions are consistent with the gateway hypothesis, which the NASEM Report calls the catalyst hypothesis.
The NASEM Report2 also refers to an alternative explanation for the observed positive association between vaping and subsequent smoking initiation. The joint susceptibility hypothesis, also known as the common liability hypothesis, suggests that vaping is more likely to occur within a population with a propensity to use cigarettes due to shared common risk factors. The reviewed studies showing an association between vaping and smoking may reflect a failure to adequately control for risk factors common to both vaping and smoking.21
The NASEM Report reaches its conclusions based primarily on the results of short-term cohort studies that examine the association of vaping with future smoking. However, the NASEM Report also examines population trends. A population-level study22 concluded that there was no significant change in the overall linear trend of smoking prevalence among youths after e-cigarettes first became available. However, from their own examination of population trends in vaping and smoking, the Report commented, ‘the population-based data broadly show opposing trends in e-cigarette and cigarette use’, noting that these results ‘are more consistent with the diversion hypothesis than the catalyst hypothesis’. According to the diversion hypothesis, vaping partially replaces and/or substitutes completely for cigarette smoking, thus explaining the decline in smoking as vaping rates in the population increase. The apparent inconsistency between the findings from cohort studies and population trends in smoking and vaping merits a more rigorous examination of the temporal relationship between vaping and youth smoking at the population level.
In examining population-level trends in youth smoking, the NASEM Report was limited by its reliance on a single data source, its failure to incorporate past trends in smoking before vaping became popular, and failure to examine trends in established smoking among young adults where the progression to more established smoking is likely to be more apparent.23 24 This study attempts to overcome all three of these limitations by reconsidering whether vaping rates in the USA are associated with changes in population-level youth and young adult smoking prevalence. We conduct time series analyses to examine trends in vaping and smoking patterns across national surveys that reported on current and established cigarette use among US youth and young adults.
Methods
To examine trends in population vaping and smoking, we first determined trends in vaping, and then examined the association between these trends and those for cigarette smoking.
Trends in vaping
To estimate youth and young adult vaping prevalence, we conducted a search of the literature through December 2017 using PubMed to find nationally representative surveys on youth and young adult vaping, particularly studies of trends. The search strategy consisted of the following keywords: (‘e-cigarette’ OR ‘electronic cigarette’ OR ‘vaporized nicotine’ OR ‘vaping’) AND (‘youth’ OR ‘young adult’ OR ‘adolescent’ OR ‘student’) AND (‘prevalence’ OR ‘use’). We also considered US surveys that collected information on tobacco use for either youth or young adults. We restrict the analyses to results from nationally representative surveys for youth and young adults aged 15 through 25, where smoking initiation and the progression to more established smoking generally occur.23 24
The relationship of vaping to trends in smoking
US data on youth and young adult cigarette use were obtained from five different publicly available surveys: (1) the Monitoring the Future (MTF) survey; (2) the National Youth Tobacco Survey (NYTS); (3) the Youth Risk Behavior Survey (YRBS); (4) the National Survey of Drug Use and Health (NSDUH); and (5) the National Health Interview Survey (NHIS) for young adults. When information was available, we examined both past 30-day smoking prevalence and more established smoking. For established smoking, we considered daily and half-pack-a-day smoking prevalence using the MTF and NSDUH surveys, and the prevalence of current smokers who had smoked more than 100 cigarettes lifetime using the NHIS. The survey questions are provided as online supplementary 1.
Supplementary file 1
Using the five surveys, our goal was to apply a uniform, straightforward analysis of the relationship between vaping and smoking trends. Our analysis of this relationship involved the estimation of long-term cigarette smoking trends and testing whether those trends changed once vaping became more prominent. Specifically, we estimated the following equation for each of our measures of smoking prevalence:
Log (Smoking Prevalencet)=α + β1 Long-term Trendt + β2 VapingTrendt, t=1,…,T
where Long-term Trend is a time trend taking the values 1,…,T, with the value of t corresponding to each sample year beginning with the first year and continuing to the last sample year. VapingTrend takes the value 0 until the first year that vaping becomes prominent, followed by a time trend from that year forward (eg, for vaping beginning in 2014, VapingTrend=1 in 2014, 2 in 2015, 3 in 2016, and 0 before 2014). With the dependent variable measured in log form and the VapingTrend overlapping with the Long-term Trend, the coefficient β1 corresponds to the average annual long-term relative reduction in smoking each year and β2 corresponds to the annual relative change from that long-term trend once vaping becomes prominent (ie, β1 + β2 corresponds to the trend after vaping become prominent). Because the NYTS was limited to six observations and was available on a biennial basis, the vaping period was modelled as a step function (ie, a simple indicator variable) rather than as a trend deviation.
We employed the log form of the dependent variable based on goodness of fit and the a priori expectation that the size of change is likely to depend on the initial level, but we also conducted sensitivity analysis employing the linear form. Based on a graphic examination of the stability of trends prior to vaping over the period 2004 through 2012 (see online supplementary 2), we included data starting in 2004 (or the earliest year available after 2004), but the choice of start year did not substantively affect the results. The choice of the initial tipping point year of vaping was based on our analysis of the vaping data, but we also considered the overall explanatory power of the equations as measured by the adjusted R-squared, and whether the equation was subject to first-order autocorrelation of the error terms, as indicated by the Durbin-Watson statistics.25 We conducted sensitivity analysis on other start points for increased vaping. Finally, where the Durbin-Watson statistics indicated a potential for autocorrelation, we transformed the data using the Cochrane-Orcutt method25 and considered the sensitivity of results to that correction.
Supplementary file 2
Results
Trends in vaping
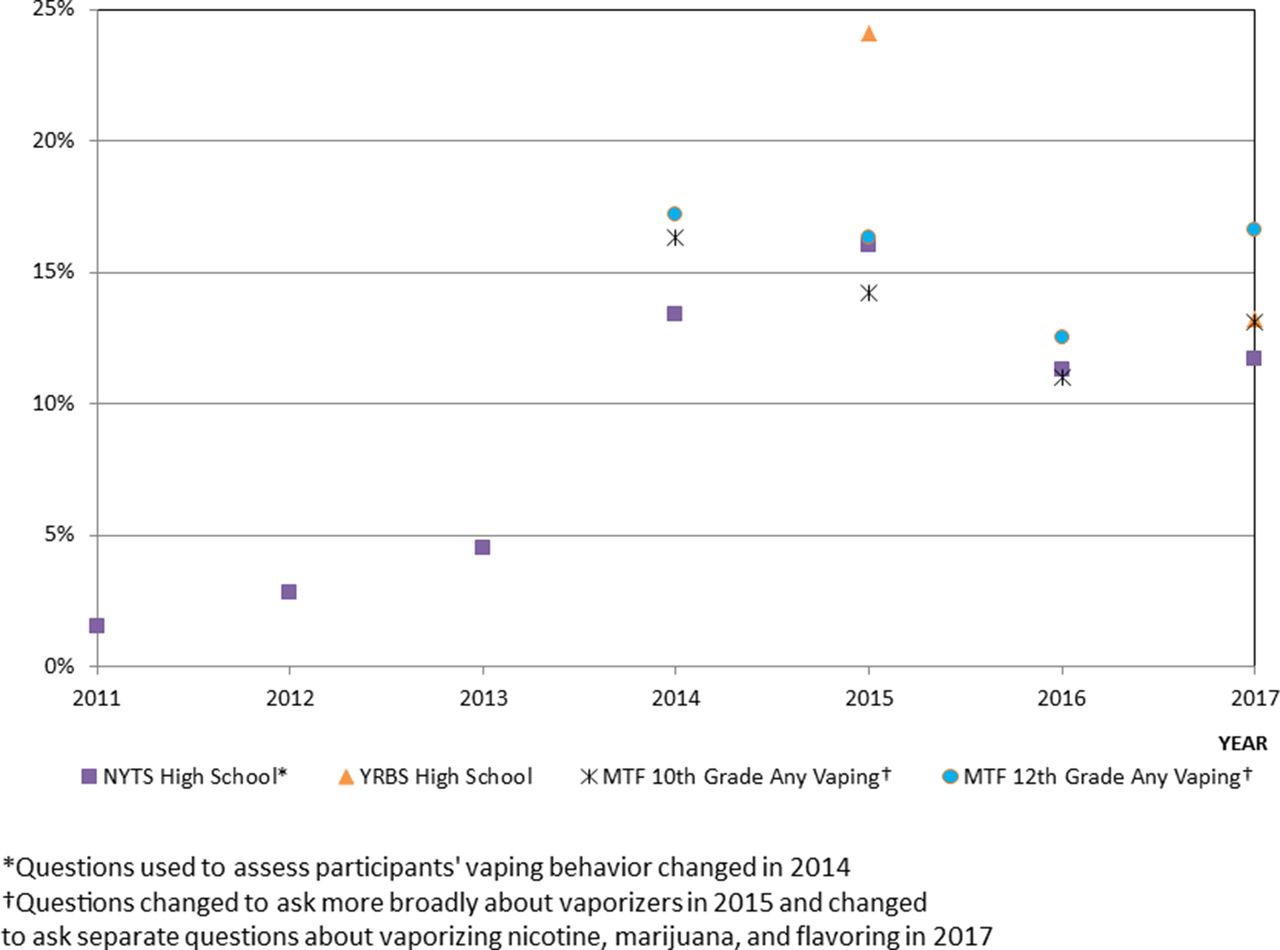
The NYTS was the first youth survey to include questions on vaping, starting in 2011. Past 30-day vaping among high school students increased from 1.5% in 2011 to 4.5% in 2013 and to 13.4% in 2014.26 Vaping increased slightly to 16.0% in 2015, declined to 11.3% in 2016, and then rose slightly to 11.7% in 2017. However, reported use between 2013 and 2014 may have increased in the 2014 NYTS at least partially due to a change in the questions used to assess participants’ vaping behaviour.27
The MTF survey began asking about vaping in 2014,28 when past 30-day use was reported at 16.3% for 10th graders (usually ages 15–16)29 and 17.2% for 12th graders (usually ages 17–18). With questions changed in 2015 to ask more broadly about vapourisers,30 rates fell between 2015 and 2016 from 14.2% to 11.0% for 10th graders and from 16.3% to 12.5% for 12th graders.31 With separate questions asked about vapourising nicotine and marijuana in 2017,32 any vaping was 13.1% (10th grade) and 16.6% (12th grade). MTF estimates are roughly consistent with recent NYTS youth estimates, but YRBS estimated high schoolers’ 2015 last 30-day vaping prevalence at a higher rate of 24.1%, although that prevalence fell to 13.2% in 2017.33
A longitudinal follow-up of the young adults in the MTF34 survey had 2016 past 30-day vaping at 7.5% for those aged 19–21 years old and 7% for those aged 22–24 years old. The 2013–2014 National Adult Tobacco Survey reported everyday or someday vaping prevalence among those aged 18–24 years old at 5.5% in 2013–2014,35 compared with 2.2% in 2012–2013.36 Data from the 2013–2014 Population Assessment of Tobacco and Health (PATH) Survey indicated that 12.5% of those aged 18–24 years old vaped in the past 30 days, with 1.3% being daily users.37 NHIS38 39 data had 5.1% of adults aged 18–24 vaping every day or some days in 2014, declining slightly to 4.7% in 2016.
Thus, while information on youth and young adult vaping before 2014 is limited and diverges for the different surveys, the data for youth, as shown in figure 1, indicate that vaping occurred at relatively low levels from 2011 to 2013, but reached much higher levels by 2014. We therefore identified 2014 as the tipping point year when vaping became popular among youth and young adults. However, we considered earlier years as the tipping point in our analyses of trends in cigarette use.

Youth vaping prevalence various surveys, 2011–2017. MTF, Monitoring the Future survey; NYTS, National Youth Tobacco Survey; YRBS, Youth Risk Behavior Survey.
Trends in cigarette use
Table 1 presents the results for trend analysis as distinguished by (1) any past 30-day smoking; (2) established smoking; and (3) proportion of daily smoking among past 30-day smokers. Figure 2A–D shows trends in smoking for 10th graders, 12th graders, ages 18–21 and ages 22–24 using the MTF survey. Trends for other measures and other surveys can be found in online supplementary 2.
Trend line analysis of smoking rates with deviations from long-term trend with vaping, various surveys

Monitoring the Future survey, prevaping (2004–2013) and postvaping (2014–2017), and last 30 days cigarette prevalence with linear trend for prevaping period. (A) 10th graders, (B) 12th graders, (C) ages 18–21 and (D) ages 22–24.
Past 30-day use
Using MTF data for 12th graders, figure 2B distinguishes cigarette use once vaping became prominent relative to a trend line estimated over the period of 2002–2013. Actual smoking prevalence from MTF is below the predicted smoking rates for 2014 (13.6% vs 15.5%), with the discrepancy increasing in 2017 (9.7% vs 12.9%). Thus, actual rates are below the prevaping trend predicted rates by 12% in 2014 increasing to 25% in 2017. Trend analysis (table 1) indicates a long-term annual relative reduction in smoking prevalence of 4.6% with an additional 9.5% annual reduction during the later vaping period, yielding a total annual relative reduction of 14.1% during the vaping period. Thus, the downward trend was more than three times greater in the vaping period (14.1%) than the long-term trend (4.6%). MTF showed consistent results for 10th-grader past 30-day smoking, with large reductions seen in figure 2B, and more than three times the relative reduction in the vaping period (19.8%=5.8%+14.0%) than the preceding period (5.8%) using the trend analysis (table 1).
With the vaping period modelled as a simple reduction in smoking for the YRBS and NYTS analyses, we obtained a 52% lower past 30-day smoking rate in the vaping period for YRBS and a 22% reduction for NYTS.
We aggregated combined male and female MTF estimates by single age into age groups 18–21 and 22–24, and estimated the trend line over the period 2000–2016. Graphical analysis (figure 2C,D) did not show clear variations in trend beginning in 2014, but trend analysis showed approximately three times the relative reduction in past 30-day smoking for ages 18–21 and twice the reduction for ages 22–24 in the vaping period compared with the long-term trend. Estimates from the NSDUH indicated about four times the annual relative reduction in the vaping period compared with prior trend.
For both the 10th-grader and 12th-grader and ages 22–24 equations, the Durbin-Watson statistics was in the indeterminate region, indicating potentially autocorrelated error terms. When we corrected for autocorrelation, we obtained substantively similar results in terms of the relative reductions (see online supplementary 3, table 1). We also examined linear rather than log forms of the dependent variable and obtained consistent, although slightly weaker results (online supplementary 3, table 2). In addition, we considered different starting points for the vaping period (see online supplementary 3, table 3). We obtained improved results using the 2013 instead of the 2014 start date in terms of the adjusted Durbin-Watson statistics for the 10th-grade and improved adjusted R-squared for the 12th-grade MTF equations, but in other cases obtained weaker results in terms of the adjusted R-squared using the 2013 and 2012 start dates.
Supplementary file 3
Established cigarette use
Trend line analysis of MTF 10th-grader and 12th-grader daily cigarette use showed about three times the annual relative reduction for both in the vaping period compared with the long-term trend. Trend analysis of MTF data also indicated more than three times the relative reductions for ages 18–21 and nearly twice the relative reductions for ages 22–24 during the vaping period. Using NSDUH, trend analysis again indicated about three times the annual relative reduction in daily smoking with vaping compared with previous trends.
Among other measures of established use, MTF data on having smoked half-pack a day among last 30-day smokers yielded results consistent with those for daily smoking for the 10th and the 12th graders and for ages 18–25. Trend analysis of the NHIS data indicated a 10.0% higher relative reduction in the male smoking rate with vaping, translating to four times the relative reduction prior to vaping. A weaker indication (p=0.06) of reduced smoking was found for women, but was subject to potential autocorrelation.
On correcting for autocorrelation, the vaping term in the female NHIS equation was significant at the 0.02 level, and the associated annual relative reduction increased from 6% to 8% and the adjusted R-squared improved in the MTF 12th-grade equation, but otherwise similar results were obtained (online supplementary 3, table 1). We also obtained similar, although generally weaker results when using the linear instead of log models. The equation for MTF 12th graders showed less autocorrelation using a 2013 vape start date, but the 2014 equations otherwise performed marginally better than the 2013 equations in terms of the adjusted R-squared.
Smoking intensity
To more specifically consider trends towards more established smoking, we also examined the number of daily smokers as a proportion of the number of past 30-day smokers.40 41 Trend line analysis yielded twice the annual relative reduction in the proportion of daily use during the vaping period for 12th graders than prior trends, but no change for 10th graders using MTF. Trend analysis of MTF data also indicated an increased annual relative reduction of 6.0% in the vaping period for ages 18–21 in addition to the prior trend of a 1.3% reduction. While the vaping trend coefficient was negative and significant or nearly significant in all cases for current and established smoking, negative but insignificant reductions were found in the analyses of smoking intensity for young adults aged 22–24 years old in the MTF survey and for those aged 18–25 years old in NSDUH.
On correcting for autocorrelation, the vaping trend became significant (p=0.05), showing twice the downward trend for 10th graders. Similar, although generally weaker, results were obtained using the linear rather than log form of smoking prevalence. As shown in online supplementary 3, table 3c, the MTF equations with the 2013 instead of 2014 vaping start date performed better in terms of the adjusted R-squared for 10th graders and those ages 18–21.
Discussion
A long-term decline in smoking prevalence among US youth accelerated after 2013 when vaping became more widespread. These findings were also observed for US young adults, especially those ages 18–21. We also found that the decline in more established smoking, as measured by daily smoking, smoking half pack a day or having smoked at least 100 cigarettes and currently smoking some days or every day, markedly accelerated when vaping increased. Like previous analyses,40 41 the proportion of daily to past 30-day smoking decreased slowly through 2012, but the extent of the decline in this measure of smoking intensity increased once vaping became popular. The results were consistent across different surveys, suggesting that the results are robust across different methods of data collection. The results remained consistent after correcting for potentially autocorrelated error terms and using linear instead of log forms of the dependent variable.
We chose the year 2014 as the first year when vaping became a more popular behaviour among youth and young adults in the USA. The selection of 2014 as a tipping point is supported by retail sales data, where growth was relatively slow through 2013, but more than doubled in 2014.3 42 In addition, the percentage of adults who switched from cigarettes to e-cigarettes doubled between 2012–2013 and 2013–2014.43 Our examination of the 2013 tipping points generally yielded smaller, although consistent results but did not otherwise affect the analysis. Nevertheless, our review indicates considerable variation in vaping prevalence estimates across the various surveys. In addition, the question wording in the surveys appears to make a difference in estimated vaping rates.27 44 These differences will need to be considered in developing useful measures to assess the public health implications of vaping.
To date, only one other study has examined the temporal relationship between vaping and smoking among US youth. Dutra and Glantz22 found no change in the linear downward trend between 2004 and 2014. They used 2009 as the tipping point for vaping when youth vaping was minimal and only considered through 2014, before most change occurred. The divergent findings between individual-level cohort studies, which show a possible causal relationship between vaping and smoking, and those of population trends showing a negative association between vaping and smoking are not necessarily inconsistent. Rather, it is possible that trying e-cigarettes is causally related to smoking for some youth, but the aggregate effect of this relationship at the population level may be small enough that its effects are swamped by other factors that influence smoking behaviour. A recent simulation analysis45 concluded that, even if estimates from the cohort literature are accepted as causal, they would account for only a 2% increase in smoking initiation rates. Potentially, other forces reducing smoking among young people are much larger than the postulated effect of vaping on otherwise never-smoking youth. Some of the reduction in youth smoking may be due to vaping substituting for smoking among a subset of youth or being used by smokers to quit both vaping and smoking.
While the accelerated rate of decline in smoking observed after 2013 coincides with the increase in vaping, it could also reflect the influence of tobacco control interventions. For example, the FDA implemented the Real Cost media campaign directed at youth from 2014 through 2016. A recent study46 found that this campaign reduced the risk for smoking initiation. However, the projected number of youth ages 11–18 prevented from initiating smoking was about 350 000, or about 1% of those ages 11–18, suggesting that only a small portion of the reduction in youth smoking prevalence could be explained by this policy. In addition, previous research indicates much smaller effects on smoking prevalence for media campaigns than observed during the vaping period.47 While our analysis did not specifically control for the effect of other policies, we have considered effects from tobacco policies and interventions as predicted by the SimSmoke tobacco control policy simulation model.48 Incorporating the minimal changes in cigarette prices and smoke-free air laws that occurred between 2012 and 2017, as well as state-level and national-level media campaign spending (including the Tips from Former Smokers (TIPS), Truth #FinishIT and Real Cost campaigns), SimSmoke predicted a slow, relatively stable downward trend for those aged 15–17 and 18–24 since 2010. These results suggest that policies and media campaigns would not have been responsible for much of an accelerated decline in youth and adult smoking in recent years. In addition, trends projected by Holford et al 49 using data from the 1965–2012 NHIS showed no major changes from 2010 onward. These analyses suggest that tobacco control policies are at most responsible for a small part of the accelerated reductions in youth and adult smoking.
Our purpose was to present a straightforward approach to examining recent trends in order to encourage research using more sophisticated techniques that adequately capture population trends. While our results indicate that rapid reductions in youth and young adult smoking have been associated with the uptake of e-cigarette use, further analysis is needed to distinguish the temporal effects of e-cigarette use and the specific role of tobacco control policies. In conducting that research, it will be important to allow for the possibility that the effects of cigarette-oriented policies in recent years may be impacted by the availability of e-cigarettes. In particular, stricter cigarette-oriented policies may have greater effects on smoking prevalence if consumers switch completely to e-cigarettes, but could instead have reduced effects if smokers turn to dual use with e-cigarettes rather than quitting smoking. Further analysis is also warranted to examine differences in smoking and vaping trends by region, where patterns of vaping may differ, and by sociodemographic status, given evidence of increasing concentration of smoking in disadvantaged groups.50 In conducting further analyses, more sophisticated techniques, such as generalised linear models and generalised additive models,51 52 could be applied to longer time series while incorporating individual-level characteristics and environmental factors.
The analyses were all conducted using US data, and the relationships may not hold for other countries with different cultures and regulatory regimes. It would be instructive to consider other countries, such as Canada53 and the UK,54 which have also experienced rapid declines in smoking prevalence in recent years, especially among young adults.
In summary, while caution is warranted in interpreting our findings, they paint a consistent picture of accelerated reductions in youth and young adult smoking prevalence as vaping became more widespread. Even if there is some validity to the catalyst hypothesis, its impact is dwarfed by other factors. In our view, it is premature to conclude that the observed increased rate of decline in smoking is due to vaping diverting youth from smoking, although it is a plausible explanation. Working out the contribution, if any, that diversion might be playing, along with attempting to understand the roles of the major public education campaigns and perhaps other activities, is critical for making the appropriate policy choices to facilitate the highly encouraging recent trends in youth and young adult cigarette use. If our primary concern is population-level trends in youth and young adult smoking, which we believe is appropriate, then vaping has not shown to be a serious cause for concern, even if the catalyst hypothesis is correct, and it is possible that vaping may be playing a contributing role to the recent steep declines in youth and young adult smoking.
What this paper adds
The 2014 National Academies of Sciences, Engineering, and Medicine Report found substantial evidence that electronic cigarette use by youth increases the risk of ever cigarette use and may also increase the likelihood of progressing to established smoking.
However, the Report also noted that recent increases in vaping have been associated with declining rates of youth smoking in the USA.
After controlling for previous trends, this study finds that the downward trend in both current use and more established cigarette use substantially accelerated among US youth and young adults once vaping became popular.
These findings are consistent over three different surveys each for youth and young adults.
References
Supplementary materials
Supplementary Data
This web only file has been produced by the BMJ Publishing Group from an electronic file supplied by the author(s) and has not been edited for content.
Footnotes
Contributors DTL wrote the original manuscript, conducted the empirical analysis and revised the manuscript. CK helped write the original manuscript, conduct empirical analyses and edit the paper. The other authors all took an active role in developing the original ideas for the study, critiquing the analysis, extensive editing of the manuscript and revising the manuscript.
Funding RB, KMC, GTF, MLG, DH, DTL and JFT received funding from the National Cancer Institute under grant P01CA200512.
Competing interests MLG was a member of the National Academies of Sciences, Engineering, and Medicine (NASEM) Committee on the Review of the Health Effects of Electronic Nicotine Delivery Systems who wrote the report. The report was funded by the Food and Drug Administration (FDA), but the FDA was not involved in the drafting or review of the NASEM Report or this manuscript. The policy implications written in this manuscript are the views of the authors and do not necessarily represent the views of the other members of the Committee, the NASEM or the FDA. MLG also received a research grant and served as an advisory board member to pharmaceutical companies that manufacture smoking cessation medications. KMC and DH have served as an expert witness in litigation against the cigarette industry.
Patient consent Not required.
Provenance and peer review Not commissioned; externally peer reviewed.
Data sharing statement The data are all published. The authors will make these data available to all who request it.