Article Text

Abstract
Background The English National Health Service NHS Stop Smoking Services (SSS), established in 2001, were the first such services in the world. An appropriate evaluation of the SSS has national and international significance. This modelling study sought to evaluate the impact of the SSS on changes in smoking prevalence in England.
Methods A discrete time state-transition model was developed to simulate changes in smoking status among the adult population in England during 2001–2016. Input parameters were based on data from national statistics, population representative surveys and published literature. The main outcome was the percentage point reduction in smoking prevalence attributable to the SSS.
Results Smoking prevalence was reduced by 10.8 % in absolute terms during 2001–2016 in England, and 15.3 % of the reduction could be attributable to the SSS. The percentage point reduction in smoking prevalence each year was on average 0.72%, and 0.11 % could be attributable to the SSS. The proportion of SSS supported quit attempts increased from 5.5 % in 2001, to as high as 18.9 % in 2011, and then reduced to 8.2 % in 2016. Quit attempts with SSS support had a higher success rate than those without SSS support (15.1% vs 11.3%). Smoking prevalence in England continued to decline after the SSS was much reduced from 2013 onwards.
Conclusions Approximately 15% of the percentage point reduction in smoking prevalence during 2001–2016 in England may be attributable to the NHS SSS, although uncertainty remains regarding the actual impact of the formal smoking cessation services.
- cessation
- health services
- addiction
This is an open access article distributed in accordance with the Creative Commons Attribution Non Commercial (CC BY-NC 4.0) license, which permits others to distribute, remix, adapt, build upon this work non-commercially, and license their derivative works on different terms, provided the original work is properly cited, appropriate credit is given, any changes made indicated, and the use is non-commercial. See: http://creativecommons.org/licenses/by-nc/4.0/.
Statistics from Altmetric.com
Introduction
Cigarette smoking remains a leading cause of avoidable deaths worldwide.1 According to the WHO Framework Convention on Tobacco Control, comprehensive tobacco control measures include cigarette taxes, smoke-free laws, public information campaigns, advertising bans, health warning and cessation treatment.2 Observational evidence indicates that the implementation of key tobacco control measures is associated with increased cessation rates and reduced smoking prevalence at the population level.3 4 However, the relative impact of each of the key tobacco control measures on a population’s smoking prevalence remains unclear,5 although different interventions, simultaneously implemented, may interact in complex ways and have synergistic effect.
The UK is considered to be in a leading position in Europe regarding the implementation of tobacco control measures.6 Smoking prevalence among adults in the UK has declined from 27% in 2000 to 16% in 2016.7 As part of a comprehensive tobacco control strategy, National Health Service (NHS) Stop Smoking Services (SSS) were launched in Health Action Zones in 1999 in England, and were rolled out to all English Health Authorities in 2001.8 Smokers who are motivated to quit are referred by other health professionals or themselves to the SSS. The recommended total contact time for each client at SSS is 1.5 hours from pre-quit preparation to 4 weeks after quitting.9 Evidence-based behavioural and pharmacological interventions are provided by smoking cessation specialists, or delivered by staff in primary care, pharmacy or dental practice who have received smoking cessation training.
Previous studies have evaluated the effects of the SSS on short-term quitting8 and long-term success rates.10 11 Other than a study using data from the SSS in one region in 2004,12 the impact of the SSS on smoking prevalence in England has not been comprehensively quantified. As the first such services in the world, an appropriate evaluation of the SSS will provide empirical evidence for the development of tobacco control strategies in the UK and other countries. Based on official statistical data and published literature, we developed a computational simulation model to quantify the impact of the SSS on smoking prevalence between 2001 and 2016 in England.
Methods
Model framework
A discrete time state-transition model13 was developed to simulate smoking prevalence among the adult population (≥16 years old) in England between 2001 and 2016. The population was separated into subgroups by age, sex and smoking status. Smoking status was classified as never smokers, current smokers and former smokers. As the cycle length of time was 1 year in simulation modelling, current smokers in this study included those who quit smoking less than 12 months ago. Former smokers were defined as those who stopped smoking for at least 12 months and were further classified according to time since cessation. The simulation was started using the adult population structure of 2001. Population subgroups by age and gender were updated annually according to the probability of death and smoking status transition.
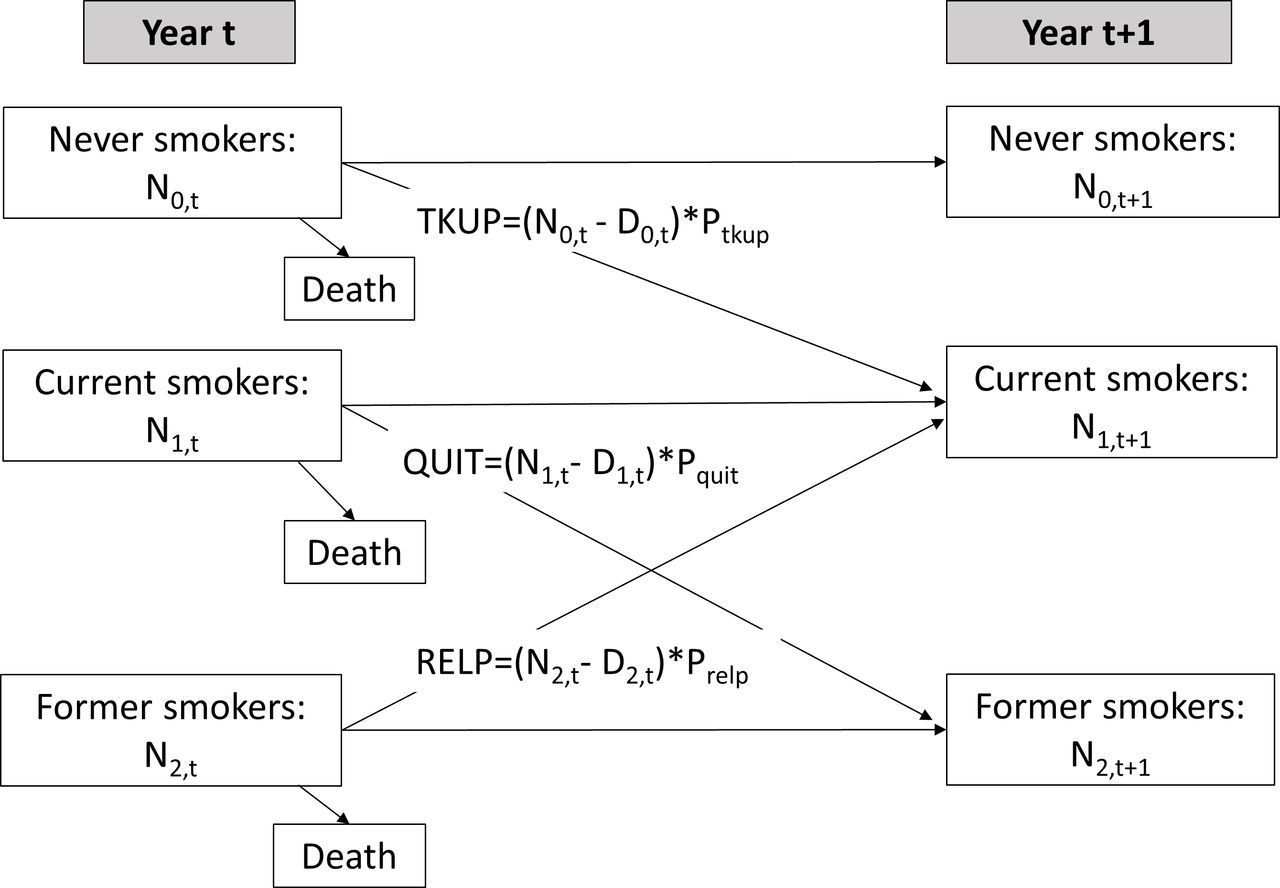
Detailed methods for the simulation modelling are provided in online supplementary appendix 1. The transition between smoking status over time was based on (1) the probability of current smokers who quit smoking, (2) the probability of former smokers who start to smoke regularly again and (3) the probability of never smokers who start to smoke regularly. Figure 1 shows the possible transitions across never, current and former smokers between year (ie, at the beginning of the year) and year t+1. Never smokers in year t may remain as never smokers or may start smoking. The number of never smokers in year t+1 equals the number of never smokers in year t minus deaths and new take-ups. Similarly, current smokers in year t may remain as current smokers or may have stopped smoking by the beginning of year t+1. The number of current smokers in year t+1 equals the number of current smokers in year t minus deaths and quitters, plus new take-ups in year t. Finally, the number of former smokers at the beginning of year t+1 is calculated by subtracting deaths and relapsers from, and adding new quitters to, the number of former smokers in year t. Exogenous inputs to the model included the number of people aged 16 and net immigrants, along with their smoking status.
Supplemental material

Diagram of possible transitions across smoking status. D0,t, D1,t and D2,t, the number of deaths among never, current and former smokers in year T; N0,t, N1,t and N2,t, the number of never, current and former smokers in year t, respectively; Ptkup, the probability of taking up smoking in never smokers; Pquit, the probability of quitting for current smokers; Prelp, the probability of returning to smoking among former smokers; QUIT, the number of quitters; RELP, the number of former smokers who start to smoke again; TKUP, the number of new take-ups.
Data sources and parameter estimation
The 2001 mid-year population and death rates by age and sex in England were obtained from the Office for National Statistics.14 To estimate the size of the population at the start of the year 2001, we subtracted half of the difference between population estimates for 2000 and 2001 from the mid-year population in 2001. The prevalence rates for never, current and former smokers were based on data from General Lifestyle Surveys in the UK.7 15 Smoking prevalence was gender-specific and age-specific. Some of the fluctuation in the reported smoking prevalence rates during 2001–2016 was probably as a result of sampling errors. To facilitate simulation modelling, the observed age-specific and sex-specific smoking prevalence rates over time were smoothed by simple linear regression (online supplementary file 1).
Relative risks for death by smoking status were based on data summarised by Vugrin et al.16 New smoking take-ups included 16-year-old smokers, which were exogenously added to the simulated population. Then, we estimated the additional number of new take-ups among people aged 16–22 years in line with the observed increase in current and former smokers between two adjacent years (for details, see online supplementary file 1). The model allowed for relapse, with rates declining with the number of years quit, and it was assumed that relapse rates among those who quit for ≥12 months were not affected by the SSS. The risk of smoking relapse for former smokers was estimated according to the relapse curve developed by Stapleton and West.17 The rate of quit attempts among current smokers was estimated using data from a series of Opinion Surveys in England18 and the Smoking Toolkit Study in England.19 The number of quit attempts supported by SSS and short-term quitters at 4 weeks after the quit date were based on SSS Statistics.20 The risk of smoking relapse by 12 months among short-term quitters was estimated according to data from three long-term follow-up studies,10 11 21 and data from the Smoking Toolkit Study.22 To be consistent with the self-reported smoking and cessation status in national surveys in England,18 we used self-reported quit rates in the present study.
Outcomes and data analyses
The model’s outcomes include the number of current smokers who attempted to quit smoking and the number of smokers who successfully quit each year from 2001 to 2016 in England. The quit attempts and successful quitters were further separated according to whether support from the SSS was received or not. Due to the limited availability of relevant data, the main outcomes were estimated by a novel modelling approach: the number of quitters in year t was calculated based on the change in smoking prevalence between year t and t+1, given estimated smoking relapse, new take-ups and death (see online supplementary appendix 1: figure 2). We first calculated the number of current smokers at the beginning of a year by assuming there were no smokers who stopped smoking in the past 12 months, given other inflow to and outflow from the pool of current smokers. Then we calculated the number of current smokers based on the observed smoking prevalence. The difference in the number of current smokers between the two calculations was used to estimate the number of all quitters required in the past year to achieve the observed smoking prevalence in the current year. The number of quitters without SSS support was estimated by subtracting the estimated number of quitters with SSS support from the estimated number of all quitters (online supplementary appendix 1). In addition to the rates of current smokers, we also calibrated the relevant inflow and outflow parameters by comparing the estimated and observed proportions of never and former smokers in England.
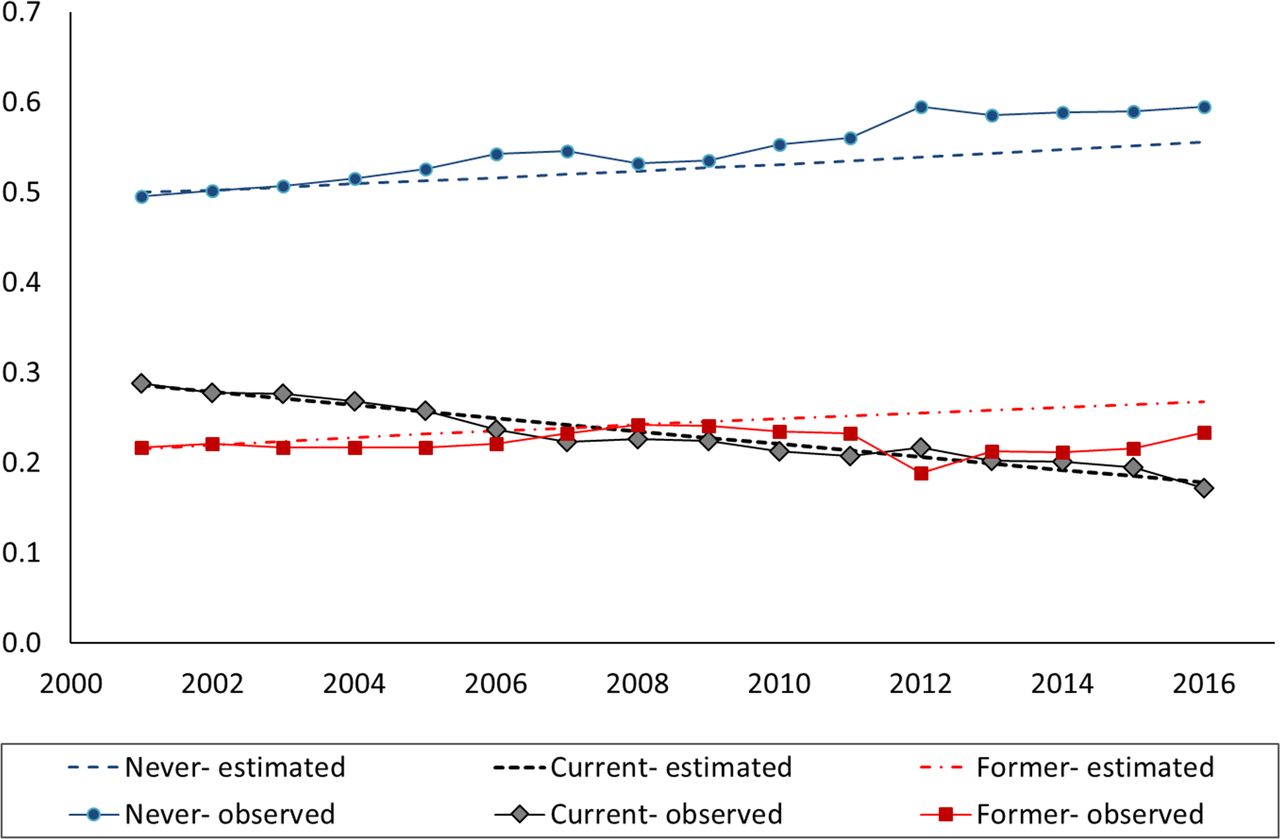
Prevalence rates of never, current and former smokers in England: the observed and estimated.
Reduction in smoking prevalence over time is presented using percentage point change which is the arithmetic difference of two smoking prevalence rates in different years. We estimate the percentage point reduction in smoking prevalence attributable to the SSS, based on the total percentage point reduction and the proportion of quitters who received support from the SSS. Due to important changes in the SSS since 2013, including declining client numbers,23 public health budget cuts23 24 and increased use of e-cigarettes,25 26 results of the evaluation were also considered separately for the period 2001–2012 and 20 013–2016.
The computing language R was used to perform the simulation modelling.
Results
Smoking status between 2001 and 2016
Figure 2 shows the observed and estimated overall prevalence of current, former and never smokers in the population aged ≥16 in England during 2001–2016. As the number of quitters was estimated based on changes in smoking prevalence over time, the estimated prevalence rates for current smokers agree closely with the reported prevalence rates.7 15 The overall rate of smoking prevalence (including those who quit smoking for <12 months) was estimated to be 28.6% in 2001, 20.6% in 2012 and 17.8% in 2016. Compared with the observed rates in 2016, the estimated prevalence of never smokers in 2016 was lower (55.5% vs 59.5%) and the estimated rates of former smokers was higher (26.7% vs 23.3%). The differences between the estimated and observed rates of never and former smokers were likely to be a result of reclassification of former smokers7 27 which is considered in the discussion section.
The estimated number of current smokers (including those who quit smoking for <12 months) was reduced by 29.4% during 2001–2016, from 11.30 million in 2001 to 7.98 million in 2016. The absolute number of current smokers in England was on average reduced by approximately 211 900 each year during 2001–2012, and by 239 100 each year during 2013–2016 (online supplementary appendix 2).
The estimated number of new take-ups to smoking each year was reduced by 37.8% during 2001–2016, from 257 300 in 2001 to 160 100 in 2016 (online supplementary appendix 2). However, the number of relapsed smokers increased by 27.1%, from 132 800 in 2001 to 168 800 in 2016, corresponding to an increase in the number of former smokers (from 8.5 million in 2001 to 12.0 million in 2016). Net immigration added around 50 000 current smokers per year. The estimated number of the outflow from the population of current smokers was on average 642 300 each year. The proportion of people contributing to the total outflow due to smoking cessation increased from 80.3% in 2001 to 86.1% in 2016.
Quit attempts and success between 2001 and 2016
The estimated numbers of quit attempts in England during 2001–2016 are shown in figure 3 (and online supplementary appendix 3–4). On average, there were approximately 4.58 million quit attempts annually in England during 2001–2016. The number of quit attempts by current smokers peaked at 6.03 million (60.0% of all current smokers) in 2007. On average, around 545 000 smokers set a quit date at SSS per year during 2001–2016, and this accounted for 11.9% of all quit attempts. The number of quit attempts at SSS peaked at around 816 400 in 2011, in contrast to a decline in the total number of quit attempts in England during 2007–2011 (figure 3). The proportion of SSS supported quit attempts increased from 5.5% in 2001, to as high as 18.9% in 2011, and then reduced to 8.2% in 2016.

Estimated number of quit attempts in England between 2001 and 2016. The estimated number included multiple quit attempts by individual smokers within a year. Other attempts, quit attempts without support from Stop Smoking Services; SSS, quit attempts with support from Stop Smoking Services.
The estimated number of long-term quitters in England was on average 538 400 each year during 2001–2016, and 15.3% of the long-term quitters received support from the SSS (online supplementary appendix 3). Quit attempts with SSS support had a higher success rate, compared with other quit attempts (15.1% vs 11.3%).
The estimated proportion of SSS supported quitters (15.3%) was linked with the assumed probability of smoking relapse and take-ups. Therefore, we conducted some post-hoc sensitivity analyses by increasing or lowering the probability of relapse and take-ups. If the risk of relapse and take-ups was both increased by 20% (consequently a larger number of quitters would be required to achieve the observed reduction in smoking prevalence), the estimated proportion of SSS supported quitters would be reduced to 12.3%. If the risk of relapse and take-ups was both reduced by 20%, the proportion of SSS supported quitters was increased to 17.5% during 2001–2016.
The prevalence rate for current smokers in England was reduced by 10.8% in absolute terms, from 28.6% in 2001 to 17.8% in 2016. We estimate, therefore, that 1.65% (ie, 10.8×0.153) of the reduction in smoking prevalence during 2001–2016 was attributable to the SSS (table 1). The average percentage point reduction in smoking prevalence was 0.72% (ie, 10.8%/15) each year from 2001 to 2016, and 0.11% percentage point reduction each year could be attributable to support from the SSS.
Estimated impact of the Stop Smoking Services (SSS) on the reduction in smoking prevalence in England: 2001–2016
Discussion
As the first such services established anywhere in the world, an appropriate evaluation of the SSS provides important information for the development of public health policies regarding tobacco control in the UK and other countries. In the present study, we developed a computational model based on data from a variety of sources to evaluate the impact of the SSS on reductions in smoking prevalence in England. Our estimated percentage point reduction in smoking prevalence attributable to SSS support was 0.11% each year during 2001–2016, which was near the lower boundary of a previous estimate (0.1%–0.3%) using SSS data from one region in England during 2003–2004.12 Another study estimated that a third of smoking prevalence reduction (0.24% out of 0.79%) in 2014 in England could be attributable to cessation aids.28 In addition, our estimated annual percentage point reduction (0.11%) attributable to the SSS was somewhat smaller than the annual percentage point reduction of 0.157% estimated by Gravely et al3 for implementing cessation support at the highest level in a population. However, the two estimates seemed broadly consistent in scale, considering that our estimated percentage point reduction was attributable to the SSS only, and cessation treatments are also available outside the SSS.
The main difference in cessation support between SSS and non-SSS quit attempts was the provision of varenicline (only available on prescription) and behavioural counselling.8 According to the results of the present study, the overall rates of success during 2001–2016 were higher for quit attempts with SSS support, compared with those without such support (15.1% vs 11.3%). This result is consistent with findings from previous studies. One study estimated that biochemically verified abstinence at 4 weeks was about 35% with SSS support, and 25% for those with only a prescription of smoking cessation medication.8 Within the SSS, cessation support may be provided by dedicated cessation specialists, or by trained general practitioners, nurses, pharmacists or dentists.29 Evidence shows that the rate of relapse at 12 months is lower among short-term quitters who received specialist support compared with those receiving non-specialist support.30
The impact of cessation support will depend on how many current smokers initiate a quit attempt. The proportion of quit attempts among current smokers was highest in 2006/2007 which may be explained by the ban on smoking in enclosed public places and workplaces after the introduction of smoke-free legislation in July 2007 in England.31 The proportion of quit attempts with SSS support increased from 5.5% in 2001 to as high as 18.9% in 2011. However, the total number of quit attempts in England did not correspondingly increase, indicating a simultaneous reduction in quit attempts without SSS support (figure 3). Of all long-term quitters, the proportion of quitters who received support from the SSS reduced from 15.7% during 2001–2012 to 14.0% during 2013–2016. Using data from statistics on smoking in England,7figure 4 shows the changes in smoking prevalence and the implementation of several tobacco control measures in the UK during 1990–2016. Smoking prevalence was reduced by 0.30% per year during 1990–2000 and reduced by 0.85% per year during 2000–2007. The decline during 2000–2007 was at least partially attributable to both the SSS and the ban on smoking in public places in 2007, although other relevant tobacco control activities will also have contributed to this (see figure 4).31 However, the reduction in smoking prevalence slowed during 2007–2012, to only 0.10% per year, even with an increased number of SSS users. Then, the decline in smoking prevalence increased to 1.08% per year during 2012–2016, in a period when the use of the SSS was much reduced. The recent faster reduction in smoking prevalence may be due to the increased use of electronic cigarettes and other tobacco control measures.25 26

Changes in smoking prevalence and implementation of tobacco control measures in England. Smoking prevalence originally reported in official statistics. NHS, National Health Service; SSS, Stop Smoking Services.
In summary, we estimate that approximately 15% of the reduction in smoking prevalence during 2001–2016 in England was associated with the SSS. However, the actual impact of the SSS is likely to be smaller than this because some of the long-term quitters with SSS support, it may be assumed, would have quit smoking anyway even without SSS support. In addition, the provision of cessation support has a limited effect on the initiation of quit attempts, as revealed by the fact that an increased number of quit attempts with SSS support was accompanied with a reduced total number of quit attempts during 2007–2011.
Since 2013, the SSS has changed due to both declining client numbers23 and public health budget cuts,24 with much less support available from specialist smoking cessation advisors. Although specialist cessation support may not be necessary to all quit attempts, it may improve quit success for some. It has been advocated that the English SSS should be a mix of specialist support for a small number of smokers who really want it, brief support plus cessation medication for many and self-help for the majority.32 Future studies, including modelling evaluations, are required to compare different strategies of SSS and other tobacco control measures.
Strengths and Limitations
The impact of the SSS on smoking prevalence cannot be assessed in randomised controlled studies, and so a modelling approach is required. There have been several previous simulation modelling studies on smoking prevalence or cost-effectiveness of smoking cessation services in the UK.6 27 28 33 34 However, in previous modelling studies, the impact of cessation programmes on smoking prevalence was always considered as a known parameter, rather than an outcome of the evaluation. For example, a modelling study on smoking prevalence was based on the assumption that cessation treatment would reduce smoking prevalence by 4.75% during 1998–2010 in the UK.6 Using real-world data and a novel modelling approach, the present modelling study is the first to assess the impact of smoking cessation services on smoking prevalence over time, by considering such impact as an outcome of the evaluation.
One specific feature of the present simulation modelling was to calibrate the number of smokers who stopped smoking according to the change in smoking prevalence. As expected, the estimated rates of smoking prevalence in England during 2001–2016 were similar to the observed smoking prevalence. However, the estimated rates of never smokers were lower, and the estimated rates of former smokers were higher, compared with the reported rates based on survey studies (figure 2). These differences have been reported previously as the phenomenon of ‘reclassification’.27 That is, former smokers might consider themselves as never smokers after having quit for many years. In addition, a change in the definition of never smokers for people aged 16 and 17 led to an increase in the reported proportion of people who were never smokers in England since 2012 (from 56.0% in 2011 to about 59.5% in 2012–2016), and simultaneously a reduction in rates of former smokers.7
The number of quit attempts and short-term quitters in the SSS was relatively certain because of availability of official statistics for these services. However, the number of 12 month quitters was estimated based on several studies of long-term outcomes among SSS clients. For the total number of quit attempts, we used data from a series of national surveys in England.18 19 It is unclear whether the observed fluctuations in the reported rates of quit attempts were true or due to sampling errors. The rates of smoking relapse, relative risk of death for never, current and former smokers are all estimated based on limited literature or datasets. Due to a lack of data from studies in England, we used data from the USA on relative risks of death for former smokers by time since cessation. For simplicity, we used a deterministic modelling approach without explicitly incorporating uncertainty and sampling errors, although the results on average are unlikely to be different after incorporating sampling errors into the simulation modelling.
There are further limitations in the present study, including that we did not evaluate the cost-effectiveness of the SSS for smoking cessation. Smokers who quit smoking using SSS support may be systematically different from those who quit without SSS support. The current study focused on the overall smoking prevalence by age and gender, without considering differences in smoking prevalence by socioeconomic status. In addition, we focused on the impact of the SSS, and did not explicitly consider cessation support from other sources, including the use of e-cigarettes. The present study focused on the SSS in England, and results may not be generalisable to other nations (Scotland, Wales and North Ireland) in the UK. Finally, available data were insufficient to estimate how many quitters with SSS support would have quit smoking anyway even without SSS support. However, the current study provides unique empirical evidence regarding the impact of smoking cessation support delivered through a national network of formal cessation services on prevalence.
Conclusions
Approximately 15% of the percentage point reduction in smoking prevalence during 2001–2016 may be attributable to the NHS SSS in England, although the actual impact of the formal smoking cessation services remains uncertain as some people who stopped smoking with support from the SSS would have quit anyway without formal and intensive support.
What this paper adds
What is already known on this subject?
The implementation of key tobacco control measures, including cigarette taxes, smoke-free laws, public information campaigns, advertising bans, health warning and cessation treatment, is associated with increased cessation rates and reduced smoking prevalence at the population level.
What important gaps in knowledge exist on this topic?
The relative impact of each of the key tobacco control measures on a population’s smoking prevalence remains unclear.
As the first such services in the world, the impact of the National Health Service Stop Smoking Services (SSS) on smoking prevalence in England has not been comprehensively quantified.
What this paper adds?
Based on official statistical data and published literature, we developed a novel computational model to quantify the impact of the SSS on smoking prevalence between 2001 and 2016 in England.
Smoking prevalence was reduced by 10.8% in absolute terms between 2001 and 2016 in England, and approximately 15% of this reduction could be attributable to the SSS.
Acknowledgments
We thank Professor Robert West for providing helpful comments on the draft manuscript.
References
Footnotes
Contributors FS conceptualised the initial idea, searched literature, collected data, developed the simulation model and prepared the draft manuscript. TE-S and FN critically commented on draft manuscripts and helped interpret modelling results. FS has access to the data and accepts full responsibility for the work.
Funding The authors have not declared a specific grant for this research from any funding agency in the public, commercial or not-for-profit sectors.
Competing interests None declared.
Patient consent for publication Not required.
Provenance and peer review Not commissioned; externally peer reviewed.