Article Text

Abstract
Background Electronic nicotine delivery systems (ENDS) are the most-used tobacco product by adolescents, and Juul has rapidly become the most popular ENDS brand. Evidence indicates that Juul has been marketed heavily on social media. In light of recent lawsuits against the FDA spurred by claims that the agency responded inadequately to this marketing push, measuring the social media conversation about ENDS like Juul has important public health implications.
Methods We employed search filters to collect Juul-related and other ENDS-related data from Twitter in 2017–2018 using Gnip Historic PowerTrack. Trained coders labelled random samples for Juul and ENDS relevance, and the labelled samples were used to train a supervised learning classifier to filter out irrelevant tweets. Tweets were geolocated into US counties and their fitness for use was assessed.
Results The amount of Juul-related tweets increased 67 times over the study period (from 18 849 in the first quarter of 2017 to 1 287 028 in the last quarter of 2018), spreading widely across US counties. By the last quarter 2018, 34% of US counties had more than 6 Juul-related posts per 10 000 people, up from 0% in the first quarter 2017. However, during the same period, the total of non-Juul ENDS-related tweets decreased by 25%.
Conclusions Juul-related content grew exponentially on Twitter and spread across the entire country during the time when the brand was gaining market share. This social media buzz continued to increase even after FDA’s multiple interventions to curb promotions targeting minors.
- electronic nicotine delivery devices
- media
- surveillance and monitoring
- social marketing
This is an open access article distributed in accordance with the Creative Commons Attribution Non Commercial (CC BY-NC 4.0) license, which permits others to distribute, remix, adapt, build upon this work non-commercially, and license their derivative works on different terms, provided the original work is properly cited, appropriate credit is given, any changes made indicated, and the use is non-commercial. See: http://creativecommons.org/licenses/by-nc/4.0/.
Statistics from Altmetric.com
Introduction
Electronic nicotine delivery systems (ENDS) have been the most popular tobacco product among adolescents in the USA since 2014,1 sparking concerns among the public health community regarding increases in youth nicotine addiction and transition to combustible cigarette smoking. In 2016, 4 out of 5 youth in the National Youth Tobacco Survey reported exposure to ENDS advertising from at least one media source,2 and advertising exposure has been associated with ENDS use among adolescents.3 4 Further evidence indicates that social media are a dominant avenue for ENDS product advertising, particularly aimed at youth and young adults5–7; studies have demonstrated that ENDS are marketed heavily on social media platforms such as Instagram, Twitter and YouTube.8–10 ENDS users actively engage on social networks to access and share information about the products.11 12
A new generation of ENDS gained traction in the US market in 2017. These products, collectively called ‘pod vapes’, resemble flash drives and are rechargeable at USB ports. The largest brand of pod vapes is Juul, first introduced in June 2015 and manufactured by Juul Labs, Inc. Only a year after its entry to the ENDS market, Juul achieved market domination. Juul’s sales growth coincided with a surge in innovative and engaging social media campaigns conducted by Juul, online ENDS vendors, social media influencers and retail stores.13–15
Because of its popularity and its dominant market position,16 Juul has become eponymous for all pod-style vape devices, and their use is termed ‘Juuling’.14 The Juul brand and other brands of pod vapes, along with ENDS marketers, online vendors and retail stores, aggressively employed social media to advertise and promote Juul and Juuling, and there is evidence that adolescents actively participate in Juul-related social media conversations.17–20
Although ENDS marketing and promotion on social media have been largely unregulated, the FDA has increased its scrutiny of ENDS products and marketing since the issuance of the Deeming regulation in 2016.21 Partly due to concerns regarding Juul’s rapid ascension to youth popularity, in March 2018 a coalition of public health groups sued the FDA for delaying rules on ENDS and cigars by granting lengthy deadline extensions to manufacturers seeking product approval.22 In response, between April and June 2018 the FDA issued a series of warning letters and civil fines to retailers who illegally sold Juul and other ENDS to minors.23 In October that year, facing rising concerns about advertising targeting youth, the FDA conducted a surprise inspection of Juul Labs’ headquarters, seizing documents related to its sales and marketing practices.24 In an ostensible effort to curb Juul use by minors, and in response to public outcry and the FDA’s warnings, Juul announced in June 2018 that it would “no longer use models on social media platforms”. Juul also removed all non-tobacco, non-menthol flavours from its 90 000+ retail outlets’ shelves, and shut down its Facebook and Instagram accounts in November 2018 with a promise that it would limit its presence on Twitter to non-promotional communication and would ask social media platforms (including Twitter) to prohibit posts that promote underage use of ENDS.25 26 In response to recently reported vaping-related lung illnesses and deaths, and the intensified scrutiny and regulatory responses from FDA and several states, Juul suspended all broadcast, print and digital product advertising in the US in September 2019.27
Brands, influencers and regular people share promotional content, opinions, reviews, intentions and behaviours related to ENDS use—including Juuling—on social media platforms. One recent study illuminated Juul’s popularisation on Twitter, finding that a majority of Juul-related tweets collected mentioned personal use (eg, ‘juuling’), where Juul was used (eg, school, bathroom), its resemblance to a flash drive, Juul as a gift/holiday costume, or addiction/nicotine dependence.28 Other research suggests that users share thoughts, behaviours and information regarding Juul with other users potentially bonding around Juul use on Twitter; and that few Twitter users mention smoking cessation with Juul, despite the manufacturer’s branding of Juul as a smoking alternative.29
ENDS-related content on social media has powerful potential to influence ENDS use by modelling, normalising and even incentivising the behaviour.30–33 To date, research on individuals’ exposure to ENDS-related social media posts has relied on self-report (ie, survey) measures. However, self-reported exposure measures can suffer from simultaneity bias (also known as endogeneity), which causes measurement errors: individuals who are interested in using ENDS or already use those products will have greater opportunities for exposure to ENDS-related messages on social media because of their online search activities and social networks.34 In addition, self-report carries the risk of recall or salience bias: respondents who use or are interested in ENDS may be more likely to recall seeing ENDS-related posts because such posts are more salient to them. Ideally, self-reported recall measures should be used in conjunction with exogenous assessments of the amount of social media posts in a given geographical region during a specified time period.
An exogenous measure would not represent any individual’s exposure to or engagement with a specific post, but rather is the aggregation of relevant posts in a community, which constitutes the public communication environment (PCE) related to ENDS in the community. The local ENDS-related PCE reflects both opportunities for exposure to such messages—potential exposure—and the relative prominence of the topic in the PCE.31 35 For example, in a community where local vape shops and tobacco vendors post messages on social media about their products, price promotions and other marketing messages, local vape enthusiasts and consumers may follow the accounts of the vape shops, and have direct exposure to the messages; they may also repost (or share) such messages, creating electronic Word of Mouth and producing opportunities for indirect exposure to the messages among their community of followers.36 While an individual may or may not remember specific incidents of direct or indirect exposure or engagement, the proliferation of such messages reflects community norms and culture and thus constitutes the local PCE related to ENDS. Using Twitter data, we can measure the local PCE related to ENDS, observe how quickly Juul gained its popularity, and examine where and when the opportunities for exposure to Juul-related and other ENDS-related posts were great.
We opted to use Twitter for this study for two reasons, although our method could be used for any other platform that comes with geolocation data. First, we could have used either Instagram or Twitter because subsets of users in both platforms provide user location information; however, proportionally more geolocation information is available on Twitter than on Instagram. Second, we considered Twitter to be an amply adequate platform for studying how emerging products like Juul are used, marketed and relevant information is shared among young people. Twitter users are younger than the general population37; 32% of online teens38 and 45% of young adults (aged 18–24 years) use Twitter.39 Further, it has been estimated that adolescents actively participate in tweeting about Juul.20 40 In addition, Twitter has been considered an important data source for addressing/monitoring emerging issues and products in public health surveillance or epidemiological research41 because the Twitter application programming interfaces (APIs) enable near real-time data collection.
We analysed the amount of Juul-related and non-Juul ENDS-related posts on Twitter between January 2017 and December 2018 across the 3142 counties of the US. Mapping tweets to geolocations is key to characterise the ENDS-related PCE and observe geographical variations of the PCE. The objectives of this study are twofold: to construct the PCE measures of Juul-related and non-Juul ENDS-related posts using Twitter data and examine its fitness for use; and to study how quickly and widely Juul-related messages spread across the US. This analysis draws on methods we have previously developed and applied to characterising ENDS-related social media posts,42 and advances those methods to test whether geolocated tweets introduce selection bias resulting from systematic differences between users who allow geolocation identification and those who do not.43 Thus, we also assess possible bias and the statistical ‘fitness for use’ of geolocated tweets in the PCE characterisation.44 45 This study will contribute to the knowledge on statistical property of geolocated tweets and social media measurement related to ENDS products.
Methods
Data collection for Juul-related tweets
Tweets posted between January 2017 and December 2018 were collected using a Juul search filter, which searched for tweets containing the substring “juul” or those posted by user accounts whose names match the substring “juul”. The search was restricted to English-language tweets, as identified by Twitter in the metadata (filtered by the operator lang: En). A total of 4.7 million tweets were retrieved via Gnip Historic PowerTrack, which provides access to 100% of public tweets and allows retrospective queries. Containing the string “juul” in tweets and user names does not guarantee content relevance because #JUUL, for example, was often used as a way to attract attention although tweet content (and linked images or URLs) was not relevant, and person name may contain “juul” as a substring regardless of posting about Juul; therefore, an effort was made to exclude irrelevant tweets.
A team of coders was trained to identify Juul-relevant content and reviewed a random sample of 2600 tweets to determine whether a tweet was Juul related. Images and URLs embedded in tweets were used to aid the hand-coding for relevance. Using the labelled sample, we trained a supervised machine learning model to automatically classify Juul-relevant content from irrelevant content. Standard text pre-processing was performed: standard English stop words and punctuation were removed, and word unigrams and character four-grams (sequence of four characters) from tweet content and linked URLs were extracted and transformed into term frequency-inverse document frequency (TF-IDF) representation. The best-performing classifier found via grid search was a Stochastic Gradient Descent (SGD) classifier with log loss (a.k.a. Logistic regression) and L2 norm.46 47 The Juul-relevance classifier’s performance was excellent, demonstrating 96% precision and 97% recall (F1 score 97%) via 10-fold cross-validation. We excluded tweets that were classified as not relevant to Juul, and the final analytic dataset contained 3 715 539 tweets.
Data collection for ENDS-related tweets
Twitter data for ENDS were collected separately. The authors and their research team have developed and maintained a database of ENDS-related Twitter data collected since 2014 via the Gnip Historic PowerTrack. The data pulled from this database have been used elsewhere.14 42 Tweets were collected using an ENDS search filter, which comprised a comprehensive list of more than 300 relevant keywords and search rules to retrieve content related to ENDS. The ENDS search filter was developed based on expert knowledge and examining relevant posts on Twitter and other social media platforms, and updated at regular intervals over the years and whenever we learnt popular new products emerged in the market. Moreover, it is our typical practice to retrospectively collect data again in case we learn that important keywords were missed after data collection. Since ENDS encompasses a wide variety of products and devices, to capture all ENDS-related content, our keyword rules included specific ENDS brands, device types and components, and colloquial vocabulary associated with ENDS use (eg, njoy, juul, vuse, blu, eonsmoke, ecig, ejuice, ehookah, cartomizer, vape, vaping). Our general approach to developing search filters to collect social media data is described in Kim et al.42 The final list of keywords and search rules for this study is available on request.
Our ENDS search filter retrieved 25.8 million tweets in 2017–2018 containing both relevant and irrelevant content. To filter out irrelevant tweets, a classifier was trained using a random sample labelled for ENDS relevance by trained coders. The classifier was tuned incrementally by adding more training samples over the years to learn unobserved patterns (if any) in new data. The training sample used for this study contained 12 500 tweets and their account names and linked URLs, from which word unigrams and character n-grams (sequences of n characters, n=3,4,5 used) were extracted and transformed into TF-IDF representation. An SGD with smoothed hinge loss and L2 norm was found to perform best via the grid search. The ENDS-relevance classifier’s performance evaluated via 10-fold cross-validation yielded 96% precision and 92% recall (F1 score 94%). We excluded tweets classified as not relevant to ENDS, resulting in 10 620 249 tweets for the period 2017–2018.
Data for non-Juul ENDS-related tweets
Searching for tweets containing the “juul” in the body of tweets was one of the many rules that comprised ENDS search filter; as a result, a set of tweets were collected by both of the ENDS search filter and the Juul search filter. Therefore, among the 10 620 249 ENDS-classified tweets (“B+C” in figure 1), 198 497 tweets were also classified as relevant to Juul by the Juul-relevance classifier (“B” in figure 1). To construct a dataset for non-Juul ENDS-related tweets, we removed the Juul-related tweets from the set of ENDS-related tweets. The final dataset for analysis of non-Juul ENDS tweets contained 10 421 752 tweets (“C” in figure 1).

Twitter data for Juul-relevant and non-Juul ENDS posts. A+B represents Juul-relevant tweets (n=3 715 539) identified by Juul-relevance classifier; B+C represents ENDS-relevant tweets (n=10 620 249) determined by ENDS-relevance classifier; B represents the set of tweets (n=198 497) identified by both Juul-relevance classifier and ENDS-relevance classifier.
Geolocation of tweets
Less than 3% of tweets are tagged with longitude and latitude by Twitter users; this automatically tagged coordinate is a bounding box indicating an area of user location when he/she posts a tweet. While only a fraction of Twitter users enable geographical coordinate tagging, many users publicly indicate their location or residence either by selecting a city and state from a preset dropdown menu, or by directly typing place names in their account profiles. Gnip uses this information in user profiles to geocode Twitter users’ locations by matching the place names against the database from GeoNames.org48 and provide coordinates for a centre location of the place (eg, centre of a city or state). Approximately 20%–40% of all tweets come with this Gnip-predicted user location, and the amount of usable location data varies by topic and time. We used both automatically tagged location and the Gnip-enhanced geolocation metadata in our analyses; when both locations were available for a tweet and disagreed each other, automatically tagged location preceded Gnip-predicted location.
Using the python package Shapely V.1.6,49 which handles geometric objects, we mapped the geographic coordinates into US counties for 1 078 387 Juul-relevant tweets and 1 845 827 non-Juul ENDStweets. When a bounding box of tagged coordinates locates an area intersected by county boundaries, we selected the county with a larger area segment.
Analysis
To understand geographical variation in tweeting related to Juul and non-Juul ENDS and how such variation changes over time, descriptive statistics for tweet rates across US counties were calculated by quarter. Geolocated tweets were aggregated to calculate the number of tweets per day over the study period.
We assessed whether the geolocated tweets are representative of the overall patterns in amount and content from the perspective of ‘fitness for use’.44 45 In other words, we assessed whether a set of geolocated tweets is a biased subset of all tweets. To assure that geolocated tweets are not biased in regard to studying amount—spikes and temporal patterns—of all tweets, both the series of all tweets (ie, geolocated tweets and non-geolocated tweets combined) and the series of geolocated tweets were plotted over time and Pearson correlations were calculated to see if they move in the same direction. It is also known that two independent sets of time-series may appear correlated due to within-series dependence. Therefore, we also examined correlations between residuals after fitting Loess smoothing curves to reduce the impact of within-series dependence.
To demonstrate that geolocated tweets are not biased regarding content, we used a bag-of-words approach, in which text is represented as an array of frequencies and occurrences of words, and calculated cosine similarity between geolocated tweets and all tweets.50 51 Cosine similarity measures the similarity of documents based on words shared between two documents relative to sizes of the documents and ranges from 0 to 1. We examined tweets for each day in the study period in order to compare the content of geolocated tweets with the content of all tweets for that day; every single words were extracted from the day’s tweets and transformed into TF-IDF representation, and cosine similarity was calculated per day. Cosine similarity is appropriate for this study because it is not affected by daily amount of tweets.
We created a county-specific tweet rate for each dataset, Juul-related and non-Juul ENDS-related tweets, which represents the amount of tweeting activity for each topic, relative to county population. County-specific tweet rates were calculated by summing the number of geolocated tweets by county per quarter, and dividing this figure by county population size and multiplying it by 10 000 to create the measure of tweet rate per 10 000 people (‘tweet rate’ henceforth). This adjustment accounts for the fact that Twitter use is more common in urban than in rural areas, which would otherwise bias estimates of the amount of tweeting activity in a county. We generated a series of quarterly maps to display tweet rates across counties.
Results
Geolocated tweets versus all tweets
Approximately 29% of Juul-relevant tweets (1.5% from user tagging and 27.5% from Gnip prediction) and 18% of non-Juul ENDS-relevant tweets (1% from user tagging and 17% from Gnip prediction) were geolocated to US counties. For Juul-related tweets, the cosine similarity of the content between geolocated tweets and all tweets (geolocated and non-geolocated combined) increased over time, from an average of 0.62 (SD 0.19) in January 2017 to an average of 0.93 (SD 0.05) in December 2018 (figure 2). Interestingly, variability (SD) in the content similarity decreased over time. For non-Juul ENDS tweets, on the other hand, cosine similarity between all tweets and geolocated tweets was rather steady with random fluctuations over time around an average of 0.67 with near-constant variability (SD 0.18).
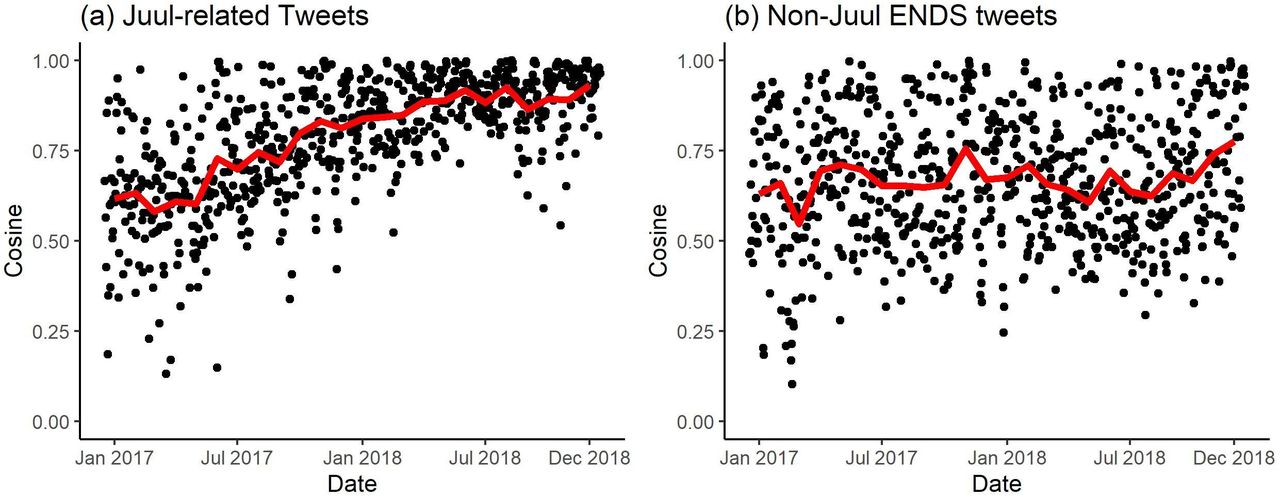
Cosine similarity between geolocated tweets and all tweets. Black dots indicate cosine similarity per day, and red lines indicate average cosine similarity per month.
Figure 3 presents the patterns of Juul-related tweets over time; blue line indicates the number of all tweets per day and red line indicates the number of geolocated tweets per day. The two series of daily amounts were nearly perfectly correlated (Pearson r=0.996). The residuals after fitting smoothing curves to both series were also highly correlated (Pearson r=0.995), indicating the set of geolocated tweets move in nearly the same direction with the set of all tweets. Similarly, the two series of daily amounts of non-Juul ENDS tweets were highly correlated (Pearson r=0.936; see also figure 4) and so were their residuals (Pearson r=0.935).
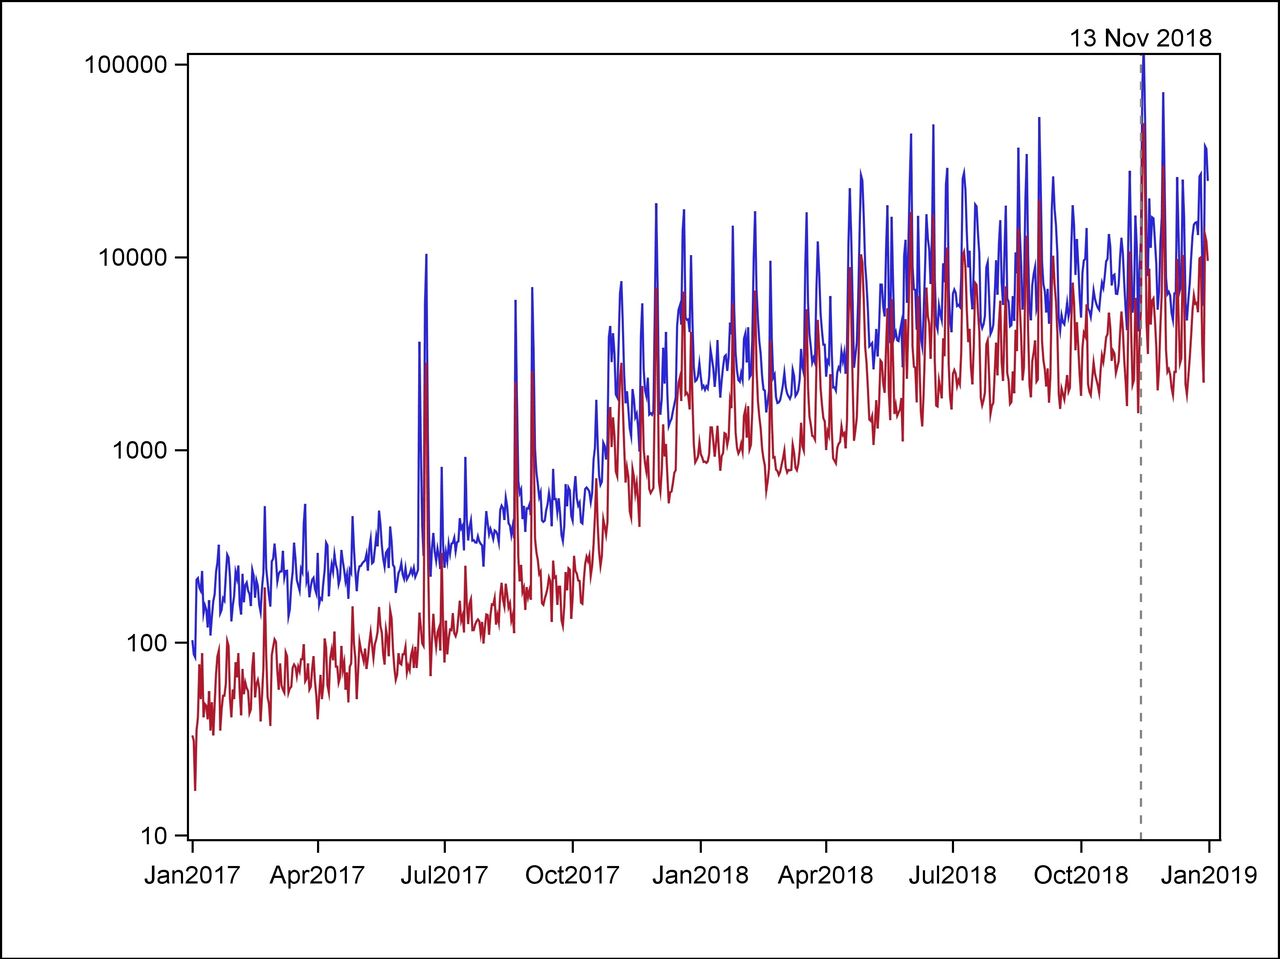
Daily amount of Juul-related tweets, 2017–2018. Daily count of tweets is log-transformed (base 10) on y-axis. The upper blue line represents the number of all Juul-related tweets per day and the red line represents the number of geolocated Juul-related tweets per day. November 13, 2018 when Juul Labs closed its Facebook and Instagram accounts is indicated with a dashed vertical line.

Daily amount of non-Juul ENDS-related tweets, 2017–2018. Daily count of tweets is log-transformed (base 10) on y-axis. The upper blue line represents the number of all non-Juul ENDS tweets per day and the red line represents the number of geolocated non-Juul ENDS tweets per day. November 13, 2018 when Juul Labs closed its Facebook and Instagram accounts is indicated with a dashed vertical line.
Because geolocated tweets constitute a subset of all tweets, positive values for cosine similarity and correlation were expected. However, values of Pearson correlation and cosine similarity were sufficiently large, even considering the degree of overlap caused by the geolocated tweets (29% of Juul and 18% of non-Juul ENDS tweets were geolocated). Overall, the words of geolocated tweets were sufficiently similar to the words used in all tweets. Interestingly it appears that over time, Juul-related content of geolocated tweets became more similar to and better represents content of all tweets.
Variation over time
The amount of Juul-related tweets increased by a factor of 67 over the study period (blue line in figure 3): from 18 849 in the first quarter of 2017 (“Q1”) to 1 287 028 in the last quarter of 2018 (“Q8”); the corresponding amount of geolocated tweets (red line) increased from 4386 in Q1 to 376 264 in Q8.
The amount of Juul-related tweets increased exponentially throughout the 2-year period and did not decline even after Juul’s several voluntary actions including November 2018 when Juul closed its Facebook and Instagram accounts. The daily count of Juul-related tweets reached the maximum 125 130 in November 15, 2018 because of CDC’s and FDA’s announcements and news reports related to Juul’s announcement on November 13, 2018.52–54 One of the most viral Juul-related posts was on June 17, 2018 about having “accidentally juuled” in front of parents and pretending it never happened; this post contributed to 87% of Juul-related tweets that single day.
The number of tweets posted by Juul Labs (@JUULvapor) also increased over time: from 7 in January 2017 to 259 in December 2018 (online supplementary figure A, appendix). Juul Labs’ tweets were also shared (ie, retweets of tweets by @JUULvapor) at increasing rates, with a rapid upward trend from late 2017 to early 2018, and then a decline was observed (online supplementary figure A, appendix). However, the amount of tweets by Juul Labs and their retweets accounted for less than 1% of all Juul-related tweets, and its relative frequency decreased over time, suggesting Juul’s marketing was very effective in keeping up the popularity of Juul-related content on Twitter.
Supplemental material
Figure 4 displays the amount of ENDS-related tweets that were not about Juul. The amount of non-Juul ENDS-related tweets was 1 480 649 in the first quarter of 2017 (“Q1”) and gradually decreased over time by 25% to 1 102 756 in the fourth quarter of 2018 (“Q8”); the corresponding amount of geolocated tweets also decreased from 269 501 to 202 452 over the eight quarters.
Over the 2-year period, the total of all ENDS-related tweets (“A+B+C” in figure 1), including both Juul and non-Juul, increased by 59% from 1 499 498 in Q1 to 2 389 784 in Q8; an average increment of ~111 000 tweets per quarter. This growth was largely due to Juul-related content, as the proportion of ENDS-related tweets about Juul increased from 1.3% in Q1 to 53.8% in Q8.
Geographical variation over time
To examine geographical variation in the amount of tweets over time, a series of county maps of Juul-related and non-Juul ENDS-related tweet rates from the first quarter of 2017 (“Q1”) to the last quarter of 2018 (“Q8”) are presented in figure 5. For each quarter, the county-specific tweet rate per 10 000 was categorised to six levels: 0, 0.1–1.5, 1.6–3.0, 3.1–4.5, 4.6–6.0 and above 6.0, to facilitate visualisation. Frequency of counties by the level of tweet rates is presented in online supplementary appendix table A.

Rates of tweets related to Juul (left) and non-Juul ENDS (right) across US counties by quarter in 2017–2018.
Descriptive statistics for Juul-related tweet rates over counties are presented by quarter in table 1 to show changes in the amount and the inter-county variation. Over the eight quarters, both median and mean tweet rates increased, as well as IQR and SD, indicating that the amount of tweets and its inter-county variation increased. During the Q1, 2678 (85%) counties had no Juul-related tweets (online supplementary appendix table A), and both median and IQR of tweet rates were zero (table 1). In the last quarter of 2017 (“Q4”), more than half the counties (52.7%) had non-zero tweet rates, although only 2.2% had active posting (larger than 6 tweets per 10 000). By the last quarter Q8, 84.1% counties had non-zero tweet rates, and 1081 (34.4%) counties had tweet rates greater than 6; Los Angeles County, CA had the top number of tweets (=16 513), and Cape May County, NJ had the top tweet rate (=163 per 10 000).
Summary statistics for tweet rates over counties by quarter
Table 1 also presents descriptive statistics for the rate of non-Juul ENDS-related tweets over counties by quarter. Both median and IQR values of non-Juul ENDS tweet rates increased gradually in 2017 and then decreased in 2018. Mean and SD values fluctuated more widely than median and IQR, indicating that some counties had extreme tweet rates. During the peak in the last quarter of 2017 (“Q4”), 2333 (74.3%) counties had non-zero rates of non-Juul ENDS tweets and 378 (12.0%) counties had a tweet rate of higher than 6. One of the top counties was Fulton County, GA, with a tweet rate of 100 during Q4. Since then, non-Juul ENDS tweet rates decreased, and by the second quarter of 2018 (“Q6”), the rate of Juul-related tweets exceeded the rate of non-Juul ENDS tweets by an average of 0.7 more Juul tweets per 10 000.
Summary and discussion
The results of our study reveal four important findings. First, our study shows that Juul-related content on Twitter increased rapidly in 2017–2018. In early 2017, Juul-related content on Twitter was scarce. However, between the first quarter of 2017 and the last quarter of 2018, the amount of Juul-related tweets increased by 67 times, from an average 1450/week to over 99 000/week. The amount of tweets by Juul Labs and their retweets also increased during this time, but it was a small fraction of all Juul-related tweets, suggesting that Juul’s marketing was very effective in making Juul-related content widespread. The exponential increase in Juul content over the study period likely reflects consumer/user-generated content about Juul products and use, and messages from and about a growing number of Juul-like competitors and compatible products, which were presumably inspired by Juul’s social media marketing.15 Similarly, Malik et al 20 reported that 72% of randomly sampled tweets was posted by regular people (non-commercial), mainly expressing personal opinions about Juul as well as personal use, intentions to use, and advocacy for Juul use and discussing tips, tricks and flavours; 13% was generated by the tobacco industry.
The proliferation of Juul-related posts on Twitter coincided with the rapid growth of sales and ENDS use—vaping nicotine in the past month among grades 8, 10 and 12 nearly doubled from 7.5% to 14.2% between 2017 and 2018.14 55 56 Studies report that 36% of Instagram posts that promoted Juul featured content appealing to or generated by youth,5 and about 45% and 44% of followers of Juul’s Twitter account @Juulvapor was predicted to be under 18 and young adults, respectively.57 Twitter users are younger than the general population37–39; thus, our Juul and ENDS Twitter data are more likely to reflect use, attitudes and information sharing of such products among youth and young adults than among an older adult population. Whether intended—or company sponsored—or not, it appears evident that Juul-related content on social media was reaching and influencing youth audiences.
Second, we found that during the 2-year period, Juul-related content spread rapidly and widely across the US. By the last quarter 2018, Juul-related tweets were posted from 84% of US counties, and 34% of counties had more than 6 posts per 10 000 people. About 70% of the US population resides in these counties with high potential exposure.
Third, our results revealed that despite the intense scrutiny of Juul’s marketing practice from the FDA and Congress, and the Juul Labs’ own voluntary action of taking down its social media account and restricting sales to minors, the discussion about Juul on Twitter did not abate. On the contrary, the amount of Juul-related content continued to increase even after FDA’s multiple strongly worded announcements to take actions to reduce youth vaping in 2018.52 58 59 For example, even after the FDA’s initial intervention in spring 2018 to curtail Juul sales to minors,23 our data indicate that the absolute amount as well as the amount per capita of Juul-related tweets continued to rise and appeared not to decline after Juul took several voluntary actions closing or restricting its social media accounts. This finding is consistent with another study using Instagram data, which found that the amount of Juul-related Instagram posts continued to increase despite Juul’s voluntary self-regulation.60
Fourth, our study also reveals that contrary to the rapid growth of Juul-related content on Twitter, the amount of non-Juul ENDS-related content declined in 2018. Specifically, the amount of ENDS-related non-Juul tweets decreased by 25% from 1.48 million in the first quarter of 2017 to 1.10 million in the last quarter of 2018. This finding may indicate that, had it not been for the Juul-related content on Twitter, the total ENDS-related content might not have increased so dramatically between 2017 and 2018. Therefore, potential exposure to ENDS-related content on Twitter may not have changed, had it not been for the Juul-related tweets.
In addition to these important findings, our study contributes to the research on ENDS-related social media in two important methodological aspects. First, the machine learning models we used in this study to clean data and classify relevant tweets related to Juul and other ENDS products yielded high values of precision and recall, lending support to the validity of the exogenous measures of the amount of Juul-related and ENDS-related content, the potential exposure to such content on Twitter, and the PCE related to Juul and ENDS within a community (county). Second, our approach of mapping tweets to US counties using the information from geographical coordinates tagged by users and locations provided by Gnip’s method proved successful based on the assessment of statistical fitness for use of the geolocated tweets. Specifically, temporal trends of geolocated tweets closely resembled those of all tweets, and the content of geolocated tweets was similar to that of all tweets. These findings suggest that our measures derived from geolocated tweets are reliable and unlikely to be biased. This indicates that it is feasible to examine temporal and geographical variations of social media content related to a specific topic, at least on Twitter, despite only a subset of users disclose their location information. In addition, this finding also demonstrates the feasibility of constructing valid and reliable measures of local PCE related to ENDS using Twitter data. Interestingly, for Juul-related tweets, the degree of similarity between geocoded and all tweets increased over time with decreasing variation. This may indicate that as Juul gained popularity, (1) common topics were shared between Twitter users who tagged or revealed their location and those who did not; (2) a language convention associated with Juul developed over time as Juul’s popularity increased, people became more familiar with the product and share the same vocabulary, and consumers engage with the same campaigns promoting Juul. Since Juul is one product, whereas ENDS are composed of diverse products, common topics and language may have been more easily shared for Juul tweets than for non-Juul ENDS tweets.
This study has certain methodological limitations. Because Twitter users disproportionately represent youth and young adults, our findings cannot be generalised to the larger population. The measure of tweet rates may be less reliable in some rural counties; small population size can inflate the per-capita amount, even when the number of tweets itself is not large. In addition, if a few active accounts tweet many times, it may distort the tweet rates, which may appear disproportionately large. This problem may be addressed by consolidating a few adjacent counties or assigning weights according to variance of tweet rates. Similarly, zero tweets in certain counties (likely rural ones) may not mean no tweet at all. It is possible a small number of tweets were posted from those counties without any indication of location. Further, the aggregated measure of geolocation tweets is vulnerable to geolocation prediction error. Although we did not assess the accuracy of Gnip’s method to predict user locations, we did assess fitness for use of the geolocated tweets. In particular, in the analysis of the amount and content of tweets, our results showed that a set of geolocated tweets may serve as valid representation of all tweets with regard to examining temporal trend and content.
Despite the limitations, this study demonstrated a method to construct a reliable and valid exogenous measure of the local public communication environment related to Juul and other ENDS products across US counties in a specified timespan. This work represents an important first step towards understanding how the ENDS-related social media conversation influences or reflects ENDS use. Recent research has shown that ENDS are promoted on social media using more diverse advertising strategies than in the offline marketplace.15 19 ENDS users actively use social media to access and share information about the products.11 12 Social media posts may reinforce and reflect their attitudes and behaviour related to ENDS. Online social networks are forums where adolescents and young adults spend a good deal of their time, and exposure to promotional content, discussions, and information-sharing on those platforms is likely to influence their attitudes toward and use of ENDS products.
A gap remains in the current literature to clarify how and to what extent the complex media and communications landscape affects young people’s attitudes, beliefs, susceptibility, and use of new and emerging tobacco products. Future studies should explore how this exogenous measure of the local PCE related to ENDS is associated with individual-level exposure measure and actual ENDS use.
What this paper adds
We analysed the amount of Juul-related and electronic nicotine delivery systems (ENDS)–related Twitter posts across time and space, showing a rapid increase in and widespread reach of Juul-related content on Twitter during the time when the brand was seizing market share.
This study is the first to demonstrate the methodology for constructing county-specific exogenous measure of ENDS-related communication on Twitter and assessing its statistical fitness for use.
Acknowledgments
The authors would like to thank members of Social Data Collaboratory, NORC at the University of Chicago for their valuable contributions to data collection and cleaning.
References
Footnotes
Twitter @kimysangy, @sherryemery, @JidongHuang
Contributors All authors together designed the study; YK collected data and conducted data analysis; YK, SLE and JH contributed to data interpretation; BD conducted data analysis; LV wrote the first draft; all authors revised the draft; the final version of the paper has been reviewed and approved by all coauthors.
Funding This research is supported by a grant funded by the National Institutes of Health (NIH) and National Cancer Institute (NCI) (R01CA194681-04S1) (Principal investigator: JH).
Disclaimer The National Cancer Institute did not play any role in study design; in the collection, analysis and interpretation of data; in the writing of the paper; or in the decision to submit the article for publication. The opinions expressed here are those of the authors and do not necessarily reflect those of the sponsors.
Competing interests None declared.
Patient consent for publication Not required.
Ethics approval This study was reviewed and determined not to be human subjects research by the Institutional Review Board at NORC at the University of Chicago (IRB00000967), under its Federal Assurance #FWA00000142.
Provenance and peer review Not commissioned; externally peer reviewed.
Data availability statement Data are available on request. Please contact YK (kim-yoonsang@norc.org) to request access to the data.