Article Text

Abstract
Tobacco taxation is the most effective measure to reduce cigarette consumption and consequently improve public health outcomes. It is also an important source of government revenue. The presence of an illicit tobacco market diminishes the public health and fiscal gains of cigarette levies by making cheaper non-taxed cigarettes available. To date, the research on the extent of illicit tobacco trade in the Philippines, despite its potential to inform policies for controlling the supply of illicit cigarettes, has been limited. This study provides an estimate of the size of the illicit tobacco market in the Philippines from 1998 to 2018. It employs gap analysis comparing an estimate of the survey-based adult cigarette consumption with legally sold cigarettes in the Philippines. The illicit trade estimates are contrasted with the evolution of tax changes. The results show that the illicit cigarette market share dropped by 42% from 2003 to 2008 and by an additional 79% from 2008 to 2013. In spite of the large tax increases by the Philippine government through the Sin Tax Law starting from 2013 until 2018, the illicit share in 2018 remains similar to its 1998 level of 16% of the total market. Hence, our study finds no evidence of a positive relationship between tobacco taxes and size of illicit cigarette market in the Philippines.
- illegal tobacco products
- taxation
- low/middle income country
Data availability statement
Data are available in a public, open access repository. All data relevant to the study are included in the article or uploaded as supplementary information. Data used for the study are secondary data which were obtained and publicly available from Global Adult Tobacco Survey, National Nutrition and Health Survey, Bureau of Internal Revenue and the Population Census of the Philippine Statistics Authority.
This is an open access article distributed in accordance with the Creative Commons Attribution Non Commercial (CC BY-NC 4.0) license, which permits others to distribute, remix, adapt, build upon this work non-commercially, and license their derivative works on different terms, provided the original work is properly cited, appropriate credit is given, any changes made indicated, and the use is non-commercial. See: http://creativecommons.org/licenses/by-nc/4.0/.
Statistics from Altmetric.com
Background
Tobacco consumption is known to negatively impact both users and those around them. The WHO recognises that ‘the tobacco epidemic is one of the biggest public health crises the world has ever faced, with more than 8 million deaths per year’.1 Yet, tobacco use does not solely impact health, but also the economy due to tobacco-related medical costs and productivity losses. Hence, a multidisciplinary and multifaceted approach is necessary to analyse tobacco control.
Numerous countries have been and are currently implementing a broad range of public health measures to tackle this issue. Among them, the WHO identified higher tobacco taxes as the ‘most cost-effective measure’ to decrease tobacco consumption and prevent initiation, especially among youth.2 Southeast Asian countries such as Thailand, Singapore and the Philippines have made significant advances in using tobacco taxes and other tobacco control policies to control consumption.3
In the Philippines, the 2013 Sin Tax Law, a recent excise tax reform covering tobacco and alcohol products, simplified the existing multitiered classification to a unitary tax system. From an average excise tax rate of ₱12.65 in 2011, the Sin Tax Law mandates the annual increase of excise tax on all tiers of cigarette products. By 2017, each pack was levied a ₱30 excise tax, followed by an annual 4% increase.4 In 2020, the excise tax per pack further increased to ₱45, and by 2023, a pack will be levied ₱60 excise tax followed by 5% indexation from 2024 onwards.5 The revenues collected from Sin Taxes are earmarked for health programmes and support for tobacco farmers and workers, diversifying economic activity away from the tobacco sector.
Yet, tobacco industry (TI) lobbyists continue to warn the government about the possible negative effects of tobacco tax increases. Apart from the job losses among tobacco farmers, the TI also argues that a higher tax on tobacco products will lead to more illicit tobacco on the market.6 The Philippines was considered as a ‘favourite’ transshipment point for smuggled cigarettes in 2009.7 Recently, the Bureau of Customs stated that cigarettes ranked first in the list of most smuggled products in the country.8 Reports of seizures are frequent in free port areas, such as in Subic and Batangas,9 and along the coast of Southern Mindanao, particularly the provinces of Zamboanga, Basilan, Sulu and Tawi-Tawi10 where maritime patrols are easily evaded.11 However, few studies measure the size of the illicit tobacco market in the Philippines. This research fills the void by providing estimates of the size of the illicit cigarette market and its trends over time. We contrast our estimates with the evolution of tax changes to assess relationships between the tax rate and the illicit cigarette market.
The true extent of illicit tobacco trade remains difficult to measure owing to its clandestine nature. Yet, there are several approaches that can be used to estimate its magnitude.12 Merriman et al 13 estimated that between 6% and 8.5% of the global cigarette market was smuggled in the 1990s and concluded that cigarette prices were not to be blamed, since countries with more expensive cigarettes had lower levels of cigarette smuggling. From that report, the illicit cigarette market in the Philippines represented about 19% of the 1995 domestic sales. The global estimates of the illicit cigarette market updated by Joossens et al 14 claimed that 11.6% of the global cigarette market is illicit. The estimate in the Philippines stayed almost unchanged at 19.4%, the equivalent of 18.5 billion cigarettes in 2006.
Due to its growing smoking population, Southeast Asia remains an attractive destination and transit point of illicit tobacco; 6 out of 10 Southeast Asian countries have shares of the illicit tobacco market above the world average.15
The only academic estimate of the size of the illicit cigarette market in the Philippines was published in 2014 by Abola et al.16 It employed both gap analysis and trade discrepancy methods. The study found that cigarette consumption did not exceed legal sales from 1994 to 2009 even though the Family and Income Expenditure Survey (FIES) used for the study likely understated the true cigarette consumption. Meanwhile, the magnitude of trade discrepancies of the Philippines with its trading partners decreased from 1994 to 2009, pointing to a reduction in illicit trade. By 2009, the trade discrepancy (ie, cigarettes reported to be exported to the Philippines, but not recorded as imports) accounted for 10% of the domestic market as opposed to 14% in 2007. The authors concluded that there is no evidence of sustained illicit trade, despite the continuous tax increase from 1997 to 2009. This contradicted the earlier industry-funded estimates of 19% presented in Merriman et al and in Joossens et al.13 14
The 2012 industry-funded estimates of illicit consumption share in the Philippines was 5.9%.17 The same source claims that after the passage of the 2013 Sin Tax Law, the share of illicit consumption significantly increased to 18.1% and 19.4% in 2013 and 2014, respectively. Surprisingly, the share of the illicit market almost returned to its initial level of 6.5% by 2017, according to industry estimates. However, these estimates were criticised due to inconsistencies, questionable sources of data and lack of transparency about methodology.18
Methods and Data Sources
Data sources
The gap method relies on the availability and consistency of cigarette use estimates among the population over a long period of time.19 Cigarette consumption estimates are based on surveys which occur every 3–5 years and allow us to use linear models to predict annual consumption through the smoking prevalence (adult population who smoked at least one cigarette stick during the last 30 days) and smoking intensity (cigarette sticks consumed in a day per smoker).
Currently, the country has six data points (1998, 2003, 2008, 2013, 2015 and 2018) available for the smoking prevalence from the National Nutrition Health Survey (NNHeS).20 21 However, the surveys only capture adults aged from 20 years old and above; the government allows legal consumption for Filipino adults from 18 years of age. Global Adult Tobacco Survey (GATS), on the other hand, takes into account Filipinos aged 15 and above but has only conducted two surveys—in 2009 and 2015.22 Meanwhile, the smoking prevalence of adolescents ages 10–19 years old from NNHeS decreased from 6.9% to 5.5% in 2015.21 While, Global Youth Tobacco Survey in 2015 showed that the smoking prevalence of young adults aged 13–15 increased to 12% compared with the 2011 estimate of 8.9%.23
In order to establish the appropriateness of using estimates from both survey sources (NNHeS and GATS), we conducted a sensitivity analysis to test if there were any significant differences between the means of smoking prevalence and intensity reported by NNHeS and GATS. Both surveys reported the sample size, mean and CI, but SD were not reported. Hence, we derived the SD using the formula for a CI. The SD was used in the z-test. The z-test determines if there is a significant difference between the two surveys in the mean smoking prevalence and the mean smoking intensity, based on data from 2015 (when both surveys were conducted).
The two surveys generated statistically different estimates of mean smoking prevalence, with NNHeS generating a z-value greater than the z-score. Meanwhile, we did not find a statistically significant difference in smoking intensity between the two surveys (table 1).
Sensitivity analyses on two different means for smoking prevalence and smoking intensity for 2015
We used the NNHeS data to estimate smoking prevalence since it covers a longer period of time: 1998, 2003, 2008, 2013, 201520 and 2018,21 with CIs available for only 2008–2018 surveys. These CIs are important in order to assess if changes in consumption are statistically significant over time. We used GATS 2009 and 201522 estimates for smoking intensity since NNHeS measured it only once, in 2015. Since there is no significant difference in the smoking intensity between two surveys deployed in 2015, the 2009 GATS estimate of 10.6 cigarette sticks per day was used to estimate the cigarette consumption in 1998, 2003 and 2008, while the 2015 GATS estimate of 11 cigarette sticks per day was used in 2013, 2015 and 2018. Moreover, by using smoking intensity from GATS, the cigarette consumption is higher making the estimates for cigarette gap more conservative because of the higher estimate of 11 instead of 10 from NNHeS. This is because self-reported cigarette consumption surveys are known to be usually under-reported.24
The data on tax removals from 1998 through 2018 were obtained from the Bureau of Internal Revenue (BIR) through the Department of Finance. The tax removals represent the cigarette volume sold on the domestic market, both locally produced and imported, and subject to an excise tax. The removals exclude cigarettes exported from the Philippines.16
The size of the adult population by age groups was sourced from the Population Census in 2000, 2007, 2010 and 2015.25–28
Methods
The gap analysis method is based on comparison of legal sales and self-reported cigarette consumption estimated from surveys.19 It is expressed as:

Legal sale refers to all legally sold cigarettes taxed by the government and cigarette consumption is the annual consumption of cigarettes by the adult population in the Philippines. Cigarette consumption is calculated as the product of the adult population, adult smoking prevalence and smoking intensity (average cigarettes per day per smoker) in 365 days.
The cigarette consumption is then multiplied by an ‘uplift factor’ to account for the secular difference between official sales and self-reported consumption19 and the exclusion of cigarettes consumed by those under 20 years old from the consumption estimates. This results in adjusted cigarette consumption.
The year 1998 was selected for the calculation of the uplift factor, because this is the earliest year where all data are available in our time series. We calculate the uplift factor as:

We assume that in 1998, the illicit cigarette market represented 16% of total consumption based on a Euromonitor estimate.29 Meanwhile, the remaining 84% constitutes the removals recorded in the same year from the data of BIR. We also assume that the under-reporting of smoking has not changed since 1998.
Results
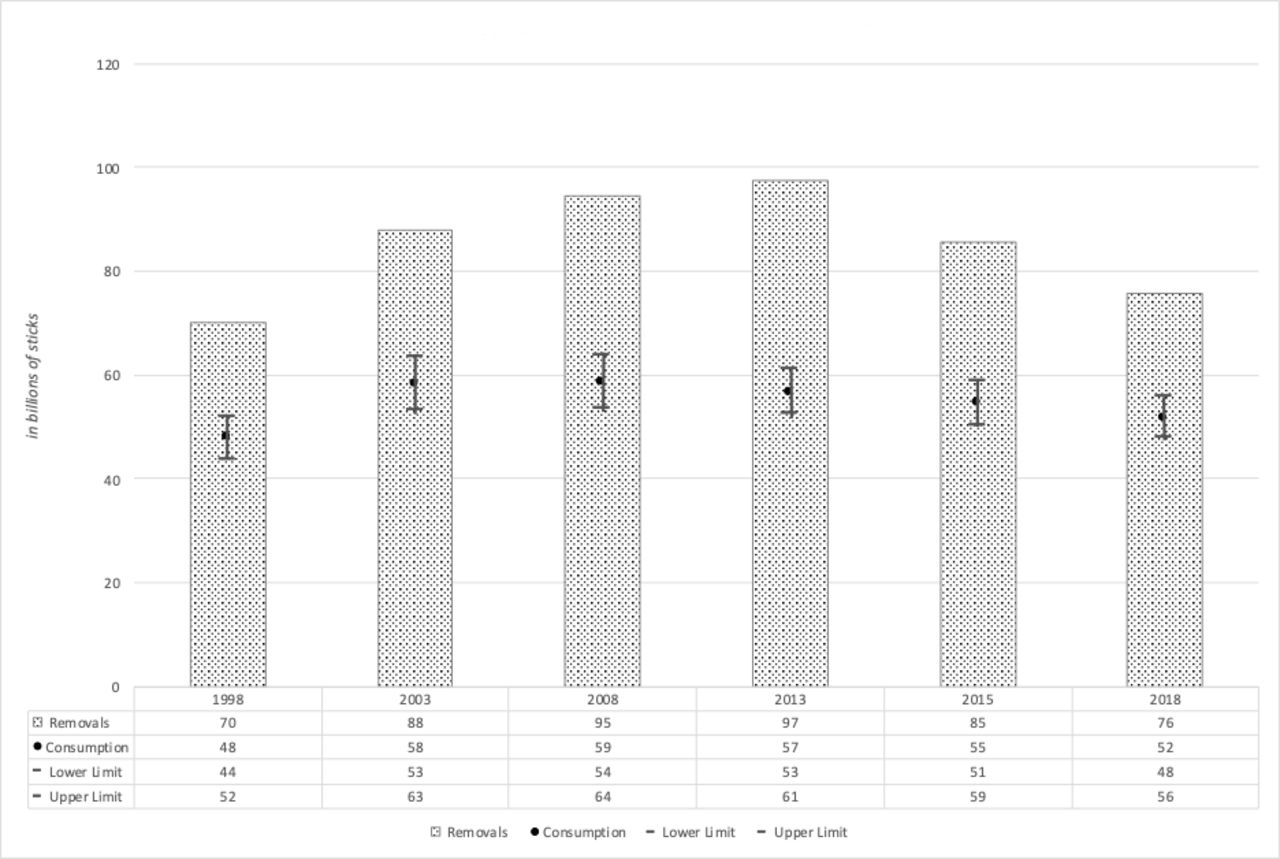
Figure 1 compares cigarette legal sales and the estimated cigarette consumption from 1998 to 2018 in the Philippines. The legal sales initially increased from 70 billion sticks in 1998 to its peak in 2013 with 97 billion sticks, even though the 2013 data were affected by the industry stockpiling cigarettes before the expected tax increase in 2014.30 Meanwhile, the calculated annual consumption was always substantially lower than the reported legal sales, possibly the result of under-reporting of cigarette consumption in the surveys, missing youth and tourist consumption, and other factors such as imprecise population size. After the implementation of the Sin Tax Law, both legal sales and self-reported consumption declined from 2013 to 2018 by 22.19% and 8.82%, respectively.

Cigarette legal sales and cigarette consumption.
Figure 2 depicts the adjusted cigarette consumption using the calculated uplift factor of 1.74. Now, the cigarette consumption is somewhat higher than the legal sales and the gap represents the size of the illicit market.

Cigarette legal sales and adjusted cigarette consumption.
Using the adjusted consumption figure, we estimate that from 1998 to 2018, about 61 billion illegal cigarette sticks were available and sold in the Philippines, an average of 10 billion sticks annually or 10.7% of the average total cigarette market. The highest volume of illicit sticks can be observed in 2018 with 14.5 billion sticks or 16.1% of the year’s total market, while the lowest volume of illicit sticks was in 2013 with 1.6 billion sticks equivalent to 1.66% of 2013’s total market. Taking the upper and lower bound of the consumption estimates into consideration, the share of illegal cigarette market ranges from 0% in 2008 and 2013 to 24.8% in 1998. However, the differences in estimate across years could also be attributable to the industry’s varying degrees of stockpiling.
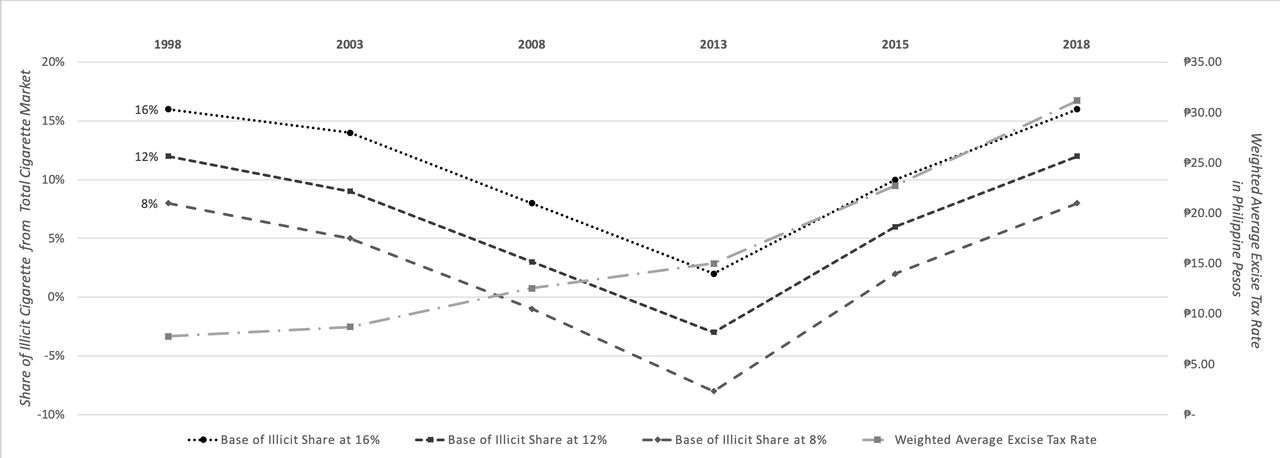
Given existing evidence that the industry-funded studies exaggerate the size of illicit trade,31 32 we performed a sensitivity analysis lowering the Euromonitor estimate29 by 25% and 50%, respectively (figure 3). According to the lower bound estimates, the illicit cigarette market in the Philippines was negligible in 2008, 2013 and 2015 and it only reached 8.7% in 2018. Figure 3 also shows the relationship between the estimated illicit cigarette market shares shown on the left axis and the weighted average excise tax rate on the right axis. The illicit cigarette market share dropped by a whopping 42% from 2003 to 2008 and continued to decrease an additional 79% from 2008 to 2013. By 2018, the share of illicit cigarette market had increased again to a prevalence comparable with its 1998 level, even though the tax rate more than tripled in real values during that time (from ₱0.77–₱8.92 ($0.019–$0.2233) in 1998 to ₱31.2 ($0.5934) in 2018). This clearly demonstrates a limited relationship between the size of the illicit cigarette market and the tax rates in the Philippines.

Discussion
There is limited knowledge about the extent of illicit tobacco trade in the Philippines. This study estimates the trend in the illicit cigarette market using gap analysis and compares it with the evolution of the excise tax rate from 1998 to 2018. We estimate that illegal products accounted for about 16% of the cigarette market in 2018, an estimate comparable to the situation 20 years ago and before the 2013 tax reform.
The observed decline in the illicit cigarette market from 2003 to 2008 may have been influenced by tobacco control legislation that, among other provisions, regulated packaging and labelling of tobacco products, making it more difficult for illegal cigarettes to penetrate the market.35 The relatively low levels of illicit tobacco in 2013 could be attributed to the 2013 Sin Tax Law that led to a substantial increase in tobacco excise taxes in 2014, especially for lower-priced cigarettes. This motivated the industry to prepay taxes and remove cigarettes from warehouses in 2013, selling them in 2014. This artificially increased legal sales in 2013 and decreased them in 2014. By 2015, the illicit cigarette market returned to its 2008 levels.
In an attempt to control the illicit cigarette market, the BIR implemented the Internal Revenue Stamp Integrated System (IRSIS) in 2014, requiring the affixtures of tax stamps on all cigarette packs sold in the Philippines. Each stamp costs ₱0.15 ($0.0030) and is paid by the cigarette manufacturer.36 The IRSIS allows for real-time monitoring of tax stamp orders and their distribution. The stamps serve as visual proof for paid taxes, have multilayered security features and carry an IRSIS-generated unique identification code and a quick identification reference code.36 As of 2016, the tax stamps may be checked by consumers through a stamp verification app to verify their authenticity.37 However, no centralised track-and-trace mechanism has been implemented in the Philippines as yet.38
The increase in illicit cigarette trade from 2015 to 2018 could be linked to the efforts of the TI to circumvent higher tobacco tax and IRSIS. In 2017, for example, the Mighty Corporation was charged with tax evasion for applying counterfeit tax stamps and had to pay a ₱30 billion fine for this offence.39 In 2018, BIR incinerated almost 230 000 mastercases, or 115 million cigarette packs, belonging to Mighty.40 In addition, a new scheme where smokers were asked to recycle tax stamps in exchange for food was discovered in 2019.41 42
Our estimates of the size of the illicit cigarette market are subject to the limitations of the gap method. First, the method cannot distinguish between tax evasion and tax avoidance and between types of tax evasion (eg, smuggled vs counterfeit products). Second, the method is better at estimating trends over time than accurately estimating the scope of the illicit market. Moreover, the method cannot detect hotspots for illicit cigarettes, such as free trade zones and port areas. Third, we relied on available data for legal sales and survey data for consumption estimates. Relevant surveys are conducted only every 3–5 years, however, and do not capture subjects below 20 years of age despite 18 being the legal age of tobacco purchase in the Philippines. Additionally, if the adult smoking intensity of NNHeS 2015 is applied, cigarette gaps for 2013, 2015 and 2018 would be significantly lower and the illicit market share would reduce further to −8%, 1% and 7% respectively. These estimates are lower than using GATS smoking intensity data.
Given these limitations, future studies should apply alternative methods to cross-verify our estimates. For example, direct observation of packs consumed by smokers would not only provide an estimate of the size of the illicit cigarette market, but also capture additional information such as the location where illegal cigarettes are usually obtained, the names and prices of illicit brands.
Conclusion
We found that—while the size of the illicit cigarette market has fluctuated over the last 20 years—there is no evidence of a direct relationship between tobacco taxes and tax evasion/avoidance in the Philippines.
Researchers should continue monitoring the trend in the gap between tobacco consumption and legal sales because it is an inexpensive way to evaluate the impact of enforcement measures designed to control illicit trade. While monitoring of the illicit market requires consistent and frequent data collection on smoking prevalence and smoking intensity, such data can help inform reforms that will strengthen the country’s capacity to prevent and combat illicit tobacco trade.
Data availability statement
Data are available in a public, open access repository. All data relevant to the study are included in the article or uploaded as supplementary information. Data used for the study are secondary data which were obtained and publicly available from Global Adult Tobacco Survey, National Nutrition and Health Survey, Bureau of Internal Revenue and the Population Census of the Philippine Statistics Authority.
Ethics statements
Patient consent for publication
Footnotes
Contributors MPL and AF conceived of the study’s design and wrote the initial draft of the manuscript. MPL prepared the data and performed the data analysis and interpretation and is the ultimate guarantor of the content. HR and ND helped design the data analysis and aided in the data interpretation. All authors edited and prepared the final manuscript.
Funding This work was carried out with the financial support from Cancer Research UK and Canada’s International Development Research Centre.
Disclaimer The views expressed herein do not necessarily represent those of International Development Research Centre or its Board of Governors.
Competing interests None declared.
Provenance and peer review Not commissioned; externally peer reviewed.