Article Text

Abstract
Objectives This study presents an analysis of vaping products (VPs) purchased in the USA, Canada, England and Australia and assesses whether differences in regulations were associated with differences in the chemical composition of the VPs.
Methods April–September 2017, a total of 234 VP refill liquids and prefilled cartridges were purchased in convenience samples of retail locations in each country. Products were chosen from brands and styles most commonly reported by current VP users in the 2016 ITC Four Country Smoking and Vaping Survey. All products were tested for nicotine, tobacco-specific nitrosamines (TSNAs), minor tobacco alkaloids, organic acids and flavouring chemicals.
Results Consistent with the laws in Canada and Australia at the time of product purchase, nicotine was not detected in any of the VPs (n=10 in Canada; n=15 in Australia). US liquids (n=54) had a mean nicotine concentration of 16.2 mg/mL, (range=0.0–58.6) and English liquids (n=166) had a mean concentration of 11.9 mg/mL ((range=0.0–31.2) F(3244)=12.32, p<0.001). About 5% of English samples exceeded the UK’s 20 mg/mL nicotine limit. Substantial country differences were observed in levels ofTSNAs, with the USA being higher than elsewhere. Of all products tested, 18.8% contained at least one organic acid. Liquids purchased in England contained far more identifiable flavouring chemicals than those in the other countries.
Conclusions VP composition, particularly with respect to nicotine and flavouring, varies by country, likely reflecting both marketplace preferences and country-specific regulations. There are differences between nicotine levels claimed on the package and actual levels, particularly in England.
- electronic nicotine delivery devices
- nicotine
- public policy
Data availability statement
No data are available. Deideitified survey data were used for the analysis presented in this manuscript.
This is an open access article distributed in accordance with the Creative Commons Attribution Non Commercial (CC BY-NC 4.0) license, which permits others to distribute, remix, adapt, build upon this work non-commercially, and license their derivative works on different terms, provided the original work is properly cited, appropriate credit is given, any changes made indicated, and the use is non-commercial. See: http://creativecommons.org/licenses/by-nc/4.0/.
Statistics from Altmetric.com
Introduction
Use of vaping products (VPs) has increased significantly over past few years in many countries. Use of VPs varies by age, and in the USA and Canada, vaping has become more popular among teens than cigarette smoking.1 Given patterns of use, countries have taken different approaches to nicotine VPs. In Australia, nicotine VPs are considered unauthorised medicines and cannot be legally sold, although VPs without nicotine can be sold in some states. Canada also banned nicotine VPs but then legalised them in May 2018. In the UK, a comprehensive regulatory regimen was implemented in 2016 with a transition period until May 2017, in line with the broader European Union (EU) Tobacco Products Directive (TPD), which requires manufacturer notification prior to introduction of nicotine-containing products, standards for health warnings and packaging, including a maximum nicotine concentration (20 mg/mL), tank capacity (2 mL) and refill bottle size (10 mL). Additionally, UK law, the TPD and other EU regulations prohibit certain flavouring chemicals and additives, including vitamins, caffeine, taurine, diacetyl, 2,3-pentanedione and ethylene glycol.2 Products not containing nicotine are not subject to these regulations in the UK. In the USA, VPs were initially regulated by Food and Drug Administration (FDA) as unapproved drug delivery devices, but this was blocked by legal action. Nicotine VPs were incorporated into the tobacco regulatory system via the ‘deeming’ regulation in August 2016. This included mandated warnings about nicotine content but did not remove any products from the market or set manufacturing and product performance standards.3
Most VPs consumed contain nicotine and are used by cigarette smokers to cut back or stop smoking.4 Nicotine is a pharmacologically active compound which can create and sustain dependence in those using tobacco products. In most nicotine liquids used in VPs, the nicotine is derived from tobacco, providing an exposure route for tobacco-specific toxicants (eg, tobacco-specific nitrosamines (TSNAs) -- N’-nitrosonornicotine (NNN), 4-(Methylnitrosamino)−1-(3-pyridyl)−1-butanone (NNK), N’-nitrosoanabasine (NAB) and N’-nitrosoanatabine (NAT)), as well as minor tobacco alkaloids (nornicotine, anatabine, anabasine). Tobacco-flavoured liquids may also contain extracts of cured tobacco leaves, commonly called Natural Extract of Tobacco liquids,5 and these may also be contaminated with TSNAs. At the same time, evidence suggests that carcinogenic chemicals are found in lower concentrations in VP aerosols compared with the smoke from cigarettes, and use of nicotine containing VPs is substantially less harmful compared with smoking cigarettes.6–8 Recently, VPs that contain organic acids have gained popularity among users, particularly in the USA, where JUUL dominates the market. The addition of organic acids to vaping liquids creates nicotine salts, which decreases the harshness of inhaling nicotine into the airways,9 thereby facilitating more rapid uptake of unprotonated nicotine in the body.10 Less harsh aerosol also enables the use of higher nicotine concentrations when paired with lower heating temperatures.
Health risks from inhaling aerosols from VPs are likely to depend on the type of products used and patterns of use. The acute and chronic inhalation effects of propylene glycol and vegetable glycerin, two primary solvents of nicotine used in VPs, have not been well studied, although it is known that prolonged exposure can result in chronic irritation of the airways.1 Flavouring agents found in VPs are commonly used in foods and indoor fragrances, but little is known about the effects of chronic inhalation at the levels that can be produced by VPs.1 4 Many companies use ingredients that are commonly used as food additives and are classified as Generally Regarded as Safe by regulatory agencies, although that designation only applies when ingested, not when inhaled. England has banned certain flavourings such as diacetyl, where concerns about harms have been raised, and at least some manufacturers have voluntarily stopped using it in other jurisdictions. Other flavouring chemicals are less well understood in the inhalation context. Some flavourings, such as benzaldehyde11 and cinnamaldehyde,12 appear to have negative respiratory health effects at the concentrations used in VPs, although their presence in e-liquids is less common than other flavours.13 14 Glycols15 and acetals16 formed as reaction products of flavourings with other components of the mixture have been identified in some samples of e-liquids and their associated aerosols. Although some harmful chemicals (particularly aldehydes) may be generated during a product’s use,17–19 others could be present because of poor quality control over the manufacturing process (eg, use of poorly purified nicotine, use20 of flavouring chemicals of unknown quality and stabilisers).21
While a number of previous studies have reported on VP contents and emissions, few studies have compared popular VPs across countries having different regulatory environments. The study was undertaken to determine if differences in regulatory regimes for VP across countries were reflected in the characteristics of VPs themselves (nicotine, minor tobacco alkaloids, TSNAs, selected organic acids and flavourings) in Australia, Canada, England and USA. These analytes were selected to explore the complexity of liquid composition and highlight areas where impurities might be introduced, and focuses on the contents of the unheated liquids used in the products, whether contained in cartridges/pods or as refill liquid. We hypothesised that products from countries with stricter regulation towards VPs would have laboratory-measured nicotine concentrations that more closely match the labelled concentration, and have lower levels of contaminants (minor alkaloids, TSNAs), and flavourings that have been shown to have significant inhalation toxicity.
Methods
Acquisition of VPs
Between April and September of 2017, VP liquids and refills were purchased in a convenience sample of retail locations in and around Charleston, South Carolina, USA; Waterloo, Ontario, Canada; Melbourne, VIC, Australia; and London, England, UK (see online supplemental material 1). Products were chosen from brands and styles most commonly reported by current VP users in each country in wave 1 of the ITC Four Country Smoking and Vaping Survey (ITC4CV).22 Methodological details for each country are available in Thompson et al23 and via the ITC website (http://www.itcproject.org/methods).
Supplemental material
We characterised a selection of brands (for closed systems) or types (for open systems) reported by 2143 participants who indicated that they were current daily, weekly or monthly VP users at the time of the survey. After this initial level of product identification, we selected brands in the market that were available in multiple flavours and nicotine levels to allow for intrabrand comparisons. Tobacco, menthol and cherry (as a representative fruit) flavours were selected as these were reported to be the most commonly reported flavours and were offered by many manufacturers.22 Labelled nicotine concentrations of 0.5–20 mg/mL and (in USA) >20 mg/mL were targeted to cover a range of commonly reported values, which also allowed us to evaluate the level of compliance in England with the EU TPD limit of 20 mg/mL nicotine. In total, 245 liquids were purchased across the four sites (166 in England, 54 in the USA, 15 in Australia and 10 in Canada). While the number of products purchased in Australia and Canada was small, the variety of products available for purchase in Australia and Canada were reflective of the marketplace at the time of purchase.
Measurement of nicotine concentration
Samples were analysed at the Nicotine and Tobacco Product Assessment Resource (NicoTAR) in Roswell Park Comprehensive Cancer Center, Buffalo, New York, USA. After arrival at the laboratory, each product was catalogued and assigned a unique sample number. All samples were stored in their original containers in a dark space at 4°C prior to analysis, in order to minimise the risk of compound degradation. Aliquots of 10 µL of each product were collected from each original container using the reverse pipetting technique and transferred to chromatography vials prefilled with 1 mL of HPLC-grade methanol (Fisher Scientific, Hampton, New Hampshire, USA) and 100 µL internal standard solution (1 mg/mL of quinoline (Acros Organics, Hampton, New Hampshire, USA) in methanol). Analyses were performed using gas chromatography (GC) with nitrogen-phosphorous detector (Agilent, Santa Clara, California, USA) using a modified National Institute for Occupational Safety and Health (NIOSH) 2551 method for determination of nicotine in air (1998). The limit of quantitation (LOQ) was 1.0 mg/mL. Recovery, STDEV, SEM and percentage of relative standard deviation (RSD) were calculated for all calibrators and QC’s. Any calibrator or QC that was outside 20% recovery was excluded from the calibration curve for the samples. The recovery range was between 80.0%–114.9% for all runs, the STDEV range was between 0.1 and 4.9 mg/mL, the SEM Range was between 0.0 and 1.6 mg/mL and the percentage of RSD was between 1.0% and 20.5% for interday runs.
Analysis of TSNAs (NNN, NNK, NAT, NAB)
Aliquots of 25 µL of each product were transferred to vials containing 2.5 mL of 100 mM ammonium acetate (Fisher Scientific) and 50 µL of mixed internal standard solution (100 ng/mL of deuterated NNN, NNK, NAT and NAB (Toronto Research Chemical, Toronto, Ontario, Canada) in methanol). Analysis was performed by UPLC-MS/MS on a Waters Acquity UPLC-Xevo TQ-S (BEH C18 column) operating in positive ESI mode with 10 mM ammonium formate in water (Fisher Scientific) and methanol in 1% acetic acid (Fisher Scientific) serving as the mobile phases. LOQs were 1.0 ng/mL for NNK and 0.5 ng/mL for NNN, NAT and NAB. Recovery, STDEV SEM and percentage of RSD were calculated for all calibrators and QC’s. Any calibrator or QC that was outside 20% recovery was excluded from the calibration curve for the samples. The recovery range was between 81.0% and 120.0% for all runs, the STDEV range was between 0.0 and 15.1 ng/mL, the SEM Range was between 0.0 and 7.6 ng/mL and the percentage of RSD was between 0.6% and 31.7% for interday runs.
Identification of flavourings, selected organic acids and tobacco minor alkaloids
Aliquots of 10 µL of each product were collected from each original container using the reverse pipetting technique and transferred to chromatography vials prefilled with 1 mL of HPLC grade dichloromethane (Fisher Scientific). Analyses were performed using GC mass spectrometry (GC-MS, Agilent) using a modification of the NIOSH 2551 method for determination of nicotine in air (1998). Scan data were then matched against both the National Institute of Standards and Technology and Flavour and Fragrance (FFSCN3) databases to identify the total number of chemicals, as well as known flavouring or fragrance chemicals. Match factors >70% on 2/3 replicate runs were retained and reported. This same process was used to identify the presence of organic acids (benzoic acid, levulinic acid, salicylic acid) and minor tobacco alkaloids (myosmine, nicotine oxide, anatabine, anabasine, nicotyrine).
Measurement of liquid pH
A 500 µL aliquot of each refill liquid was collected, diluted with 5 mL Milli-Q water, vortexed for 5 min using a VWR VX-2500 multivortex, sonicated for 5 min using a VWR 75D ultrasonic cleaner, allowed to return to room temp over 15 min, then pH and temperature was measured using a Mettler Toledo SevenCompact pH metre. Measurements were read in triplicate and the average pH value was reported.
Data analysis
All analyses were performed using SPSS V.21.0. Analysis of variance (ANOVA) was used to compare mean compound concentrations between countries in the VPs purchased and by labelled nicotine value (presence or absence). Because none of the samples purchased in Australia or Canada contained nicotine, comparisons were limited to samples purchased in England and the USA. Values below the limits of quantification were replaced with LOQ/sqrt(2). Flavourings are reported descriptively as their concentrations were not calculated. The number of flavouring chemicals identified was used as the dependent variable in this case.
Results
Nicotine concentration in VPs
Comparing the mean concentration of nicotine in liquid solutions purchased at retail locations in these four countries, we found the liquids purchased in Canada (n=10) and Australia (n=15) did not contain any measurable nicotine, whereas liquids purchased in the USA (n=54) had a mean nicotine concentration of 16.2 mg/mL (95% CI 12.2 to 20.3) and in England the liquids purchased (n=166) had a mean concentration of 11.9 mg/mL (95% CI 10.9 to 12.9) (F(3,244)=19.29, p<0.001). In England, 7.8% (n=13) and in the USA, 16.7% (n=9) contained no detectable nicotine (table 1).
Mean nicotine concentration in sampled products by country and nicotine labelling
Nicotine labelling consistency and compliance
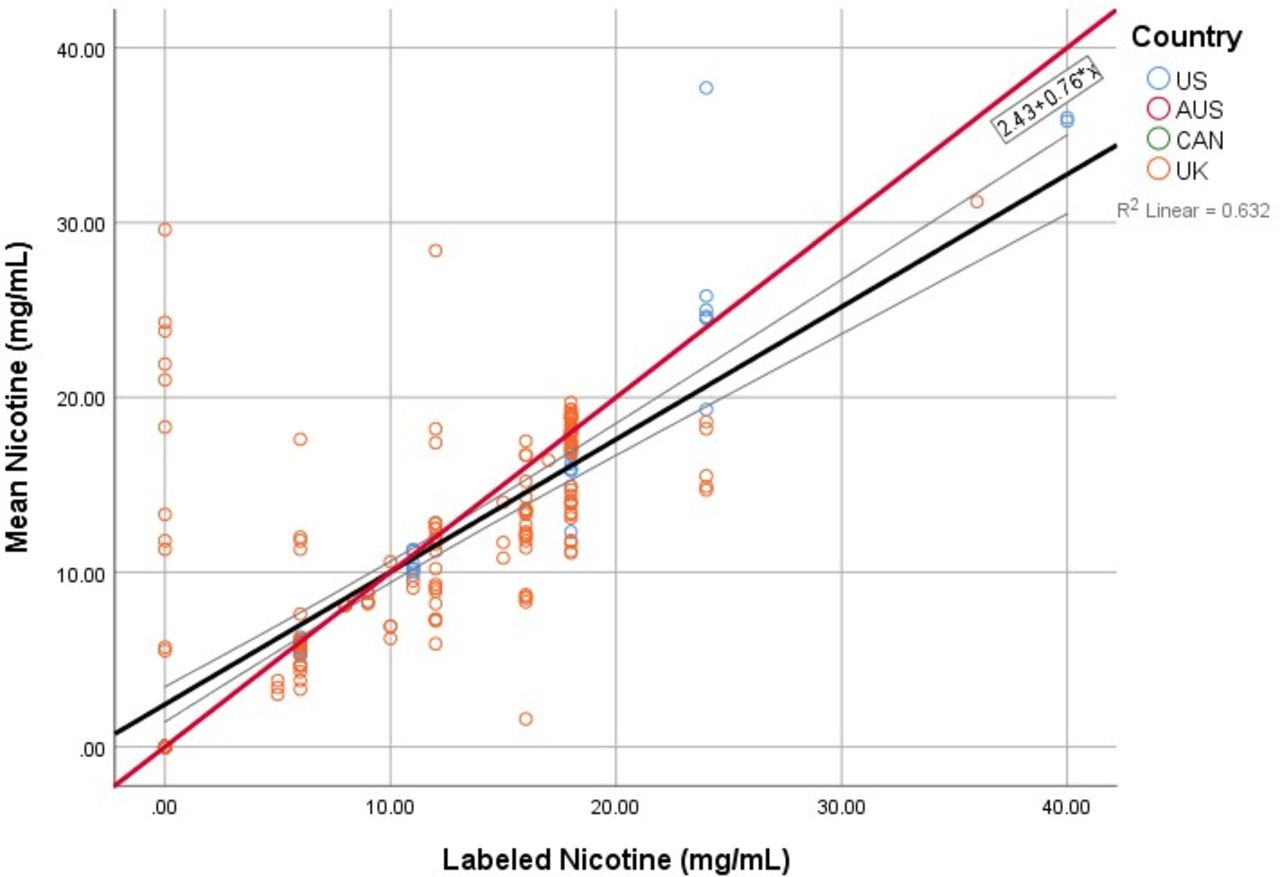
Overall, the correspondence between indicated and measured nicotine was 0.80 (Spearman’s Correlation, p=0.01, figure 1). Of 245 analysable samples, eight (six from the USA; two from England) had no nicotine value listed anywhere on the packaging (mean=42.23; range=22.1–58.6). Overall, 11 samples, all of which were purchased in England, had a labelled nicotine value of ‘0’ but had nicotine values greater than 0 (mean=16.95, range=5.5–29.6). Among US samples, nicotine was not detected in any of the products with no outward indication of the presence of nicotine, while those products indicating the presence of nicotine had a mean nicotine concentration of 15.27 mg/mL (F (1,46)=27.03, p<0.001). Among English samples, the products that did not indicate the presence of nicotine had mean concentration of 7.78 mg/mL, while samples that did indicate the presence of nicotine had a mean nicotine concentration of 12.34 mg/mL (F (1,162)=11.51, p<0.001). Of the 54 liquids tested in the USA (where there is no legal limit), 14 (25.9%) had a measured nicotine level greater than 20 mg/mL. Of the 166 liquids tested in England, nine (5.4%) had a measured nicotine level greater than 20 mg/mL, above the legal limit allowed.

Mean measured nicotine versus labelled nicotine level note: the solid red line is a reference line through 0 (perfect correspondence). The black line is the regression fit with 95% CI band (grey lines).
Among the 237 samples labelled with a nicotine value, we examined the relative differences between the labelled nicotine concentration and the laboratory analysed mean nicotine concentration, using a threshold of 20% less or greater than the labelled value for each sample, a common threshold in pharmaceuticals to distinguish trivial deviations from potentially impactful mislabelling. Overall, 165 of the samples (69.6%), were within 20% of the labelled value; 52 samples (21.2%), had detectable mean nicotine concentrations that were more than 20% less than the labelled value; 20 samples (8.4%), had detectable mean nicotine concentrations that were greater than 20% more than the labelled value. In terms of differences across countries, all samples purchased in Canada (n=10) and Australia (n=15) were labelled with a nicotine value of ‘0’ and had no detectable nicotine present. Among 48 samples purchased in the USA, 46 (95.8%) had detectable mean concentrations within 20% of the labelled value, while one sample was more than 20% below and one sample was greater than 20% above the labelled value. Among 164 samples purchased in England, 94 (57.3%) had detectable mean values within 20% of the labelled value, while 51 (31.1%) were below and 19 (11.6%) were above the labelled value by >20%, respectively. Because the samples purchased in Canada and Australia did not contain nicotine, χ2 tests were used to compare US and English samples (χ2=24.6, p<0.001). In an ANOVA analysing the labelled nicotine concentration in samples characterised as within 20%,>20% below and >20% above the labelled value, the mean labelled value was higher in samples where the tested nicotine value >20% less than the labelled value (14.37; 95% CI 12.88 to 15.85) when compared with samples where the tested value was within 20% of the labelled value (10.42; 90% CI 9.11 to 11.74) and or >20% above the labelled value (4.5; 95% CI 1.50 to 7.50) (F(2,236)=12.12, p<0.001).
Levels of TSNAs
There were substantial differences across countries in the presence of nitrosamines in refill e-liquids and cartridges (table 2). NNN and NNK were most commonly detected in US products. However, despite containing no nicotine, all 15 samples from Australia and 10 from Canada contained quantifiable levels of NNK, NAT and NAB. We found that the concentrations of NNN, NAT and NAB were statistically significantly higher in the US e-liquids tested when compared across countries. As shown in table 3, there was a trend, although not statistically significant) for products without detectable nicotine to have lower mean levels of NNN, NNK, NAT and NAB. When compared with other flavours (table 3), tobacco-flavoured products had significantly higher levels of NAT (11.8 vs 2.4, p<0.001) and higher, yet not statistically significant values of NNN, NNK and NAB. A few products were identified as significant outliers. Vuse menthol (purchased in USA) had NNN and NNK levels an order of magnitude higher than other products.
Mean comparisons of NNN, NNK, NAT and NAB levels in 227 VP samples by country
Comparison of mean NNN, NNK, NAT and NAB levels in 226 VP samples by nicotine concentration and by flavouring type (tobacco vs others)
Flavourings
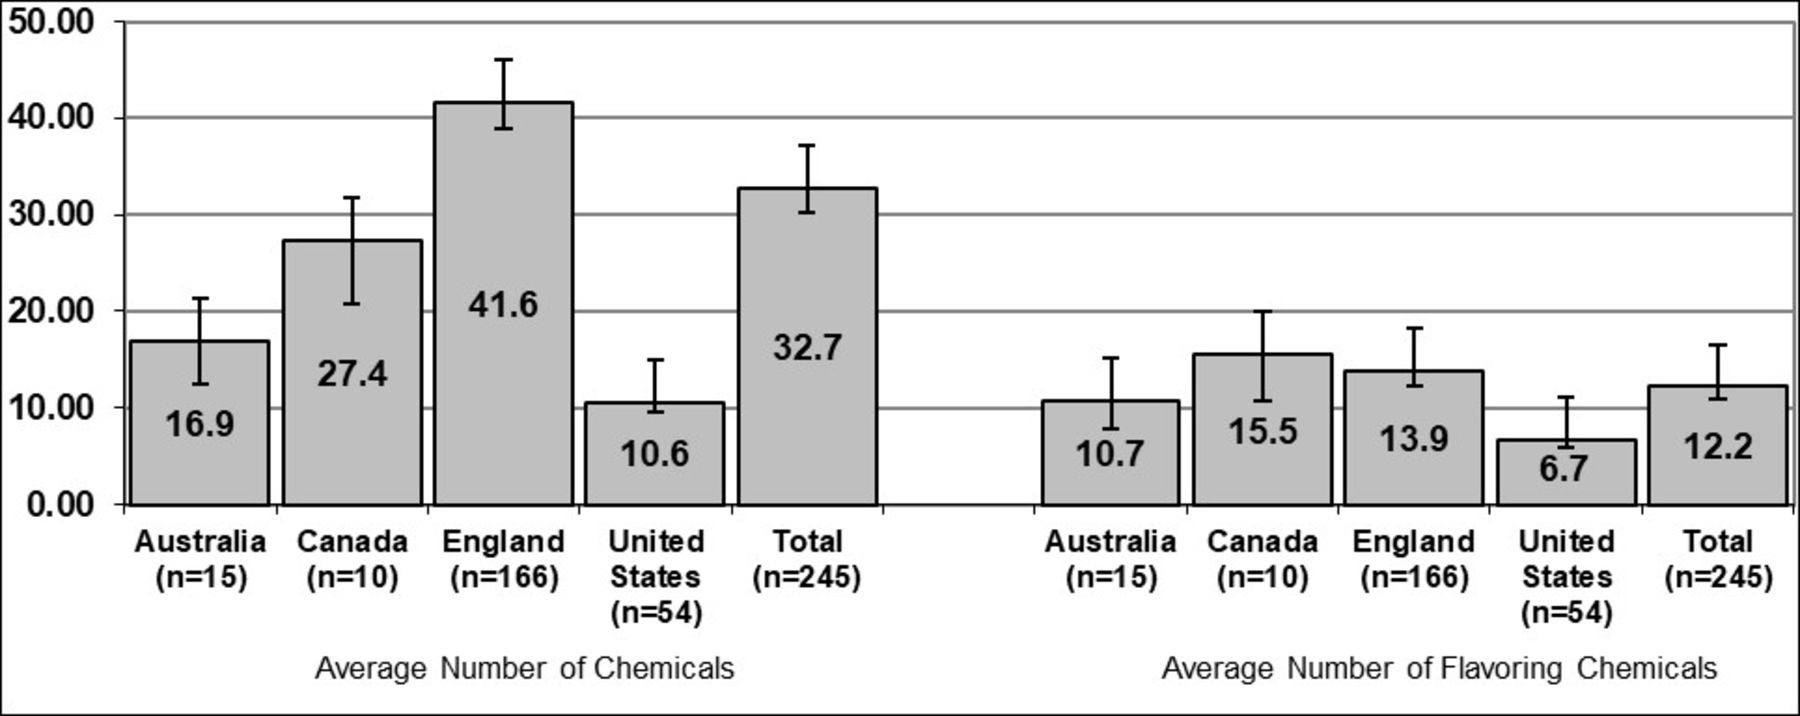
With respect to liquid contents, because a quantitative analysis was not performed, we compared countries and product types on how many chemicals were identified as present. This was found to vary substantially across products and across countries. Liquids and refills purchased in England contained far more identifiable chemicals than those in other countries (figure 2). Liquids purchased in the USA contained the fewest number of flavourings (figure 2). Table 4 presents mean chemicals and flavourings in liquids by presence of nicotine and tobacco flavour, while table 5 (see online supplemental material 1) provides examples of the most commonly found chemicals identified across brands in each country.
Average number of chemicals and flavouring chemicals detected in sampled products by country. Average number of chemicals: F(3,241)=61.37, p<0.001 average number of flavouring chemicals: F(3,241)=8.27, p<0.001 significant differences (p<0.001) were observed between the average number of chemicals in samples purchased the USA and England and between the average number of chemicals in samples purchased in Australia and England (Bonferroni comparison) significant differences (p<0.001) were observed between the average number of flavouring chemicals in samples purchased in the USA and England (Bonferroni comparison).
Mean chemicals and flavourings detected by nicotine and tobacco flavour presence
Mean pH in products purchased in England and the USA
Tobacco minor alkaloids
Approximately half the samples contained minor tobacco alkaloids nicotyrine (55.9%) and/or myosmine (44.5%). Anatabine, anabasine and nicotine oxide were not identified in any samples across all countries.
Organic acids and pH
Finally, we examined the pH of the refill liquids and cartridge contents, and the presence of any organic acids that might be employed to change the pH (ie, use of nicotine salts). Because pH is particularly relevant for nicotine delivery and none of the samples purchased in Australia and Canada contained nicotine, analyses were restricted to samples purchased in England and the USA. In samples purchased in both countries, mean pH levels (overall and within each country) were higher in samples where nicotine was detected, compared with those samples where no nicotine was detected. Overall, no significant differences between mean pH levels in samples where organic acids were present, compared with those without organic acids, though mean pH was higher in products with no organic acids present. In products purchased in England, those with no organic acids detected had a mean pH of 8.5, compared with a mean of 7.6 in samples with organic acids present (p<0.001). The inverse of this relationship was observed in samples purchased in the USA (p=0.57).
Of all products tested, 45 (18.4%) samples contained at least one organic acid, with benzoic acid being most common (11.8%). Only 6% contained levulinic acid, and no salicylic acid was detected in any of the samples analysed. Significant differences across country with 25.0% of England samples containing at least one organic acid, compared with 10.0% in Canada, 3.7% in the USA and 6.7% in Australia (χ2=14.63, p=0.002).
Discussion
The current study provides a cross-country characterisation of vaping liquids matched on nominal nicotine and flavour. Consistent with the laws in Canada and Australia at the time of sample collection, none of the e-liquids purchased in Canada (n=10) or Australia (n=15) contained nicotine, whereas US liquids (n=54) had a mean nicotine concentration of 16.2 mg/mL and England liquids (n=166) had a mean concentration of 11.9 mg/mL (F(3,244)=19.21, p<0.001). By contrast, in the USA and England the levels of nicotine in e-liquids tested were substantially higher and were generally labelled accurately.
A qualitative analysis of flavouring chemicals as a potential indicator of product complexity and response to regulatory demands found that e-liquids and refills purchased in England contained far more identifiable additives than those in the other countries. US liquids contained the fewest number of chemicals. This is in spite of the fact that the range of product flavour labels (ie, tobacco, menthol, cherry) was largely overlapping. It is unclear to us why the e-liquids in England contained more chemicals. It is possible that it derives from the mandate in EN that nicotine-containing VP additives adhere to food standards, where constituents at levels above 0.1% are reportable on the label, whereas those less than 0.1% are considered confidential or trade secret. Manufacturers of e-liquids may use lower concentrations of a greater number of components in order to keep their formulations secret in the UK. In the USA, there is no such threshold, and thus manufacturers may simplify their formulations. The observation of numerous flavour chemicals in e-liquids also speaks to the importance of distinguishing a product’s overall ‘flavour’ as a label descriptor from the presence or absence of actual flavouring chemicals. Multiple chemicals or combinations of chemicals may be used to achieve the same experienced flavour. Although this study examines the number of flavourings present as a potential indicator of the complexity of a product, there is some evidence suggesting the number of flavourings present in VPs can be harmful at a cellular level. In a study comparing the cytotoxicity of VP refill liquids using embryonic and adult cells, cytotoxicity was found to be correlated with the number of and concentration of flavouring chemicals.24Another study, using GC-MS, found that the more flavouring chemicals in a VP liquid, the more it was likely the liquid was to be toxic25
We found detectable levels of TSNAs in VPs in all four countries, with levels substantially higher and more varied in the USA. Substantial differences were observed in levels of NNN, NNK and NAT, with the USA being higher than England. Though not significant, there was a trend toward tobacco-flavoured products containing higher levels of nitrosamines, and also for nicotine-free VP to contain lower levels of nitrosamines. One would expect that nicotine-free VPs should not contain nitrosamines, and yet some did, which may indicate poor quality control and constitutes a potential target for better regulation and enforcement of good manufacturing product standards. For many of these chemicals, the levels produced under normal vaping are often well below levels seen in cigarette smoke, so that an immediate focus should be on those e-liquids where high levels can be achieved within the range of normal vaping patterns. Combined, these findings may point to the use of lower-purity sources of nicotine, and/or contamination of tobacco-derived flavourings by nitrosamines during extraction or concentration.
Interestingly, in this convenience sample of purchased e-liquids in 2017, we found about 19% of products contained organic salts, with benzoic acid being the most common (11% of products). Salt-based formulations with higher pH became much more widespread in 2018, suggesting that our purchases may have picked up on the early emergence of a novel formulation. This demonstrates the value of ongoing market surveillance since it is important to have an understanding of how products may be changing over time in order to assess changes in patterns of product use.
This study sought to examine only a subset of products selected based on self-reports of preference among ITC survey participants. As such, the results from this study should not be taken as comprehensive assessment of the marketplace of e-liquids. While the products were stored under standardised conditions once acquired by our investigators, we do not know the provenance of the products prior to purchase, such as how long they were on the shelf or what environmental conditions they had experienced prior to our purchasing them. Without a manufacture date or known gap to ‘best before’ date, and of how it is kept prior to receipt at our lab, the level of breakdown of the components present at the time of manufacture cannot be estimated. However, the storage of products used by vapers would be similar.
The regulatory environment in the USA has evolved since the time of data collection. Youth use of VPs, including JUUL, grew dramatically from 2017 to 2019. In 2019, pursuant to a court order, the compliance dates for VPs to meet FDA’s testing, reporting, and premarket authorisation requirements26 were moved forward from 2022 to 2020.27 Finally, we had limited samples from Canada and Australia. The sample of brands purchased in Canada (and in Australia) reflected only the stores from which products were purchased and not the overall market, in which products are obtained from the internet.28 In addition, since 2017, the market has changed in Canada with formal legalisation of retail sales of e-liquids, while in Australia restrictions on the sale of vaping devices and e-liquids have remained and in two states (Queensland and Western Australia) have become even more stringent with complete bans on the sale of VPs products. Despite these changes, we have continued to acquire the most popular VPs reportedly used in each country so that we can continue to track the evolution of VPs.
Conclusions
The current study provides a descriptive comparison of the content of e-liquids selected initially on the basis of popularity with vapers purchased in countries with different regulations. Not surprisingly in the two countries where the sale of nicotine was not allowed at the time of purchase, none of the products tested had nicotine in them. VP composition, particularly with respect to nicotine and flavouring content, varies by country, indicating both marketplace preferences and potential regulatory influence. Future research should continue to elucidate cross-country differences in VP composition and performance as the market continues to evolve.
The current study points to a range of possibilities for the future regulation of VPs to minimise harm to users. The available evidence is consistent with TSNA being extremely potent carcinogens. As this study has shown, two contamination pathways are leading to vapers being exposed to TSNA. More stringent regulation of nicotine solutions used in vaping fluids may be the most effective means of reducing vapers’ exposures to TSNA. Regulation of permissible levels of contaminants in tobacco extracts or even prohibition of the use of tobacco extracts in vaping fluids may also be effective in reducing vapers’ exposures to TSNA. The findings also suggest the need for regularised product surveillance activities to track changes in the marketplace over time, and to identify emergent trends such as the use of organic acids, in their nascent stages. This could provide early warning as to products that could emerge as potentially problematic.
What this paper adds
A descriptive comparison of the content of e-liquids selected initially on the basis of popularity with vapers purchased in four countries with different regulations.
Composition, particularly with respect to nicotine and flavouring content, varies by country, indicating both marketplace preferences and potential regulatory influence.
Samples purchased in Canada (n=10) and Australia (n=15) were labelled with a nicotine value of ‘0’ and had no detectable nicotine present, consistent with the regulations in those two countries. Similarly, among 48 samples purchased in the USA, 46 (95.8%) had detectable mean concentrations within 20% of the labelled value. Among 164 samples purchased in England, only 94 (57.3%) had detectable mean values within 20% of the labelled value.
Data availability statement
No data are available. Deideitified survey data were used for the analysis presented in this manuscript.
Acknowledgments
We would like to thank Elle Wadsworth at KCL for buying products in England.
References
Supplementary materials
Supplementary Data
This web only file has been produced by the BMJ Publishing Group from an electronic file supplied by the author(s) and has not been edited for content.
Footnotes
Twitter @kingsNRG
Contributors All authors contributed to the analysis of the data presented in this manuscript and have also drafted and critically revised it. All authors have granted final approval for the work published in this manuscript.
Funding This study was supported by grants from the US National Cancer Institute (P01 CA200512), the Canadian Institutes of Health Research (FDN‐148477) and by the National Health and Medical Research Council of Australia (APP 1106451). GTF was supported by a Senior Investigator Award from the Ontario Institute for Cancer Research. NicoTAR shared resource is supported by grants from the National Cancer Institute (NCI) (P30CA016056), and the NCI and the Center for Tobacco Products of the Food and Drug Administration (U54CA228110).
Disclaimer The sponsors had no role in the design and conduct of the study; collection, management, analysis and interpretation of the data; preparation, review or approval of the manuscript; and decision to submit for publication. The views and opinions expressed in this letter are those of the authors and do not necessarily represent the official position of the US National Institutes of Health or the US Food and Drug Administration. Ann McNeill is a National Institute for Health Research (NIHR) Senior Investigator. The views expressed in this article are those of the authors and not necessarily those of the NIHR, or the Department of Health and Social Care.
Competing interests MC and DH have each served as paid expert witnesses in legal challenges against cigarette companies. GTF has served as a paid expert witness on behalf of governments in litigation involving the tobacco industry. MLG reports research grant from Pfizer and membership in scientific advisory board to Johnson & Johnson, outside the scope of this paper.
Provenance and peer review Not commissioned; externally peer reviewed.