


Abstract
This study reports consumer reactions to the graphic health warnings selected by the Food and Drug Administration to be placed on cigarette packs in the United States. We recruited three sets of respondents for an experimental study from a national opt-in e-mail list sample: (i) current smokers aged 25 or older, (ii) young adult smokers aged 18–24 and (iii) youth aged 13–17 who are current smokers or who may be susceptible to initiation of smoking. Participants were randomly assigned to be exposed to a pack of cigarettes with one of nine graphic health warnings or with a text-only warning statement. All three age groups had overall strong negative emotional (ß = 4.7, P < 0.001 for adults; ß = 4.6, P < 0.001 for young adults and ß = 4.0, P < 0.001 for youth) and cognitive (ß = 2.4, P < 0.001 for adults; ß = 3.0, P < 0.001 for young adults and ß = 4.6, P < 0.001 for youth) reactions to the proposed labels. The strong negative emotional and cognitive reactions following a single exposure to the graphic health warnings suggest that, with repeated exposures over time, graphic health warnings may influence smokers’ beliefs, intentions and behaviors.
Introduction
The Family Smoking Prevention and Tobacco Control Act (Public Law 111-31) enacted in 2009 granted the Food and Drug Administration (FDA) important new authority to regulate the manufacture, marketing and distribution of tobacco products to protect the public health generally and to reduce tobacco use by minors. Section 201 of the Act amends the Federal Cigarette Labeling and Advertising Act (FCLAA) (15 USC 1333) and requires the FDA to issue ‘regulations that require color graphics depicting the negative health consequences of smoking to accompany’ nine warning statements (see Supplementary Appendix Table AI for a list of all warning statements). The nine new graphic warning labels selected by the FDA must appear on at least 50% of the front and back of all cigarette packs and cartons sold in the United States. In addition, the new graphic warnings must cover at least 20% of the area of all cigarette advertisements. The new warning labels were scheduled to be implemented on packs and advertisements in September 2012. However, because of legal challenges to the warning labels by tobacco companies, the implementation of warning labels is uncertain.
Health warnings on cigarette packs and cartons can serve as an important source of information for smokers and non-smokers alike. Smokers are exposed to cigarette packs multiple times per day, which translates into potentially thousands of exposures to a health warning each year. These exposures happen at the time the smoker smokes a cigarette [1, 2].
A growing evidence base supports the use of large pictorial health warning labels over text-only warnings [3]. Countries that have implemented large pictorial warnings have reported higher levels of awareness of the labels compared with countries having smaller text-only warnings [4–7]. Adults and youth report that graphic warning labels are a credible source of information about the health risks of smoking [3]. Indeed, a number of studies provide evidence on the effectiveness of health warnings to improve understanding of the health risks of smoking [3–5]. Graphic warnings have been shown to increase smokers’ self-reports of reducing consumption, increasing their likelihood of quitting, increasing their motivation to quit and increasing the likelihood of remaining abstinent from smoking [4–6, 8, 9]. Graphic warning labels may also reduce demand for cigarettes [10], promote calls to quitlines [11–13] and prevent youth from smoking initiation [14].
Evidence suggests that graphic health warnings that elicit emotional arousal or fear are more likely to be effective than health warnings that convey information in a more emotionally neutral manner [3, 15, 16]. Empirical evidence specific to graphic health warnings is limited in terms of establishing a relationship between immediate reactions to labels (e.g. emotional, cognitive) and subsequent downstream outcomes, such as beliefs, intentions and behaviors. However, theoretical [17–19] and empirical evidence [20–22] on the impact of advertisements suggests that immediate reactions can be causal antecedents to behavior change.
The FDA developed a number of graphic health warnings that varied in style and content to depict the negative health consequences of smoking. In 2010, the FDA conducted multiple experiments using 36 graphic health warnings with members of a national Internet panel to assess the relative efficacy of those warnings at drawing attention to cigarette warnings, increasing recall of warning information, heightening awareness of the health risks of smoking and influencing behavioral intentions regarding smoking initiation and cessation. After assessing the results of the multiple experiments it conducted, the FDA selected nine graphic health warnings to be placed on cigarette packs and advertisements.
One recent study assessed participants’ self-reported perceived effectiveness of the 36 graphic health warnings developed by the FDA [23]. This study had participants rate effectiveness on a scale of 1–10 along four dimensions: increase concerns about health risks; motivate smokers to quit; prevent youth from smoking and overall effectiveness. A single scale was created by taking the mean of the scores on each dimension. In this study, a quitline number was added to the graphic health warnings. In addition, the FDA labels were compared with labels used in countries other than the United States. They found that youth and adults rated labels similarly, with youth sometimes rating them as more effective. Though most FDA-selected labels were rated as effective, labels from other countries were often rated higher. Including the quitline number as well as depiction of real people and health effects were found to increase participant’s rating of effectiveness. Another recent study [24] assessed the effect of the FDA graphic health warnings on young adults self-reported thinking about not smoking. They found that young adults exposed to the graphic health warnings were more likely to report that graphic health warnings would make them think about not smoking. This article provides additional evidence on consumer reactions to the graphic health warnings that were selected by the FDA to be placed on cigarette packs in the United States. In contrast to the study by Hammond et al. [23], this study focuses on negative emotional and cognitive reactions to the graphic health warnings. Also, rather than analyzing each label separately, in this article we analyze the set of labels for each warning statement as a group.
Methods
Study design
An experimental study was conducted across nine warning statement on cigarette packs in each of three groups of participants: (i) current smokers aged 25 or older, (ii) young adult smokers aged 18–24, and (iii) youth aged 13–17 who are either current smokers or non-smokers who may be susceptible to initiation of smoking. Adults and young adults were defined as smokers if they responded that they smoked every day or some days. Youth were defined as current smokers if they reported smoking during the past 30 days. Youth were defined as susceptible to smoking if they had not smoked in the past 30 days and answered ‘definitely yes, probably yes or probably not’ to any one of the following questions: ‘Do you think you will smoke a cigarette anytime during the next year?’; ‘Do you think you will try a cigarette soon?’; and ‘If one of your best friends offered you a cigarette, would you smoke it?’ [25] Participants were drawn from Research Now’s e-Rewards online member panel, a national opt-in e-mail list sample; 13 500 participated in the experiments.
Each participant was randomly assigned to view either one of the nine graphic health warnings or a text-only warning. Participants were exposed to either a hypothetical pack of cigarettes with a graphic warning label appearing on the top 50% of the front and back display panels or to a hypothetical pack with no warning image and just the warning statement presented in the style or format of the current standard warning (see Supplementary Appendix Table AII). Each participant viewed several screen shots of the front of the pack and could view the images for as long as desired. After being shown the cigarette pack with a graphic warning label or warning statement, participants completed a survey about their reactions to the cigarette package, related attitudes and beliefs and intentions to quit (young adults and adults) or start smoking (youth). Participants were not allowed to return to the image at any point after moving forward to the survey.
Dependent measures
Negative emotional reactions were measured by asking participants ‘How much did the pack of cigarettes make you feel’ a certain emotion using a five-point Likert Scale from ‘Completely’ (0) to ‘Not at all’ (4). Seven emotions were presented: (i) depressed, (ii) worried, (iii) guilty, (iv) discouraged, (v) disgusted, (vi) sad and (vii) uneasy. The ratings for the seven items were then summed to create a single negative emotional response scale ranging from 0 to 28.
Cognitive reactions were measured by asking participants ‘How much do you agree or disagree with each of the following statements’ using a five-point Likert Scale from ‘Strongly disagree’ (0) to ‘Strongly agree’ (4). Five statements were presented: (i) the pack is worth remembering, (ii) the pack grabbed my attention, (iii) the pack is informative, (iv) the pack is meaningful and (v) the pack is believable. The ratings for the five items were then summed to create a single cognitive response scale ranging from 0 to 20.
Beliefs about health risks to smokers were measured by asking participants ‘How likely do you think it is that a regular smoker would’ experience a specific health outcome using a five-point Likert Scale from ‘Not at all likely’ (0) to ‘Extremely likely’ (4). Five outcomes were presented: (i) get cancer, (ii) have fatal lung disease, (iii) have heart disease, (iv) have a stroke and (v) become addicted. The ratings for the five items were then summed to create a single belief about health risks to smokers scale ranging from 0 to 20.
Beliefs about health risks of secondhand smoke to non-smokers were measured by asking participants ‘How likely do you think it is that regularly breathing secondhand smoke from cigarettes would cause’ a specific health outcome using a five-point Likert Scale from ‘Not at all likely’ (0) to ‘Extremely likely’ (4). Four outcomes were presented: (i) non-smokers to get cancer, (ii) non-smokers to have fatal lung disease, (iii) non-smokers to get heart disease and (iv) children to have respiratory or breathing problems. The ratings for the four items were then summed to create single beliefs about health risks to non-smokers scale ranging from 0 to 16.
Independent measures
The key explanatory variable was an indicator for whether the participant was assigned to the treatment group (exposed to a pack of cigarettes with warning image and statement) or the control group (exposed to a pack of cigarettes with warning statement alone).
Covariates
We included as control variables age, gender, race/ethnicity, education, income and plans to quit smoking. We also included a dichotomous indicator for each of the eight warning statements to control for the statement the respondent saw. The statement ‘Cigarettes are addictive’ was the referent. Age was included as a continuous measure. Gender was included as a two-level indicator, with males serving as the referent group. Race/ethnicity was controlled for using a four-level indicator with white (non-Hispanic) as the referent along with indicators for black/African American, Hispanic and all other respondents. The highest educational attainment of respondents was dichotomized into an indicator splitting those with some college education or less and those with an undergraduate degree or more. Respondents’ annual household income was controlled for with a four-level indicator with those reporting annual income of less than $25 000 as the referent along with indicators for those earning between $25 000 and $49 999, $50 000 and $74 999 and those earning $75 000 or more. Intention to quit in the next 30 days was controlled for with a dichotomized indicator. Those reporting that they did not intend to quit in the next 30 days were coded as the referent.
Statistical analyses
To assess the impact of the set of warning images on the various dependent measures, we pooled responses across the nine warnings and used ordinary least squares (linear) regression analysis. The regression model for the adult and young adult samples controlled for exposure to a graphic health warning label, the warning statement shown, age, gender, race/ethnicity, education, income and plans to quit smoking. For analyses of the youth sample, models excluded education, income and plans to quit smoking but included an indicator for having smoked in the past 30 days.
The estimated coefficient for the variable measuring exposure to graphic health warnings in each of the models represents the effect of exposure to the warning image and statement relative to the warning statement alone (text only) on the dependent measures.
All analyses were conducted in Stata 12 (College Station, TX, USA) with robust standard errors.
Results
Descriptive
The adult sample included 4890 current adult smokers aged 25 or older, roughly evenly distributed by gender with 49.4% of the sample being male and 50.6% being female (Table I). The majority of the adult sample was white (77.9%), held at least a bachelor’s degree (53.4%), and reported annual household income of $50 000 or more (63.9%). A majority of the adult sample was not considering quitting smoking at the time of the survey (72.8%), and only 39.9% reported being somewhat or very likely to attempt to quit smoking within the 30 days post-exposure.
Sample description
| Adult | Young adult | Youth | ||||
|---|---|---|---|---|---|---|
| Variable | n | % | n | % | n | % |
| Age | ||||||
| 13–17 | — | 0.0 | — | 0.0 | 4599 | 100.0 |
| 18–24 | — | 0.0 | 4584 | 100.0 | — | 0.0 |
| 25–34 | 1559 | 31.9 | — | 0.0 | — | 0.0 |
| 35–44 | 1105 | 22.6 | — | 0.0 | — | 0.0 |
| 45–54 | 1175 | 24.0 | — | 0.0 | — | 0.0 |
| 55–64 | 814 | 16.6 | — | 0.0 | — | 0.0 |
| 65–74 | 215 | 4.4 | — | 0.0 | — | 0.0 |
| 75+ | 22 | 0.4 | — | 0.0 | — | 0.0 |
| Total | 4890 | 100.0 | 4584 | 100.0 | 4599 | 100.0 |
| Gender | ||||||
| Male | 2415 | 49.4 | 2466 | 53.8 | 2423 | 52.7 |
| Female | 2475 | 50.6 | 2118 | 46.2 | 2176 | 47.3 |
| Total | 4890 | 100.0 | 4584 | 100.0 | 4599 | 100.0 |
| Race | ||||||
| White (non-Hispanic) | 3804 | 77.9 | 2985 | 65.2 | 3158 | 68.7 |
| Black/African-American | 316 | 6.5 | 128 | 2.8 | 247 | 5.4 |
| Hispanic | 454 | 9.3 | 782 | 17.1 | 647 | 14.1 |
| All others | 310 | 6.3 | 684 | 14.9 | 545 | 11.9 |
| Total | 4884 | 100.0 | 4579 | 100.0 | 4597 | 100.0 |
| Education | ||||||
| Some college or less | 2366 | 48.4 | 3174 | 69.2 | 4600 | 100.0 |
| College graduate or above | 2524 | 51.6 | 1410 | 30.8 | — | 0.0 |
| Total | 4890 | 100.0 | 4584 | 100.0 | 4600 | 100.0 |
| Annual household income | ||||||
| Less than $25 000 | 543 | 11.2 | 1480 | 32.4 | n/a | |
| Between $25 000 and $49 999 | 1209 | 24.9 | 1479 | 32.4 | n/a | |
| Between $50 000 and $74 999 | 1323 | 27.2 | 801 | 17.5 | n/a | |
| More than $75 000 | 1784 | 36.7 | 809 | 17.7 | n/a | |
| Total | 4859 | 100.0 | 4569 | 100.0 | n/a | |
| Are you planning to stop smoking within the next 30 days? | ||||||
| No | 3556 | 72.8 | 3125 | 68.2 | n/a | |
| Yes | 1330 | 27.2 | 1458 | 31.8 | n/a | |
| Total | 4886 | 100.0 | 4583 | 100.0 | n/a | |
| Smoked in the past 30 days | ||||||
| No | n/a | n/a | 3493 | 76.0 | ||
| Yes | n/a | n/a | 1106 | 24.0 | ||
| Total | n/a | n/a | 4599 | 100.0 | ||
| Text only versus graphic warning | ||||||
| Text only | 977 | 20.0 | 923 | 20.1 | 920 | 20.0 |
| Graphic warning | 3913 | 80.0 | 3661 | 79.9 | 3680 | 80.0 |
| Total | 4890 | 100.0 | 4584 | 100.0 | 4600 | 100.0 |
The young adult sample included 4584 current smokers aged 18–24. The majority of the sample was male (53.8%), white (65.2%) and reported annual household income of less than $50 000 (64.8%). Only 30.8% held a bachelor’s degree or higher. At the time of the survey, 68.2% of respondents in the young adult sample reported not intending on quitting smoking in the next 30 days, and 46.9% said it was somewhat or very likely that they would attempt to quit smoking within the next 30 days post-exposure.
The youth sample comprised four thousand six hundred 13- to 17-year-old current smokers or those susceptible to smoking initiation. The majority of the sample was male (52.7%) and white (68.7%). Seventy-six percent of the youth sample were current smokers and24% were susceptible to smoking.
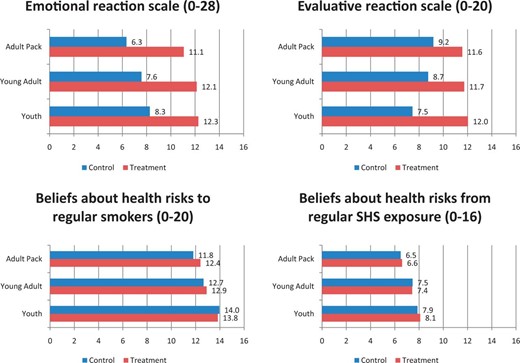
Figure 1 presents the mean and range for each outcome. In the adult sample, the mean and range of scores for the four scales (negative emotional reactions, cognitive reactions, beliefs about health risks to smokers and beliefs about health risks of secondhand smoke to non-smokers) were 9.3 (0–28), 10.9 (0–20), 12.2 (0–20) and 6.5 (0–16), respectively. Among young adults, the mean and range of scores for the four scales were 10.3 (0–28), 10.8 (0–20), 12.7 (0–20) and 7.4 (0–16), respectively. For youth, the mean and range of scores for the four scales were 10.6 (0–28), 10.8 (0–20), 12.9 (0–20) and 8.0 (0–16), respectively.
Study outcomes.
Regression results
Linear regression results are presented in Tables II and III. Table II presents findings for the negative emotional and cognitive reaction scales and Table III presents findings for the health belief scales.
Negative emotional and cognitive reactions to graphic health warnings
| Negative emotional reaction Scale | Cognitive reaction Scale | |||||
|---|---|---|---|---|---|---|
| Explanatory variable | Adult | Young adult | Youth | Adult | Young adult | Youth |
| ß | ß | ß | ß | ß | ß | |
| Graphic warning versus text only | 4.698*** | 4.576*** | 3.996*** | 2.391*** | 2.986*** | 4.595*** |
| (0.000) | (0.000) | (0.000) | (0.000) | (0.000) | (0.000) | |
| Smoked in the past 30 days | 0.032 | 0.562* | ||||
| (0.909) | (0.020) | |||||
| Gender | ||||||
| Male (referent) | ||||||
| Female | 0.815*** | 0.544* | 1.119*** | 0.463* | 0.172 | 0.238 |
| (0.000) | (0.017) | (0.000) | (0.018) | (0.401) | (0.227) | |
| Race/ethnicity | ||||||
| White (referent) | ||||||
| Black/African American | −0.354 | 0.783 | 0.287 | 0.313 | 1.874* | 0.777 |
| (0.432) | (0.343) | (0.569) | (0.456) | (0.011) | (0.087) | |
| Hispanic | 0.559 | 0.867** | 0.453 | 0.324 | 0.901** | 0.233 |
| (0.182) | (0.005) | (0.209) | (0.346) | (0.001) | (0.457) | |
| All others | 0.416 | 1.271*** | 0.330 | 0.160 | 0.131 | −0.452 |
| (0.360) | (0.000) | (0.341) | (0.698) | (0.650) | (0.128) | |
| Education | ||||||
| Some college or less (referent) | ||||||
| College graduate or greater | −0.087 | −0.103 | −0.200 | −0.410 | ||
| (0.693) | (0.710) | (0.324) | (0.082) | |||
| Income | ||||||
| Less than $25 000 (referent) | ||||||
| Between $25 000 and $49 999 | 0.812* | 0.188 | −0.057 | 0.310 | ||
| (0.032) | (0.497) | (0.872) | (0.216) | |||
| Between $50 000 and $74 999 | 1.280*** | 0.275 | −0.039 | 0.594 | ||
| (0.001) | (0.403) | (0.912) | (0.056) | |||
| More than $75 000 | 1.353*** | 0.259 | 0.042 | 0.675* | ||
| (0.000) | (0.450) | (0.906) | (0.022) | |||
| Are you planning to stop smoking within the next 30 days? | 2.157*** | 2.074*** | 0.683** | 0.599** | ||
| (0.000) | (0.000) | (0.002) | (0.007) | |||
| Observations | 1942 | 1833 | 1836 | 1943 | 1834 | 1840 |
P-values in parentheses. *P < 0.05, **P < 0.01, ***P < 0.001.
Beliefs about health risks associated with smoking
| Beliefs about health risks to smokers scale | Beliefs about health risks from secondhand smoke exposure to non-smokers scale | |||||
|---|---|---|---|---|---|---|
| Explanatory variable | Adult | Young adult | Youth | Adult | Young adult | Youth |
| ß | ß | ß | ß | ß | ß | |
| Graphic warning versus text only | 0.574** | 0.276 | −0.114 | 0.063 | 0.006 | 0.226 |
| (0.003) | (0.174) | (0.567) | (0.723) | (0.973) | (0.231) | |
| Smoked in the past 30 days | −2.306*** | −1.439*** | ||||
| (0.000) | (0.000) | |||||
| Gender | ||||||
| Male (referent) | ||||||
| Female | 0.800*** | 1.152*** | 1.345*** | 1.308*** | 1.164*** | 1.093*** |
| (0.000) | (0.000) | (0.000) | (0.000) | (0.000) | (0.000) | |
| Race/ethnicity | ||||||
| White (referent) | ||||||
| Black/African American | −0.084 | 0.609 | 0.541 | 0.953** | 1.652* | 1.098** |
| (0.840) | (0.404) | (0.236) | (0.007) | (0.023) | (0.009) | |
| Hispanic | 0.524 | −0.679* | 0.388 | 1.061** | −0.299 | 0.655* |
| (0.173) | (0.017) | (0.228) | (0.004) | (0.237) | (0.036) | |
| All other | −0.169 | 0.024 | 0.065 | 0.560 | 0.472 | 0.268 |
| (0.697) | (0.938) | (0.834) | (0.106) | (0.097) | (0.376) | |
| Education | ||||||
| Some college or less (referent) | ||||||
| College graduate or greater | −0.149 | 0.090 | −0.049 | −0.131 | ||
| (0.467) | (0.718) | (0.795) | (0.580) | |||
| Income | ||||||
| Less than $25 000 (referent) | ||||||
| Between $25 000 and $49 999 | 0.206 | −0.256 | 0.437 | −0.069 | ||
| (0.587) | (0.310) | (0.193) | (0.771) | |||
| Between $50 000 and $74 999 | −0.228 | −0.461 | 0.143 | −0.438 | ||
| (0.540) | (0.128) | (0.661) | (0.111) | |||
| More than $75 000 | −0.184 | −0.009 | −0.229 | −0.161 | ||
| (0.609) | (0.976) | (0.482) | (0.594) | |||
| Are you planning to stop smoking within the next 30 days? | 1.592*** | 0.519* | 1.363*** | 0.699*** | ||
| (0.000) | (0.019) | (0.000) | (0.001) | |||
| Observations | 1944 | 1833 | 1841 | 1944 | 1833 | 1840 |
P values in parentheses. *P < 0.05, **P < 0.01, ***P < 0.001.
Negative emotional reactions
In adults, exposure to graphic warning images was associated with an increase of 4.7 points in negative emotional reaction scale scores (P < 0.001) (see Table II). When compared with men, adult woman had significantly higher negative emotional reaction scale scores (P < 0.001). Moreover, those reporting annual household income between $25 000 and $49 999 (P < 0.05), between $50 000 and $74 999 (P < 0.01) and higher than $75 000 (P < 0.001) had higher scores than adults reporting less than $25 000. Adults with intentions to quit smoking in the next 30 days had significantly higher scores than those with no intention to quit (P < 0.001).
Young adults exposed to warning images also had significantly higher negative emotional reaction scale scores, approximately 4.6 points greater than young adults exposed to a warning statement only (P < 0.001). Females’ negative emotional reaction scale scores were significantly higher than males’ scores (P < 0.05). Additionally, Hispanics (P < 0.01) and those not white, black or Hispanic (P < 0.001) had significantly higher scores than white young adults. No association between negative emotional reaction scale scores and income was seen in the young adult sample. Young adults reporting that they intend to quit smoking in the next 30 days had significantly higher negative emotional scale scores than their counterparts with no such intentions (P < 0.001).
The effect of exposure to graphic health warnings on negative emotional reaction in the youth sample was also positive and significant. Youth exposed to a warning image had scores 4.0 points greater than youth exposed to a warning statement alone (P < 0.001). Additionally, female youth had significantly higher scores than male youth (P < 0.001).
Cognitive reactions
Adults exposed to warning images had cognitive reaction scale scores 2.4 points higher than those exposed to a warning statement alone (P < 0.001). Women’s cognitive reaction scale scores were significantly higher than men’s scores (P < 0.05). Furthermore, adults intending to quit smoking in the next 30 days had significantly higher scores than their counterparts (P < 0.01).
Among young adults, exposure to warning images was associated with scores 3.0 points higher than exposure to a warning statement alone (P < 0.001). Black (P < 0.05) and Hispanic young adults (P < 0.01) had significantly higher cognitive reaction scale scores than white young adults. Young adults reporting household annual income of more than $75 000 had significantly higher scores than those reporting less than $25 000 (P < 0.05). Quit intentions was associated with significantly higher scores (P < 0.01).
In youth, exposure to graphic health warnings was positive and significant, increasing cognitive reaction scale scores by 4.6 points (P < 0.001). Additionally, youth who reported smoking in the past 30 days had significantly higher cognitive reaction scale scores than those who did not (P < 0.05).
Beliefs about health risks to smokers
Adults exposed to graphic health warnings had significantly higher scores on the beliefs about health risks to smokers scale than adults seeing a warning statement only (P < 0.01) (see Table III). Women had significantly higher scores than men, and adults intending to quit smoking in the next 30 days had significantly higher scores than those not intending to quit in the next 30 days (P < 0.001).
Exposure to graphic health warnings did not appear to be significantly associated with higher scores in young adults. However, women had significantly higher scores than men (P < 0.001), and those who intend to quit smoking in the next 30 days had significantly higher scores than those who do not (P < 0.05). Compared with white young adults, Hispanic young adults had significantly lower scores (P < 0.05).
Among youth, exposure to graphic health warnings was not significantly associated with higher scores. Female youth had significantly higher scores than male youth (P < 0.001). Youth who reported smoking in the past 30 days had significantly lower scores than non-smoking youth susceptible to smoking (P < 0.001).
Beliefs about health risks from secondhand smoke exposure to non-smokers
Adults exposed to graphic health warnings did not have significantly different scores than those exposed to warning statements alone. Women had significantly higher scores than men (P < 0.001), and black (P < 0.01) and Hispanic (P < 0.01) adults had significantly higher scores than white adults. Moreover, adults who intend to quit smoking in the next 30 days had significantly higher scores than adults who do not intend to quit in the next 30 days (P < 0.001).
Exposure to graphic health warnings in young adults was not significant. Females had significantly higher scores than males (P < 0.001), blacks had higher scores than whites (P < 0.01), and young adults who intend to quit smoking in the next 30 days had higher scores than those who do not (P < 0.01).
In youth, exposure to graphic health warnings was not significantly associated with scores on the beliefs about health risks from secondhand smoke exposure to non-smokers scale. Females had significantly higher scores than males (P < 0.001), and black (P < 0.01) and Hispanic (P < 0.05) youth had significantly higher scores than white youth. Youth having smoked in the past 30 days had significantly lower scores than non-smoking youth susceptible to smoking (P < 0.001).
Discussion
The results presented here indicate that all nine of the selected graphic warnings elicit strong negative emotional and cognitive reactions for all three age groups assessed in the study. The negative emotional reactions are consistent with studies that find graphic health warnings or advertisements featuring graphic images of the consequences of the health risks of smoking evoke negative emotional responses [3]. The cognitive reactions are consistent with evidence from other countries that have implemented graphic health warnings that adults and young adults find graphic health warnings to be a credible source of information about the health risks of smoking [3]. We found less evidence for an effect of the graphic health warnings on the scales that measure beliefs about the health risks of smoking to smokers or the health risks of secondhand smoke exposure to non-smokers. The only statistically significant result was in the adult sample for beliefs about the health risks of smoking to smokers.
A key question is to what extent the immediate reactions we find to the graphic warning labels might lead to changes in attitudes, beliefs, intentions, or behaviors. A recent study finds that immediate reactions to smoking cessation advertisements are related to subsequent changes in cessation-related attitudes, beliefs, intentions and behaviors [22]. That is, individuals that give higher appraisals of ad quality in terms of negative emotional and cognitive responses to the ads are more likely to show changes in key attitudes, intentions and behaviors related to the message content compared to those that give lower appraisals of message quality.
The study has several limitations. First, the sample is a volunteer opt-in sample not recruited using probability methods and thus is not representative of the US population (or the three specific subsamples of the overall US population). This limits the generalizability of the results but not the internal validity. Second, participants received a single exposure to the hypothetical cigarette pack with graphic health warning. This constitutes a low dose and almost certainly limited our ability to observe effects on intermediate and longer-term outcomes.
The labels assessed in our study did not contain any information related to availability of cessation resources (e.g. quitline number). Health communication theories suggest that combining information about cessation resources with threatening or emotionally charged information is more likely to result in positive behavior change [26]. The FDA included in its graphic health warning rule a requirement that the warnings contain a reference to a quitline number. However, at the time of our study, a decision regarding this had not yet been made, and so we did not assess this in our study.
Conclusion
The strong negative emotional and cognitive reactions following a single exposure to the graphic health warnings suggest that, with repeated exposures over time, graphic health warnings may influence smokers’ beliefs, intentions and behaviors.
Supplementary data
Supplementary data are available here.
Funding
This work was supported by US Food and Drug Administration (contract no. HHSF223201010243G).
Conflict of interest statement
None declared.