


Abstract
Background The strength of the smoking–mortality association may vary over time and by ethnic group.
Methods Cohort studies of 1.6 million (1981–84) and 1.9 million (1996–99) New Zealanders aged 25–74 years were formed by the linkage of census and mortality data. Comparing current smokers with never smokers, standardized rate ratios (RRs) and rate differences (RDs) were calculated for all-cause and ischaemic heart disease (IHD) mortality.
Results Between 1981–84 and 1996–99 the all-cause mortality RR increased from 1.59 (95% CI 1.53–1.66) to 2.05 (1.97–2.14) for men and from 1.49 (1.42–1.56) to 2.01 (1.91–2.12) for women. All-cause RRs were significantly greater among non-Ma–ori non-Pacific than Ma–ori: 2.22 (2.12–2.33) compared with 1.51 (1.35–1.69) in men and 2.20 (2.09–2.33) compared with 1.45 in women (1.27–1.66), respectively, in 1996–99. This RR heterogeneity remained after adjusting for socio-economic factors and was similar for IHD. The RDs demonstrated less heterogeneity. For example, in 1996–99 the RDs were 627 per 100 000 (452–802) for Ma–ori compared with 464 (427–502) for non-Ma–ori non-Pacific among men, and 368 (228–509) compared with 340 (311–370) among women.
Conclusions In New Zealand the relative effect of smoking on mortality differs over time and by ethnicity. We expect that such heterogeneity exists in other countries where the background mortality rates vary over time or between social groups. Information on this heterogeneity, including ethnicity-specific data, is needed to accurately determine the mortality burden owing to tobacco. The size of the RR estimates should be interpreted in the context of absolute mortality and effect measures.
Cigarette smoking is a major cause of mortality, in both developed and developing countries.1 In New Zealand, tobacco is ranked as the second leading cause of death (18% of deaths) after diet.2 Smoking is also an important cause of health inequalities in the New Zealand population.3,4
To inform tobacco control policies and policies to reduce health inequalities, it is important to define the burden of smoking-related disease both at a national level and for major subpopulations. This requires an estimation of the size of the association between smoking and mortality for the relevant subpopulations. When estimating the burden of disease owing to tobacco, it is a common practice to use a “best estimate” relative risk of the smoking–mortality association [often the American Cancer Society, Cancer Prevention Study (CPS) II estimates],5 and apply this uniformly to national and subpopulation data (e.g. in New Zealand3,6–9 and globally,5,10–13 although recently Ezzati et al. have also used other data for China).12,13 But estimates from one country may not be generalizable to another.
Peto notes that “the hazards of tobacco depend strongly not only on current but also on previous smoking patterns, and on several co-factors.”5 According to Doll, “no single epidemiological study can provide an adequate basis for assessing the worldwide epidemic of death from tobacco, because the epidemic is at a different stage, and is evolving so differently, in different populations.”14 There are certainly differences in reported effect sizes;15 however, it is unclear whether these are because of real differences in the magnitude of the effect, or variation in how the effect has been measured. Either way, it is difficult for researchers and policy-makers to know which measure to use in calculating tobacco-attributable disease burdens.
We used New Zealand data for two large cohort studies of adults for 1981–84 and 1996–99 to accurately determine the strength of the smoking–mortality association across time and by ethnic group. Māori are the indigenous population of New Zealand, comprising 8.1% of the 25 to 74-year-old cohort population in 1981, increasing to 10.8% in 1996–99. Pacific Island people began notably migrating to New Zealand in the 1950s and 1960s, and comprised 2.3% of the 25 to 74-year-old population in 1981 increasing to 3.8% in 1996. The remaining non-Māori non-Pacific group is comprised mainly of “European New Zealanders”, or descendants of European migrants in the last two centuries.
Methods
The data used for analyses in this paper comprise two full population cohort studies (1981–84 and 1996–99) formed by record linkage of census and mortality data as a part of the New Zealand Census–Mortality Study (NZCMS).
Briefly, the cohorts were constructed using anonymous and probabilistic record linkage, using weighting to adjust for linkage bias. Over 98% of linkages are estimated to be true positive linkages.16 From these studies, 71% and 78% of eligible deaths among people aged 25–74 years on the 1981 and 1996 census nights, respectively, were linked to a census record. The probability of linkage varied by demographic variables.17,18 Therefore, we assigned weights to each linked census–mortality record to adjust for any resultant linkage bias.18 For example, if 20 out of 30 Pacific male decedents aged 45–64 years and residing in moderately socio-economically deprived neighbourhoods were linked to a census record, we assigned each of the 20 linked records a weight of 1.5 (i.e. 30/20). These weights were calculated and applied to numerous strata, and used in all analyses in this paper. The record linkage methods16,17,19 and methods specific to this paper are described in more detail elsewhere.20,21
Cigarette smoking status was recorded in both the 1981 and 1996 censuses, and coded as current, ex, and never. In addition to all-cause mortality, we examined ischaemic heart disease (IHD) deaths (ICD-9 codes 410–414) as an outcome because of the relatively short time lags between changing smoking status and changing IHD mortality risk.22 (Statistical power was insufficient to examine stroke mortality.) Demographic covariates were sex, age (5 year age groups), and ethnicity. Respondents were classified as “Māori” if they identified Māori as one of the ethnic groups to which they belonged, “Pacific” if they identified a Pacific group (but not Māori), and “non-Māori non-Pacific” if they did not identify Ma–ori or Pacific as one of the ethnic groups to which they belonged. (The majority of respondents in this third group are of European origin.)
For the majority of analyses, we calculated age- or age and ethnicity-standardized mortality rates, rate ratios (RRs), and rate differences (RDs).23 The 1991 census population was the external standard. Standardization analyses were conducted on 98.3% and 92.5% of the full 1981–84 and 1996–99 cohorts, respectively, i.e. the proportion with complete data on demographics and cigarette smoking. In addition to examining 95% confidence intervals (CIs) to assess heterogeneity of RRs and RDs, we also used the Wald test of (strictly speaking) homogeneity across ethnic groups.23
We used Poisson regression to adjust for a range of socio-economic factors—as potential confounders—available on the NZCMS (see footnote to Table 3 for details of variables). These analyses were conducted on the 73.1% and 74.0% of the two cohorts that also had complete demographic, smoking, and socio-economic data.
Role of the funding source
The funding source approved the design of the New Zealand Census–Mortality Study (NZCMS); however, they had no role in the design of this particular study, or in data collection, data analysis, data interpretation, or in the writing of the report. The corresponding author has full access to all the data in the study and had final responsibility for the decision to submit for publication.
Results
Trends in RRs and RDs over time
Mortality rates varied notably by all combinations of sex, time, ethnicity, and smoking status (Table 1, Figures 1 and 2). The difference in mortality rates between current and never smokers varies across cohorts and demographic strata, especially in relative terms. These smoking differences are quantified as RRs and RDs in Table 2.
All-cause and IHD mortality rates for the two cohorts by ethnicity, sex, and smoking status
| Men | Women | |||||||||||||||||||||
|---|---|---|---|---|---|---|---|---|---|---|---|---|---|---|---|---|---|---|---|---|---|---|
| All-case | IHD | All-case | IHD | |||||||||||||||||||
| Smoking status | Total person-time (years) | No. wgt deathsa | Std mort rateb (95% CI) | No. wgt deathsa | Std mort rateb (95% CI) | person-time (years) | No. wgt deathsa | Std mort rateb (95% CI) | No. wgt deathsa | Std mort rateb (95% CI) | ||||||||||||
| 1981–84 | ||||||||||||||||||||||
| Māori | Current | 103 168 | 963 | 1724 (1556–1892) | 240 | 476 (387–564) | 112 784 | 603 | 1127 (979–1275) | 105 | 267 (187–346) | |||||||||||
| Ex | 39 042 | 495 | 1563 (1374–1752) | 153 | 489 (388–590) | 31 762 | 330 | 1455 (1237–1674) | 66 | 301 (207–396) | ||||||||||||
| Never | 55 675 | 564 | 1450 (1278–1621) | 162 | 456 (361–550) | 59 170 | 507 | 1060 (932–1187) | 120 | 273 (209–338) | ||||||||||||
| Pacific | Current | 26 636 | 120 | 915 (656–1175) | 24 | 222 (89–356) | 14 092 | 27 | 384 (176–592) | 9 | 160 (22–299) | |||||||||||
| Ex | 8263 | 69 | 1586 (1095–2077) | 24 | 514 (244–783) | 5140 | 36 | 1242 (708–1777) | 6 | 185 (103–399) | ||||||||||||
| Never | 23 781 | 93 | 899 (619–1178) | 12 | 97 (18–176) | 37 715 | 120 | 579 (433–725) | 9 | 47 (8–86) | ||||||||||||
| Non-Māori | Current | 738 693 | 8169 | 1151 (1122–1181) | 2844 | 400 (383–417) | 610 128 | 3774 | 685 (659–712) | 1068 | 201 (186–215) | |||||||||||
| non-Pacific | Ex | 604 127 | 8190 | 886 (862–909) | 3045 | 320 (306–333) | 351 644 | 2631 | 626 (597–655) | 627 | 145 (132–158) | |||||||||||
| Never | 789 595 | 4536 | 687 (663–711) | 1635 | 257 (242–271) | 1 219 952 | 6384 | 431 (418–443) | 1590 | 100 (94–106) | ||||||||||||
| All ethnicityc | Current | 868 497 | 9249 | 1192 (1163–1222) | 3111 | 402 (385–418) | 737 004 | 4407 | 713 (687–739) | 1179 | 204 (190–218) | |||||||||||
| Ex | 651 432 | 8754 | 948 (922–975) | 3219 | 336 (321–351) | 388 546 | 2997 | 698 (666–730) | 696 | 156 (142–170) | ||||||||||||
| Never | 869 050 | 5193 | 749 (724–774) | 1806 | 268 (253–282) | 1 316 838 | 7014 | 480 (465–494) | 1719 | 110 (103–116) | ||||||||||||
| 1996–99 | ||||||||||||||||||||||
| Māori | Current | 133 292 | 1284 | 1857 (1711–2002) | 285 | 441 (370–511) | 170 428 | 867 | 1189 (1068–1310) | 144 | 235 (183–288) | |||||||||||
| Ex | 68 068 | 816 | 1335 (1223–1446) | 243 | 391 (332–450) | 69 730 | 591 | 1216 (1091–1341) | 90 | 202 (150–254) | ||||||||||||
| Never | 117 139 | 996 | 1230 (1133–1327) | 240 | 330 (279–381) | 107 909 | 741 | 821 (749–893) | 120 | 145 (115–176) | ||||||||||||
| Pacific | Current | 41 592 | 279 | 1144 (944–1345) | 75 | 286 (197–374) | 31 123 | 93 | 703 (483–923) | 12 | 124 (30–218) | |||||||||||
| Ex | 13 004 | 144 | 1363 (1083–1643) | 30 | 301 (173–429) | 10 801 | 66 | 867 (591–1143) | 9 | 118 (20–216) | ||||||||||||
| Never | 53 643 | 351 | 974 (837–1111) | 87 | 263 (192–335) | 76 878 | 357 | 667 (578–756) | 45 | 90 (59–121) | ||||||||||||
| Non-Māori | Current | 568 050 | 4479 | 982 (949–1015) | 1167 | 258 (241–274) | 511 620 | 2352 | 623 (595–651) | 375 | 107 (95–119) | |||||||||||
| non-Pacific | Ex | 684 071 | 6753 | 601 (583–619) | 1785 | 149 (141–157) | 558 900 | 2931 | 445 (427–462) | 432 | 64 (57–70) | |||||||||||
| Never | 1 179 378 | 4563 | 442 (427–456) | 1167 | 117 (109–124) | 1 458 070 | 4605 | 283 (274–292) | 606 | 36 (33–39) | ||||||||||||
| All ethnicityc | Current | 742 933 | 6042 | 1052 (1020–1083) | 1530 | 273 (257–289) | 713 171 | 3309 | 665 (638–692) | 531 | 116 (105–128) | |||||||||||
| Ex | 765 143 | 7713 | 668 (649–687) | 2058 | 169 (160–178) | 639 431 | 3585 | 509 (490–528) | 528 | 74 (67–81) | ||||||||||||
| Never | 1 350 159 | 5907 | 513 (498–528) | 1491 | 134 (127–142) | 1 642 858 | 5697 | 330 (320–340) | 771 | 44 (40–47) | ||||||||||||
Number of deaths are random rounded to a near multiple of three as per Statistics New Zealand protocol.
Number of weighted deaths random rounded.
Standardized mortality rate deaths per 100 000 person-years.
Ethnicity standardized.
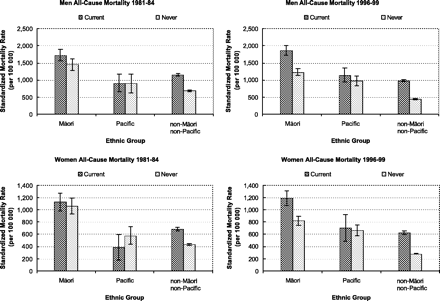
All-cause mortality rates for the two cohorts by ethnicity, sex, and smoking status
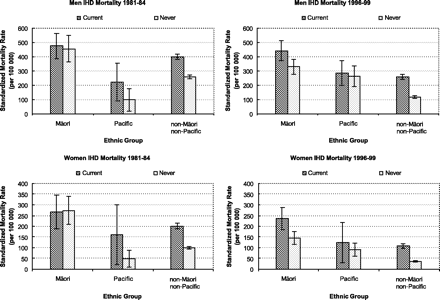
IHD mortality rates for the two cohorts by ethnicity, sex, and smoking status
RRs and RDs—current versus never smokers by sex and ethnicity
| Men | Women | |||||||
|---|---|---|---|---|---|---|---|---|
| Standardized rate ratio (95% CI) | Standardized rate difference (95% CI) | Standardized rate ratio (95% CI) | Standardized rate difference (95% CI) | |||||
| All-cause 1981–84 | ||||||||
| Māori | 1.19 (1.02–1.39) | 274 (34–514) | 1.06 (0.89–1.27) | 68 (−128–;263) | ||||
| Pacific | 1.02 (0.67–1.55) | 17 (−365–399) | 0.66 (0.37–1.20) | −195 (2449–59) | ||||
| Non-Māori non-Pacific | 1.68 (1.61–1.75) | 464 (427–502) | 1.59 (1.52–1.67) | 254 (225–284) | ||||
| All ethnicitya | 1.59 (1.53–1.66) | 444 (405–482) | 1.49 (1.42–1.56) | 233 (203–263) | ||||
| Wald P-valueb | <0.01 | 0.019 | <0.01 | <0.01 | ||||
| All-cause 1996–99 | ||||||||
| Māori | 1.51 (1.35–1.69) | 627 (452–802) | 1.45 (1.27–1.66) | 368 (228–509) | ||||
| Pacific | 1.18 (0.94–1.47) | 171 (−72–413) | 1.05 (0.75–1.48) | 36 (−201–273) | ||||
| Non-Māori non-Pacific | 2.22 (2.12–2.33) | 540 (504–576) | 2.20 (2.09–2.33) | 340 (311–370) | ||||
| All ethnicitya | 2.05 (1.97–2.14) | 539 (504–574) | 2.01 (1.91–2.12) | 335 (306–364) | ||||
| Wald P-valueb | <0.01 | <0.01 | <0.01 | 0.040 | ||||
| IHD 1981–84 | ||||||||
| Māori | 1.04 (0.79–1.38) | 20 (−110–150) | 0.98 (0.67–1.43) | −7 (2109–96) | ||||
| Pacific | 2.29 (0.84–6.29) | 125 (−30–280) | 3.40 (1.03–11.23) | 113 (−31–257) | ||||
| Non-Māori non-Pacific | 1.56 (1.45–1.67) | 144 (121–166) | 2.01 (1.83–2.20) | 101 (85–116) | ||||
| All ethnicitya | 1.50 (1.40–1.61) | 134 (112–156) | 1.86 (1.70–2.04) | 94 (79–110) | ||||
| Wald P-valueb | 0.015 | 0.159 | <0.01 | 0.107 | ||||
| IHD 1996–99 | ||||||||
| Māori | 1.34 (1.07–1.67) | 111 (24–198) | 1.62 (1.20–2.20) | 90 (30–151) | ||||
| Pacific | 1.08 (0.72–1.64) | 22 (−92–136) | 1.38 (0.60–3.17) | 34 (−65–133) | ||||
| Non-Māori non-Pacific | 2.21 (2.02–2.42) | 141 (123–159) | 3.00 (2.60–3.45) | 71 (59–84) | ||||
| All ethnicitya | 2.03 (1.87–2.20) | 139 (121–156) | 2.67 (2.35–3.03) | 73 (61–85) | ||||
| Wald P-valueb | <0.01 | 0.109 | <0.01 | 0.619 | ||||
Ethnicity standardized.
A Wald P-value <0.05 indicates heterogeneity between ethnic groups that is statistically significant.
The RRs have generally increased from 1981–84 to 1996–99, for both sexes and within ethnic groups, and for both all-cause and IHD mortality (except for the rather imprecise Pacific IHD estimates). The RDs tended to increase moderately, although to a lesser extent than the RRs, over time for all-cause mortality. Comparing the two time periods, the 95% CIs were non-overlapping only among the non-Māori non-Pacific group for all-cause mortality (both sexes) and for “all ethnicities” combined (both sexes). The RDs for IHD tended to be stable over time.
Differences in RRs and RDs by ethnicity
There was a marked heterogeneity or effect measure modification of the RRs by ethnicity for all-cause mortality and IHD in both cohorts (Table 2). In particular, non-Māori non-Pacific had substantially greater RRs than either Māori or Pacific people for both cohorts, both sexes, and both causes of mortality. The Wald test of homogeneity of the RRs by ethnic group was highly statistically significant in all cases (Table 2).
The RDs for all-cause mortality were highest for non-Māori non-Pacific men and women in the 1981–84 cohort, but were similar to Māori (with largely overlapping CIs) in the 1996–99 cohort. The RDs for Pacific people were consistently the smallest, and the P-value for the Wald test of homogeneity of the RDs across all three ethnic groups was <0.05 in all cases.
Adjusting for socio-economic factors
Following the adjustment for age and socio-economic factors, RR estimates still appeared to increase over time and to differ by ethnicity (Table 3). The increase over time was smaller than for the unadjusted RRs, owing to a relatively greater “adjustment” in the RR estimates for 1996–99. This suggests greater confounding by socio-economic factors in the 1996–99 cohort.
Adjusted RRs (Poisson regression)—current versus never smokers by sex and ethnicity
| Men | Women | |||||||||||
|---|---|---|---|---|---|---|---|---|---|---|---|---|
| SRRa (95% CI) | Adj RR − Ageb (95% CI) | Adj RR − Age + SEPc (95% CI) | SRRa (95% CI) | Adj RR − Ageb (95% CI) | Adj RR − Age + SEPc (95% CI) | |||||||
| All-cause 1981–84 | ||||||||||||
| Māori | 1.19 (1.02–1.39) | 0.98 (0.79–1.21) | 0.91 (0.73–1.12) | 1.06 (0.89–1.27) | 1.29 (1.01–1.64) | 1.22 (0.95–1.55) | ||||||
| Pacific | 1.02 (0.67–1.55) | 1.08 (0.62–1.89) | 1.08 (0.61–1.89) | 0.66 (0.37–1.20) | 0.44 (0.17–1.10) | 0.43 (0.17–1.08) | ||||||
| Non-Māori non-Pacific | 1.68 (1.61–1.75) | 1.65 (1.55–1.75) | 1.51 (1.42–1.60) | 1.59 (1.52–1.67) | 1.60 (1.50–1.71) | 1.54 (1.44–1.65) | ||||||
| All ethnicityd | 1.59 (1.53–1.66) | 1.57 (1.48–1.66) | 1.44 (1.36–1.52) | 1.49 (1.42–1.56) | 1.55 (1.46–1.66) | 1.50 (1.40–1.60) | ||||||
| All-cause 1996–99 | ||||||||||||
| Māori | 1.51 (1.35–1.69) | 1.49 (1.28–1.74) | 1.25 (1.08–1.46) | 1.45 (1.27–1.66) | 1.43 (1.19–1.71) | 1.25 (1.04–1.50) | ||||||
| Pacific | 1.18 (0.94–1.47) | 1.19 (0.86–1.65) | 1.08 (0.78–1.50) | 1.05 (0.75–1.48) | 1.46 (0.96–2.22) | 1.51 (0.99–2.31) | ||||||
| Non-Māori non-Pacific | 2.22 (2.12–2.33) | 2.16 (2.03–2.30) | 1.82 (1.71–1.94) | 2.20 (2.09–2.33) | 2.23 (2.08–2.40) | 1.99 (1.85–2.15) | ||||||
| All ethnicityd | 2.05 (1.97–2.14) | 2.01 (1.90–2.12) | 1.68 (1.59–1.78) | 2.01 (1.91–2.12) | 2.05 (1.92–2.19) | 1.83 (1.70–1.95) | ||||||
| IHD 1981–84 | ||||||||||||
| Māori | 1.04 (0.79–1.38) | 0.88 (0.60–1.30) | 0.85 (0.58–1.26) | 0.98 (0.67–1.43) | 1.21 (0.71–2.06) | – | ||||||
| Pacific | 2.29 (0.84–6.29) | 2.75 (0.79–9.52) | – | 3.40 (1.03–11.23) | – | – | ||||||
| Non-Māori non-Pacific | 1.56 (1.45–1.67) | 1.52 (1.38–1.67) | 1.41 (1.28–1.55) | 2.01 (1.83–2.20) | 1.92 (1.69–2.18) | 1.84 (1.62–2.09) | ||||||
| All ethnicityd | 1.50 (1.40–1.61) | 1.48 (1.34–1.62) | 1.38 (1.25–1.51) | 1.86 (1.70–2.04) | 1.86 (1.64–2.11) | 1.78 (1.57–2.02) | ||||||
| IHD 1996–99 | ||||||||||||
| Māori | 1.34 (1.07–1.67) | 1.29 (0.95–1.76) | 1.13 (0.82–1.54) | 1.62 (1.20–2.20) | 1.55 (1.00–2.42) | 1.33 (0.85–2.09) | ||||||
| Pacific | 1.08 (0.72–1.64) | 1.07 (0.57–2.02) | 0.99 (0.52–1.87) | 1.38 (0.60–3.17) | 2.46 (0.96–6.29) | – | ||||||
| Non-Māori non-Pacific | 2.21 (2.02–2.42) | 2.13 (1.90–2.40) | 1.74 (1.54–1.97) | 3.00 (2.60–3.45) | 3.36 (2.80–4.03) | 2.87 (2.38–3.46) | ||||||
| All ethnicityd | 2.03 (1.87–2.20) | 1.95 (1.75–2.18) | 1.61 (1.44–1.80) | 2.67 (2.35–3.03) | 2.93 (2.48–3.47) | 2.52 (2.12–2.99) | ||||||
Age-standardized RRs (first restricted cohort).
RRs adjusted for age (5 year bands) (Second restricted cohort).
RRs adjusted for age and socio-economic position (SEP) (Second restricted cohort).
Socio-economic variables were: equivalized household income (quintiles); highest educational qualification (no qualification, school qualification, post-school qualification); motor vehicle ownership (nil, one, two, or more); labour force status (employed, unemployed, not in active labour force); housing tenure (owned, rented, or other); marital status (never married, previously married, currently married); and neighbourhood socio-economic deprivation (quintiles, using NZDep96) (for more detail see Hill, 2002).19
Ethnicity standardized.
Discussion
We found substantial increases in smoking–mortality RR estimates between 1981–84 and 1996–99, and substantial heterogeneity of RR estimates between Māori, Pacific people and non-Māori non-Pacific people (RRs generally highest for the latter group). This pattern was reasonably consistent for both all-cause and IHD deaths, and remained evident after age (and ethnicity) standardization and socio-economic adjustment by regression. There was also some heterogeneity of the RDs, although this was less marked than RR heterogeneity.
Strengths and weaknesses of this study
This study involved two large cohorts with the capacity to adjust for major potential confounders. Despite these strengths, potential limitations include misclassification of exposure, and residual confounding. For example, as smoking status was recorded at the start of each cohort by census questionnaire, there is the potential for incorrect reporting and assigning of smoking status, and the status changing over the subsequent 3 years. This could include differential under-reporting of smoking by ethnicity. A basic sensitivity analysis conducted elsewhere for various levels of smoking status mismeasurement did not substantially modify the heterogeneity reported in this paper.21 Other factors, such as level of smoking and total smoking history, types and brands of cigarette (e.g. variation in tar yield), and smoking behaviours (e.g. depth of inhalation) were not recorded; all of these affect current or cumulative exposure. Some other national studies have reported similar levels of consumption (cigarettes per day) for Māori compared with Pakeha (“European” ethnicity)24 or the total population.3,6–9 One of these studies also found an earlier age of smoking commencement and a slightly longer duration of use among Māori compared with Pakeha24 (the overall pattern for Pacific people is less clear). These last two factors would tend to increase total exposure, raise smokers” mortality rates, and increase the RRs for Māori more so than for other ethnic groups—meaning that we may have, in fact, underestimated (not overestimated) the degree of heterogeneity. It is still possible that other variables, such as brand usage or inhalation behaviour may work in the opposite direction (i.e. be relatively less hazardous for Māori and Pacific peoples), but we are not aware of any data on these points.
Passive smoking can be considered another type of exposure misclassification (of exposure to cigarette smoke) given the evidence that second-hand smoke exposure is more common among Māori non-smokers than their non-Māori counterparts.25 Such differential exposure might raise never- smoker mortality rates among Māori to a greater extent, and therefore be responsible for some of the heterogeneity we observed. However, it cannot be responsible for all the heterogeneity: the increased (relative) risk of death from passive smoking is ∼15%,26 which—allowing for even extreme differences in the exposure to passive smoking between ethnic groups—is not enough to explain the RR smoking–mortality heterogeneity we observed in this study.
The tobacco-mortality association can be confounded by socio-economic factors,27 but we have shown that after adjusting for socio-economic position RR heterogeneity remains (Table 3). Residual confounding, by more “proximal” determinants for example, might explain some of the observed heterogeneity, but probably not much. Many of these factors (e.g. diet, exercise, blood pressure, stress) are patterned by socio-economic position, meaning that we have indirectly adjusted for some of their influence. In addition, it would require markedly different prevalences of these other risk factors by time or ethnicity (and/or strong interactions of these risk factors with smoking, ethnicity, or each other) to explain the extent of heterogeneity that we observed.
Consistency with other studies
In terms of the trend over time, these findings are consistent with the increasing relative risk estimates for all-cause and IHD mortality in the more recent birth cohorts and study decades of the British doctors study.22 Similarly, for the cancer prevention studies (CPS I and CPS II) in the United States, there were also increases in the relative risks from smoking for these two causes of death (for both men and women).28
Where there has been some comparison of the smoking–mortality association by ethnicity in previous studies, the results have not been conclusive. One report from the CPS I study found little difference between CHD disease mortality ratios for black and white men.29 There was more difference in the ratios between black and white women, but the number of deaths in black women was small and the pattern was not consistent across the levels of smoking.29 From the MRFIT data (men only), regression coefficients for mortality by level of smoking (not RRs) did not differ significantly between the two groups.30 The Kaiser Permanente Study did show some heterogeneity of relative risk estimates by ethnicity, but there was no clear consistent pattern and the CIs were overlapping.31
More recently, results published from the INTERHEART study, reported the relationship between acute myocardial infarction and smoking (as well as a range of other risk factors) using a large international case–control study.32 One of their objectives was to clarify if the effects of such risk factors vary across different ethnic groups (and countries). Although the odds ratios were reported to be “qualitatively” or “directionally” similar, the estimates in relation to smoking were not illustrated by ethnic group. Looking at the results by country, the point estimates did vary (1.82–2.80) but with wide and overlapping CIs. The same pattern may have occurred with the ethnicity analysis. In this respect, our larger cohort study has allowed for greater precision and (although looking at mortality) shows statistically significant variation by ethnicity. It is also possible that combining recent ex-smokers into the current smoker group in the INTERHEART study may have led to less variation in odds ratios.
A direct comparison with the overall RR estimates reported from other populations, such as CPS II, is difficult owing to differences in age range, ethnicity, and methodology (e.g. measurement of level of exposure). Direct standardization does not necessarily solve the strong effect of modification by age unless the same standard population is used. Nevertheless, it can be seen that the 1981–84 all-cause mortality estimates for the New Zealand population (1.59 for men and 1.49 for women) are lower than the RRs reported for CPS II 1982–88 (2.3 for men and 1.9 for women).
Possible explanations for the findings
The simplest explanation for increasing RRs over time is that the RDs are more (but not completely) homogeneous across time in the context of declining overall mortality rates for both smokers and never smokers (Table 1). Consequently, the ratio of the two rates increases if the absolute difference remains about the same, i.e. they both cannot be constant over time. In addition, all-cause mortality rates have declined more sharply in never smokers than current smokers, i.e. the increased RD here is contributing to even more marked increases in the RRs over time. These trends can be seen graphically in Figures 1 and 2.
Difference in absolute mortality is also a part of the explanation for the heterogeneity of the smoking–mortality association by ethnicity. Overall, Māori and Pacific peoples have higher mortality rates than non-Māori non-Pacific people, giving rise to lower RRs among smokers. The RD between smokers and never-smokers is roughly the same in each ethnic group, but higher overall mortality in Māori and Pacific peoples results in lower RRs.
The disparity in mortality rates between ethnic groups in New Zealand have been well documented elsewhere.33–35 For example, the age-standardized mortality rates for Māori and Pacific males, respectively, in 1996–99 were 1258 and 1144 per 100 000, compared with 641 for non-Māori non-Pacific males.34 The mortality rates for Māori, Pacific and non-Māori non-Pacific females over the same period were 894, 696, and 407 per 100 000, respectively.34 The findings in this current study indicate that these differences between ethnic groups apply to both smokers and never smokers. The causes for the background mortality differences by ethnicity in New Zealand are likely to cover a wide range of nested and interacting explanations, including the legacy of colonization, racism, varying socio-economic position, differential access to health services, and varying risk factors. From one perspective, these competing and overwhelming determinants of disease mean that cigarette smoking is less prominent, on a relative scale, as a major risk factor for mortality among Māori and Pacific people, whereas among non-Māori non-Pacific people the smoking–mortality association stands out. However, in the context of absolute mortality rates, and the not too dissimilar RDs among ethnic groups, it is clear that smoking has a significant impact for Māori, emphasizing that a relative measure of effect (such as the RR) cannot be considered in isolation.
Implications for further research and for policy makers
This research clearly demonstrates the importance of measuring health effects from smoking more accurately, in a timely manner, and specifically for different population groups. This was possible in this study owing to the collection of smoking data and ethnicity data in the national census and the linkage of census and mortality data. Other large health surveys and cohort studies can also be used to measure the smoking–mortality association by population group. Some explanations are offered here as to the patterns seen. However, there are likely to be many other determinants involved that probably cannot accurately be disentangled, preventing the accurate prediction of future trends (e.g. varying prevalence and interaction between causal factors for IHD). Whatever the underlying disease mechanisms, “borrowing” inaccurate figures from other populations will introduce error in estimates of the burden of disease owing to smoking, especially in the context of ongoing and often differential declines in mortality rates. To have accurate relative risks for informing and prioritizing interventions to improve total population health, and reduce inequalities in health, will require fairly regular recalculation of the smoking–mortality association for each population group of interest. Although it is beyond the scope of this paper to re-estimate the burdens of death owing to smoking by ethnicity in New Zealand, it is clear that using the RRs in this paper (rather than the RRs from CPS II) will result in a smaller percentage of all Māori deaths being attributable to smoking—although the burden from smoking in absolute terms will still be substantial in all ethnic groups.
Contributorship
Darren Hunt led the study design, analyses, interpretation, and write-up of the study. Tony Blakely conceived of the study, and contributed to the study design, interpretation, and write-up. Alistair Woodward and Nick Wilson contributed to the interpretation and write-up. Authorship order was assigned on the basis of relative importance of contribution. This paper was based on a Master of Public Health Thesis by Darren Hunt.21
Summary Statistics New Zealand security statement
The NZCMS is a study of the relationship between socio-economic factors and mortality in New Zealand, based on the integration of anonymized population census data from Statistics New Zealand and mortality data from the New Zealand Health Information Service. The project was approved by Statistics New Zealand as a Data Laboratory project under the Microdata Access Protocols in 1997. The datasets created by the integration process are covered by the Statistics Act and can be used for statistical purposes only. Only approved researchers who have signed Statistics New Zealand's declaration of secrecy can access the integrated data in the Data Laboratory. (A full security statement is at http://www.wnmeds.ac.nz/nzcms-info.html) For further information about confidentiality matters with respect to this study, please contact Statistics New Zealand.
In two cohorts comprising 1.6 million and 1.9 million New Zealanders aged 25–74 years, the mortality rate ratios (RRs) for current versus never-smokers increased significantly between 1981–84 and 1996–99 (for all-cause and ischaemic heart disease mortality).
This appears to be the first major population-based study to clearly show effect modification of smoking–mortality by ethnic group—with RRs being significantly lower for Māori compared with non-Māori non-Pacific men and women.
This heterogeneity in RRs by time and ethnicity remained after further controlling for socio-economic variables by Poisson regression.
Up-to-date and ethnicity-specific data are needed if countries are to more accurately define the tobacco-attributable mortality burdens within their different populations.
June Atkinson assisted with the analyses. We thank Ricci Harris, Sarah Hill, and Martin Tobias for comments on an earlier draft of this paper. The NZCMS was funded by the Health Research Council of New Zealand, and receives ongoing funding from the New Zealand Ministry of Health.
Conflict of Interest Statement: We declare that we have no conflict of interest.
References
Yach D, Hawkes C, Gould C, Hofman K. The global burden of chronic diseases: overcoming impediments to prevention and control.
Ministry of Health. Looking Upstream: Causes of Death Cross-Classified by Risk and Condition, New Zealand 1997. Wellington: Ministry of Health,
Tobias M, Cheung J. Inhaling Inequality: Tobacco's Contribution to Health Inequality in New Zealand. Wellington: Ministry of Health,
Howden-Chapman P, Tobias M (eds). Social Inequalities in Health: New Zealand 1999. Wellington: Ministry of Health,
Peto R, Lopez AD, Boreham J, Thun M, Heath C Jr. Mortality from tobacco in developed countries: indirect estimation from national vital statistics.
Laugesen M, Clements M. Cigarette Smoking Mortality Among Maori, 1954–2028. Wellington: Te Puni Kokiri,
Laugesen M, Swinburn B. New Zealand's tobacco control programme 1985–1998.
Ministry of Health. Our Health, Our Future—Hauora Pakari, Koiora Roa. The Health of New Zealanders 1999. Wellington: Ministry of Health,
Murray CJ, Lopez AD. Global mortality, disability, and the contribution of risk factors: Global Burden of Disease Study.
Ezzati M, Lopez A. Estimates of global mortality attributable to smoking in 2000.
Ezzati M, Lopez A, Rodgers A, Hoorn S, Murray C, The Comparative Risk Assessment Collaborating Group. Selected major risk factors and global and regional burden of disease.
Doll R, Peto R, Hall E, Wheatly K, Gray R. Mortality in relation to smoking: 40 years' observations on male British doctors.
van de Mheen PJ, Gunning-Schepers LJ. Differences between studies in reported relative risks associated with smoking: an overview.
Blakely T, Salmond C. Probabilistic record linkage and a method to calculate the positive predictive value.
Blakely T, Salmond C, Woodward A. Anonymous linkage of New Zealand mortality and census data.
Fawcett J, Blakely T, Atkinson J. Weighting the 81, 86, 91 & 96 census-mortality cohorts to adjust for linkage bias. NZCMS Technical Report No. 5. (Available at: http://www.wnmeds.ac.nz/nzcms-info.htm) ISBN 0-473-09112-7. Wellington: Department of Public Health, Wellington School of Medicine, University of Otago,
Hill S, Atkinson J, Blakely T. Anonymous record linkage of census and mortality records: 1981, 1986, 1991, 1996 census cohorts. NZCMS Technical Report No. 3. (Also at http://www.wnmeds.ac.nz/nzcms-info.htm). Wellington: Department of Public Health, Wellington School of Medicine, University of Otago,
Hill S, Blakely T, Thomson G, Howden-Chapman P. Smoking Inequalities: Policies and Patterns of Tobacco Use in New Zealand, 1981–1996. [Available at: http://www.wnmeds.ac.nz/academic/dph/Publicationsreports/Smoking%20Inequalities%20Report,%20MoH,Final_pdf.pdf] Wellington: Department of Public Health, Wellington School of Medicine and Health Sciences, University of Otago,
Hunt D. Mortality from Smoking in New Zealand. Master thesis, Wellington: University of Otago,
Doll R, Peto R, Boreham J, Sutherland I. Mortality in relation to smoking: 50 years' observations on male British doctors.
Ministry of Health. Taking the Pulse: The 1996/97 New Zealand Health Survey. Wellington: Ministry of Health,
Whitlock G, MacMahon S, Vander Hoorn S, Davis P, Jackson R, Norton R. Association of environmental tobacco smoke exposure with socioeconomic status in a population of 7725 New Zealanders.
Hill S, Blakely T, Kawachi I, Woodward A. Mortality among "never smokers" living with smokers: two cohort studies, 1981–4 and 1996–9.
Blakely T, Hunt D, Woodward A. Confounding by socio-economic position remains after adjusting for neighbourhood deprivation. An example using smoking and mortality.
Thun M, Day-Lally C, Myers D et al. Trends in tobacco smoking and mortality from cigarette use in Cancer Prevention Studies I (1959 Through 1965) and II (1982 Through 1988). In: Shopland D, Burns D, Garfinkel L, Samet J (eds). Changes in Cigarette-Related Disease Risks and Their Implication for Prevention and Control. Smoking and Tobacco Control Monograph 8. Rockville, MD: US Department of Health and Human Services, Public Health Service, National Institutes of Health, National Cancer Institute,
Garfinkel L. Cigarette smoking and coronary heart disease in blacks: comparison to whites in a prospective study.
Neaton JD, Kuller LH, Wentworth D, Borhani NO. Total and cardiovascular mortality in relation to cigarette smoking, serum cholesterol concentration, and diastolic blood pressure among black and white males followed up for five years.
Friedman G, Tekawa I, Sadler M, Sidney S. Smoking and mortality: the Kaiser Permanente experience. In: Shopland D, Burns D, Garfinkel L, Samet J (eds). Changes in Cigarette-Related Disease Risks and Their Implication for Prevention and Control. Smoking and Tobacco Control Monograph 8. Rockville, MD: US Department of Health and Human Services, Public Health Service, National Institutes of Health, National Cancer Institute,
Yusuf S, Hawken S, Ounpuu S et al. Effect of potentially modifiable risk factors associated with myocardial infarction in 52 countries (the INTERHEART study): case–control study.
Blakely T, Ajwani S, Robson B, Tobias M, Bonne M. Decades of disparity: widening ethnic mortality gaps from 1980 to 1999.
Blakely T, Tobias M, Robson B, Ajwani S, Bonne M, Woodward A. Widening ethnic mortality disparities in New Zealand 1981–99. Soc Sci Med
Ajwani S, Blakely T, Robson B, Tobias M, Bonne M. Decades of Disparity: Ethnic mortality trends in New Zealand 1980–1999. (Available at: http://www.wnmeds.ac.nz/nzcms-info.htm). Wellington: Ministry of Health and University of Otago,

