Article Text

Abstract
Background Increasing tobacco taxes to increase price is a proven tobacco control measure. This article investigates how smokers respond to tax and price increases in their choice of discount brand cigarettes versus premium brands.
Objective To estimate how increase in the tax rate can affect smokers’ choice of discount brands versus premium brands.
Methods Using data from International Tobacco Control surveys in Canada and the USA, a logit model was constructed to estimate the probability of choosing discount brand cigarettes in response to its price changes relative to premium brands, controlling for individual-specific demographic and socioeconomic characteristics and regional effects. The self-reported price of an individual smoker is used in a random-effects regression model to impute price and to construct the price ratio for discount and premium brands for each smoker, which is used in the logit model.
Findings An increase in the ratio of price of discount brand cigarettes to the price of premium brands by 0.1 is associated with a decrease in the probability of choosing discount brands by 0.08 in Canada. No significant effect is observed in case of the USA.
Conclusions The results of the model explain two phenomena: (1) the widened price differential between premium and discount brand cigarettes contributed to the increased share of discount brand cigarettes in Canada in contrast to a relatively steady share in the USA during 2002–2005 and (2) increasing the price ratio of discount brands to premium brands—which occurs with an increase in specific excise tax—may lead to upward shifting from discount to premium brands rather than to downward shifting. These results underscore the significance of studying the effectiveness of tax increases in reducing overall tobacco consumption, particularly for specific excise taxes.
- Economics
- Price
- Taxation
Statistics from Altmetric.com
Introduction
There is widespread recognition of the importance of taxation as one of the most effective measures of tobacco control and its demonstrated value as a public health policy in preventing tobacco-related disease and death.1 ,2 A tax increase is expected to raise the retail price of cigarettes and the increased price has proven to cause some smokers to quit, lower the likelihood that non-smokers will begin to smoke and lower the average consumption of those who continue to smoke.3
The taxation of tobacco products, however, may not be as effective in curbing tobacco consumption as it is intended to be, owing to compensatory behaviour among smokers to maintain the affordability of tobacco products in response to price increases. The study of compensatory behaviour of smokers has appeared in different forms of altered smoking behaviour in the literature, such as by smoking cigarettes that are longer and higher in tar and nicotine content,4 substituting cheaper tobacco products,5–13 purchasing from low-taxed and untaxed sources of cigarette14 or switching to roll your own or discount brand cigarettes.14–17 Such compensatory behaviour would diminish the expected reduction in cigarette consumption and would, in turn, dampen the impact of any tax-induced price increase on public health outcomes. As for example, a study on Chinese smokers confirmed that the intention to quit smoking is lower among smokers who use less expensive cigarettes, implying weaker price sensitivity of smokers.18
Using data from the first four waves of the International Tobacco Control (ITC) Policy Evaluation Survey in Canada and the USA during 2002–2005, the present article examines the brand choice behaviour of smokers in these two countries by the classification of cigarettes into discount and premium brands. The objective is to understand how changes in the relative price of these two types of brands can affect smokers’ choice of the lower price option of discount brands. Typically, one would expect smokers to switch downwards to discount brand cigarettes in order to compensate for tax and price increases. However, this may not necessarily be the case if the relative price of premium brands falls as a result of tax and price increases, in which case smokers would be induced to switch upwards. This is expected under specific tax system which implies a constant price increase across brands when tax is increased and reduction in the relative price of higher-price brands. The idea of this article is to test the validity of this hypothesis using data from Canada and the USA.
Methods
Description of data
The data used for the analysis come from ITC surveys conducted in Canada and the USA in four annual waves between 2002 and 2005. It is a longitudinal survey conducted by random-digit dialling telephone interviews of more than 2000 representative adult smokers (18 years or older) from each country. The survey questionnaire is uniform across the two countries, permitting the use of comparable variables for cross-country analysis. Details of the methods used in ITC surveys are presented in Thompson et al.19
The data collected on individual smokers include average daily consumption of cigarettes, brand of cigarettes, source and volume of purchase, the prices they paid per unit of purchase (loose or in packs or cartons), use of discount coupons, household income, level of education, age, gender and region of residence (state, province, etc). The price per unit of purchase of packs or cartons is converted to price per stick of cigarette by dividing the unit price of purchase by the number of cigarettes contained in each unit. The prices reported in 2002, 2003 and 2004 are adjusted for inflation and converted to 2005 prices for each country using the Consumer Price Index from Organisation for Economic Co-operation and Development statistics.
The brand of cigarettes reported by the smokers of factory-made cigarettes is categorised as ‘premium’ and ‘discount’ for the two countries on the basis of manufacturer-specific classification of the cigarettes they market. Much of this information was collected through the documents and advertisements of tobacco companies published on their respective websites. A complete list of these brands is provided in table 1. The summary statistics of pooled data from four waves of all the variables used for analysis are presented in table 2.
List of premium and discount brands of factory-made cigarettes in Canada and the USA
Summary statistics of sample characteristics in Canada and the USA, 2002–2005
Cigarette price and brand
The average prices per cigarette of premium and discount brands reported by smokers in the ITC Survey over the years under observation are presented in figures 1 and 2 for Canada and the USA, respectively. It appears from figure 1 that the price gap widened in Canada over time from 4 cents per stick in 2002 to 6 cents per stick in 2005, which resulted in lowering of the price ratio of discount to premium brand cigarettes. The Health Canada statistics of 2006 also show that discount brand cigarettes cost $10–$20 less per carton or $1.25–$2.50 per pack, that is, 5–10 cents per stick for 25 stick packs.20 In contrast, as shown in figure 2, the prices of discount and premium brand cigarettes in the USA converged over this period.

Average price per cigarette (2005 CAD) by brand of purchase and percentage share of premium and discount brand factory-made cigarette consumption in Canada, 2002-2005.

Average price per cigarette (2005 USD) by brand of purchase and percentage share of premium and discount brand factory-made cigarette consumption in the United States, 2002-2005.
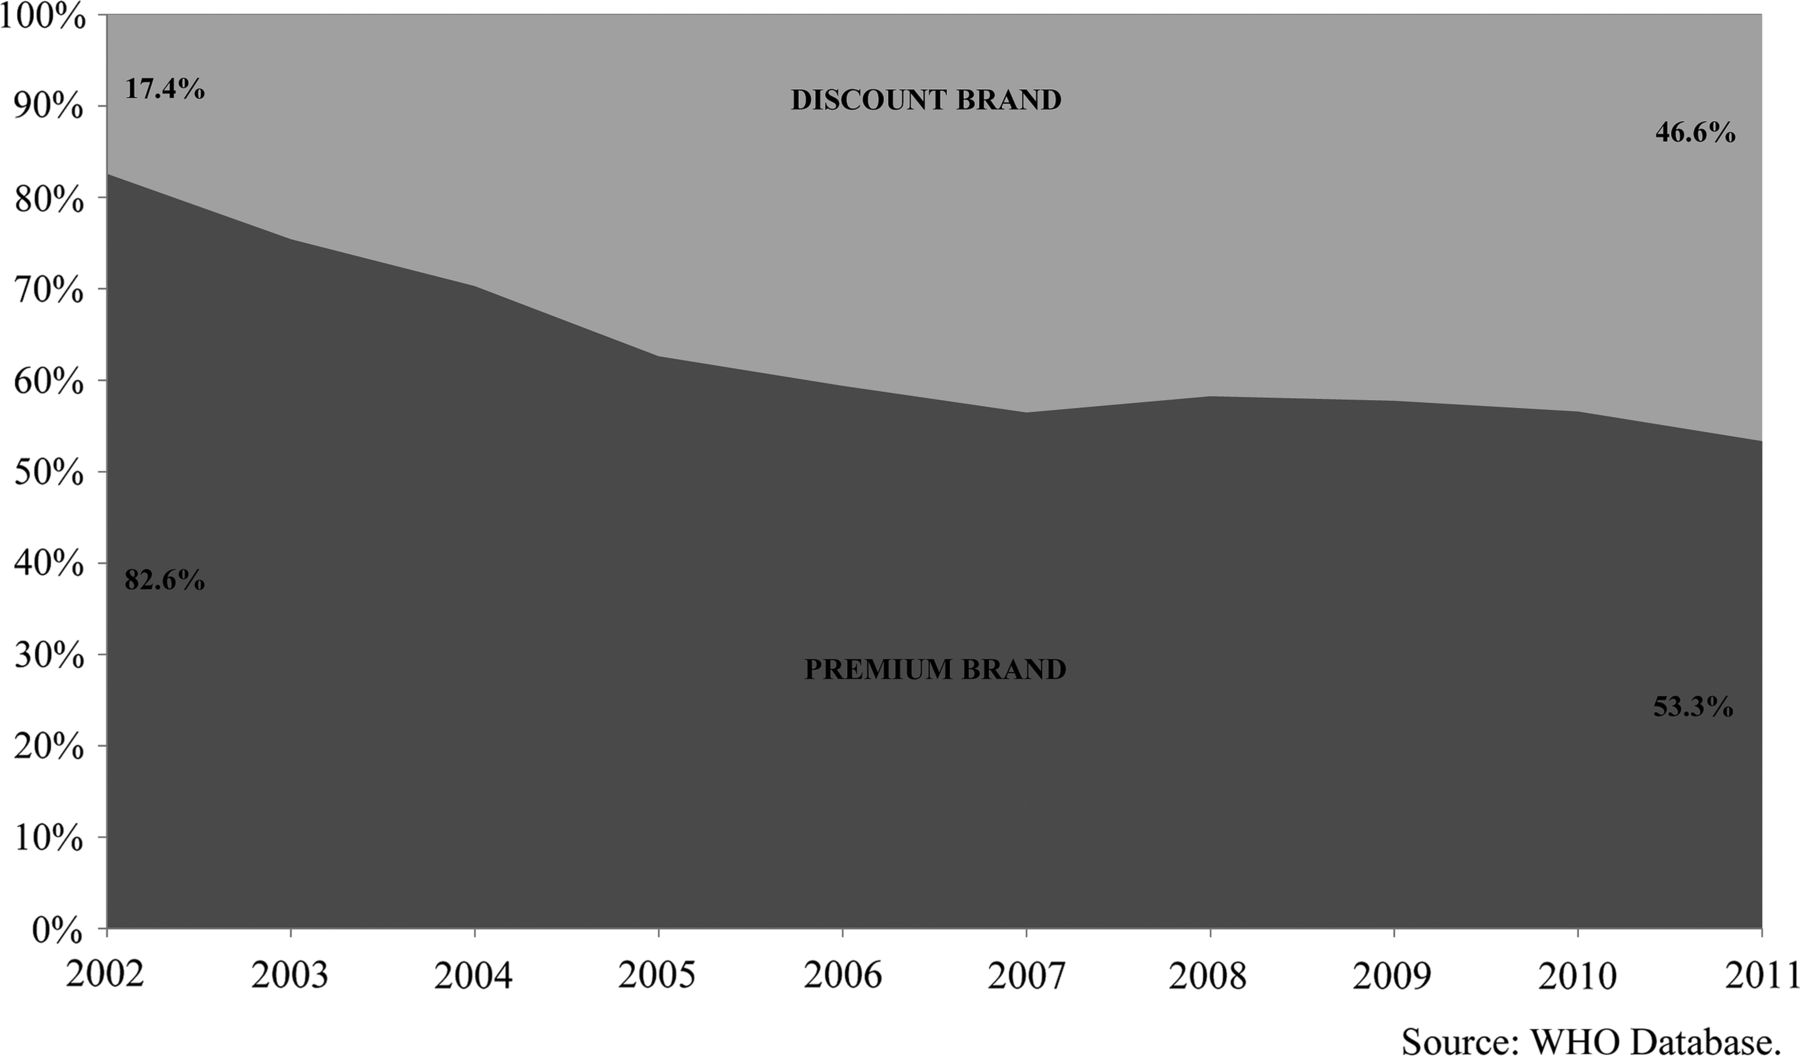
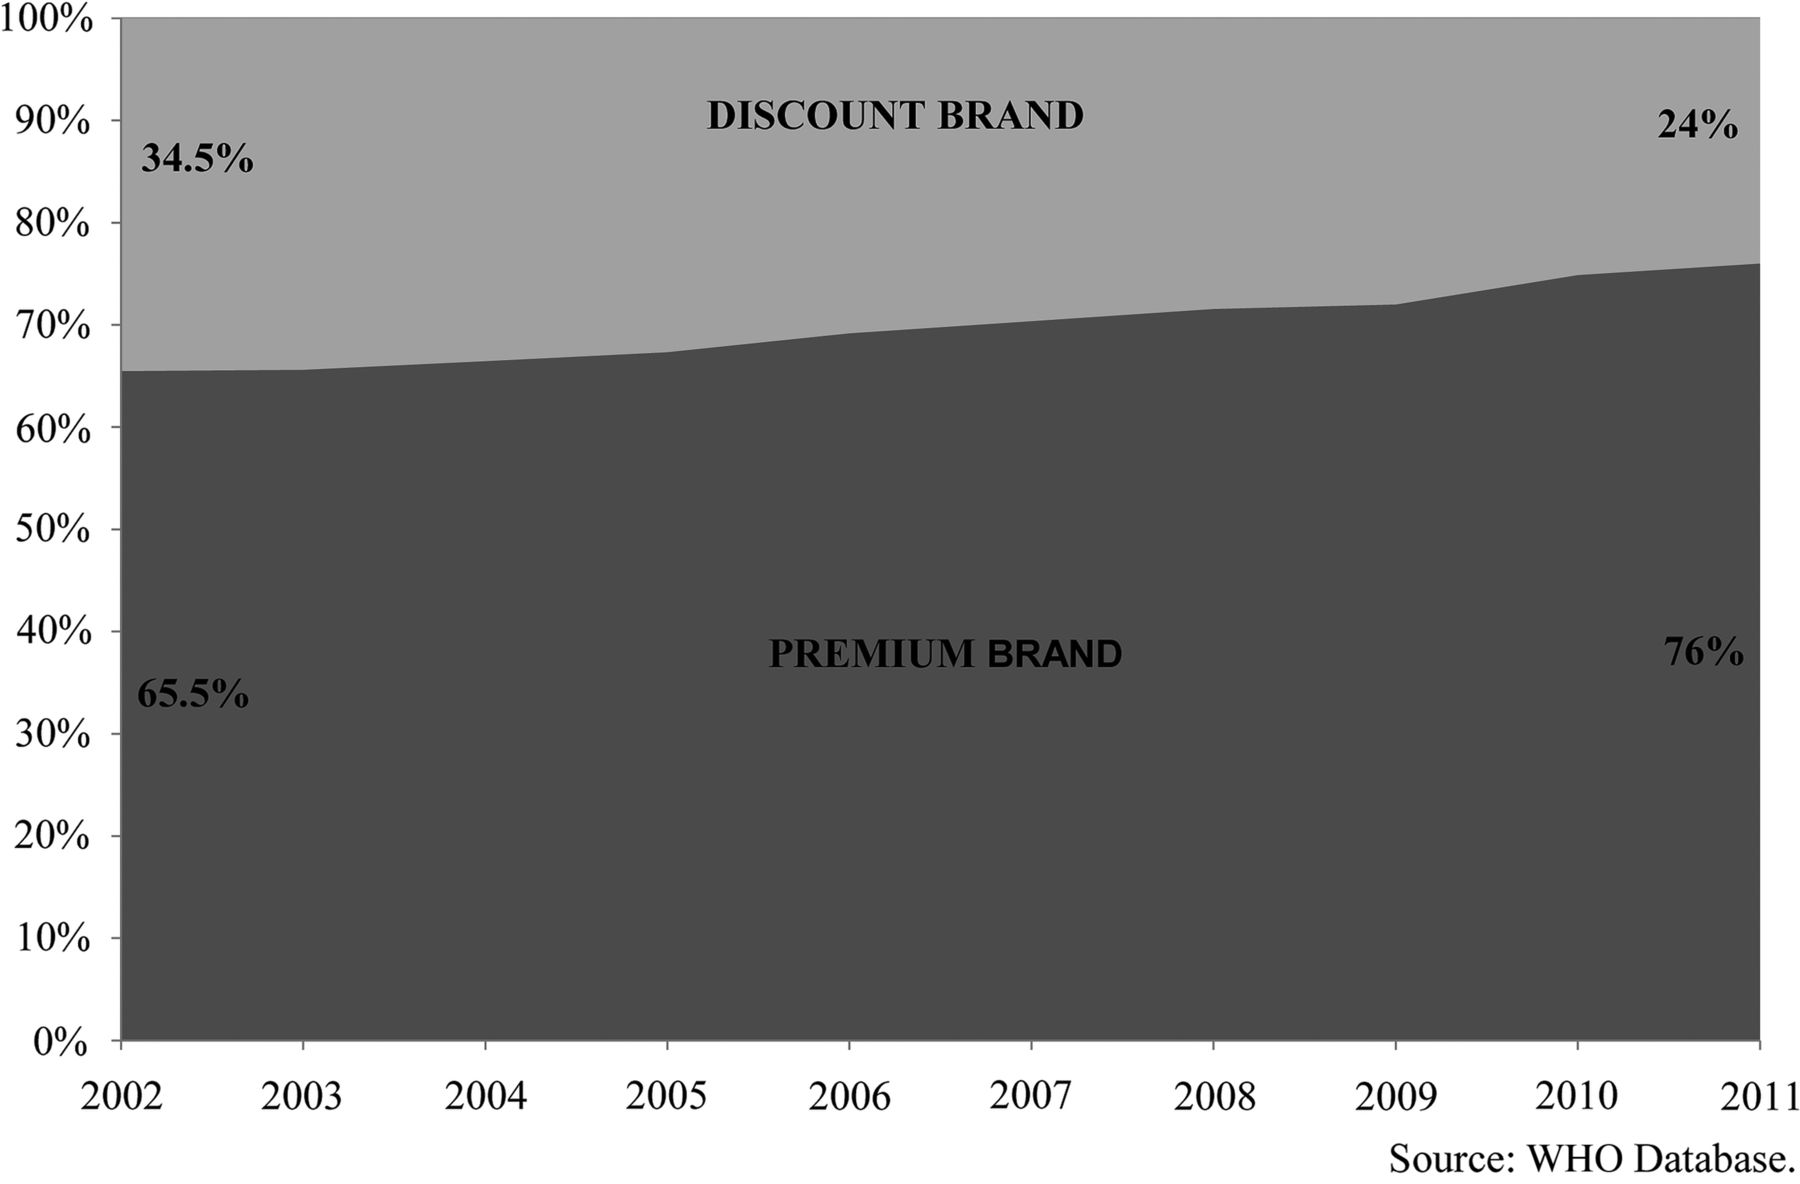
The ITC Survey shows that in Canada, the percentage of discount brand cigarette consumption among factory-made cigarettes increased from 17.6% in 2002 to 42.2% in 2005. In contrast, the share of discount brand cigarette consumption in the USA fell from 30.7% in 2002 to 29.8% in 2005. The shares of premium and discount brand consumption by year of observation are presented in the secondary vertical axes in figures 1 and 2 for Canada and the USA. The upward trend in the market share of discount brand cigarettes in Canada and the downward trend in the USA continued until 2011, as shown in figures 3 and 4, respectively, based on Euromonitor International Ltd data.

The market share of premium and discount brand cigarettes in Canada, 2002–2011.

The market share of premium and discount brand cigarettes in the United States, 2002–2011.
Before 2003, the market for discount brand cigarettes in Canada was occupied by about two dozen small tobacco companies manufacturing at lower production costs and selling cigarettes at cheaper rates than the premium brands marketed by the leading producers. The total market share of discount factory-made cigarettes was 2% in 2001, which went up to 12% in 2002.21 According to a different source, the share of discount brand cigarettes was somewhat smaller, around 8% by the end of 2002.22 The growth of the smaller manufacturers of cigarettes was clearly visible in the number of cigarettes produced by the largest of the smaller manufacturers, Grand River Enterprises (GRE), over this period. The production of GRE was 4500 cases in January 2001, 10200 cases in January 2002 and 25 600 cases or 250 million cigarettes in January 2003.21
In response to the growing market share of the smaller cigarette companies, the major manufacturers in Canada began introducing discount brands. In February 2003, Rothmans, and Benson & Hedges reduced the price of their Number 7 brand cigarettes, which occupied 5.8% of the market share of manufactured cigarettes in that year, by about $1.23 Imperial and JTI-Macdonald soon developed their own discount brands within 18 months. In total, discount factory-made cigarettes dramatically increased their market share in Canada from 10% in 2003 to 40% in 2005.24 According to Canadian Tobacco Use Monitoring Survey (2005), the percentage of current smokers who purchased discount brands within the 6 months prior to the survey was 36%.25
The US cigarette market experienced this type of dramatic change in the composition of factory-made cigarette market much earlier, in the 1980 s and 1990 s, with the introduction and spread of discount and deep discount brand cigarettes and the increased use of price-related promotions.15 ,26 The market share of discount cigarettes rose from almost none in the early 1980 s to about 40% in the early 1993, and then went down to 27% in 1997.27 As the ITC data show, this share did not exceed 30% until 2005.
The period of observation in the present study from 2002 to 2005 coincided with the implementation of several statutes complementary to the provisions of the 1998 Master Settlement Agreement (MSA) in the USA in response to growth in the market share of manufacturers not participating in the MSA (NPM). Despite provisions in the MSA keeping NPMs from having a significant cost advantage, loopholes in the MSA and non-compliance by NPMs gave them a cost advantage over participating firms, keeping their prices well below those of participating manufacturers. The better enforcement of the MSA regulations using complementary legislations prevented the non-compliance of NPMs to a great extent, a trend that helped the price gap between premium and discount brand cigarettes stabilise in the early 2000 s.27 However, the market share of cigarettes made a marked shift from discount to premium brands later in the decade, which is more likely an outcome of the largest federal cigarette tax increase that occurred in April 2009.
The rise in discount brand cigarette market share in Canada was accompanied by a large-scale migration of smokers from premium brand to discount brand use. This is evident in the joint distribution of smokers by brand of last purchase of cigarettes in two successive waves of the ITC Survey reported in table 3. Among smokers who reported to have purchased premium brand cigarettes in 2002, 5.3% switched to discount brands in 2003, 21.7% by 2004 and 28.2% by 2005. Similarly, among smokers who bought premium brand cigarettes in 2003, we found that 20% switched to discount brands in 2004 and 26.6% by 2005. Between 2004 and 2005, 10.9% smokers switched from premium to discount brands. These results suggest that the spike in the rise of discount brand cigarette use occurred during 2003–2005. In the USA, the percentage of smokers switching from premium to discount brands was steady at 3–5% and was no more prevalent than the percentage switching from discount to premium brands.
Percentage of smokers by brands of cigarettes purchased in two consecutive waves in Canada and the USA, 2002–2005
Model of choice of cigarette brand
After an individual decides to smoke, she/he decides on the brand of cigarettes to use. This choice depends on the relative price of brands as well as the demographic and socioeconomic characteristics of individual smokers that set individual preference for higher or lower price products and product quality. Individuals may also respond to sales promotions offered by tobacco manufacturers as incentive to purchase certain brands. Individual preference for a particular type of brand may shift over time for reasons such as fashion, the entry of a new brand in the market, increase in market concentration and the like. For a random draw of individual i observed in year t, we can write the following logit equation corresponding to the decision to choose cigarette brands: 1
1
Here, B takes the value of 1 if a smoker smokes discount brand cigarette and 0 if she/he smokes premium brand, X is a vector of observable explanatory variables, β is the vector of parameters corresponding to the regressors X and e represents the random unobservable influences on the choice of brands. We can rewrite equation (1) in regression form of the log of the OR of choosing discount brands to choosing premium brands as follows:
 2
2
In the estimation of equation (2), we do not control for individual-specific fixed effects because the real price variable individuals face within a short period of time does not vary much for a specific person. This makes the fixed effect estimate of the effect of price on the choice of brand statistically insignificant. However, we adjust the SEs of estimates for individual-level correlation of error terms by using multiple observations on individuals as clusters.
In equation (2), we are particularly interested in the marginal effect of the change in the relative prices of discount and premium brands on the choice of brands. It is expected that if the relative price of discount brand gets higher, the probability of smoking discount brand cigarettes will be lowered. Conditional on smoking participation, it implies greater probability of smoking premium brand cigarettes, that is, upward trading to premium brands.
In calculating the price ratio, the self-reported price of one’s own brand and the imputed price of the alternative brand that one does not smoke can be used. For example, in case of a discount brand user, the price of premium brand is imputed using information of premium brand smokers; and for a premium brand smoker, the price of discount brand is imputed using information of discount brand smokers. The prices of discount and premium brands are imputed using the following linear regression separately for the discount and premium brand smokers: 3
3
where P is the self-reported price per pack of cigarette purchased, X is the same set of explanatory variables as in equations (1–2), RES represents the categorical variables indicating the region of residence of smokers, a represents the individual specific random error component in self-reported price that is uncorrelated with other observable characteristics of individuals and u stands for the random unobserved disturbances in the determination of price.
In equation (3), the random effect a controls for the reporting error that may arise from various sources (eg, from recall bias). It is assumed that the reporting bias remains constant over time, that is, individuals who understate (overstate) the price they paid systematically understate (overstate) price in repeated observations over time. In order to eliminate the reporting bias, the price ratio is constructed by using prices of used brand and alternative brand predicted from equation (3). Thus, we estimate two versions of the choice of brand equation (2)—one with the price ratio constructed from self-reported price of used brand and the predicted price of the alternative brand, and the other with the price ratio constructed from the predicted prices of both used and alternative brands. More formally, the first measure of price ratio is given by the following:
The second measure of price ratio is given by the following:
It should be pointed out here that both the choice of brand and the self-reported price may be driven by a third variable, which is the quality of cigarettes. Failing to control for this unobservable factor may introduce endogeneity in the relative price variable and bias the estimated coefficient. The second measure of the price ratio based on the predicted prices of both used and alternative brands addresses this possible endogeneity bias.
Results
Cigarette prices
The price equation (2) is estimated for premium and discount brand cigarettes using the random-effects method. The results for Canada and the USA are compared in table 4. The price ratio estimated by dividing the price of discount brands by the price of premium brands, both predicted from the estimated price equations presented in table 4, ranges from 0.73 to 1.06 with a mean of 0.88 for Canada. For the USA, this ratio varies from 0.45 to 1.03 with a mean of 0.74.
Random-effects estimation of price equation for premium and discount brand cigarettes in Canada and the USA, 2002–2005
Choice of cigarette brands
The probability of a smoker choosing a discount or a premium brand cigarette is significantly influenced by the price of discount brand cigarettes relative to premium brands as shown in Model 1 in table 5 for Canada and the USA. When the self-reported price of used brand is replaced with the predicted price in constructing the price ratio (Model 2), the estimate shows negative effect of the ratio of discount to premium brand prices on the probability of choosing discount brands with a larger magnitude in Canada. The larger size of the estimate obtained from Model 2 compared with Model 1 is likely driven by the correction of the endogeneity bias from using self-reported variable of used brand as in Model 1. This coefficient, however, is not statistically significant in case of the USA.
Marginal effects from the logit model of probability of using discount brand cigarettes in Canada and the USA, 2002–2005
To understand what the magnitude of the estimated coefficient of the price ratio indicates, suppose the initial price per pack of premium brand cigarette is $7 and the initial price per pack of discount brand is $6, so that the ratio of the discount brand price to premium brand price is 0.857 (=6/7). If the specific tax per pack increases by $1 and the tax is fully shifted to consumer so that the new prices are $8 per pack for premium brands and $7 per pack for discount brands, the price ratio increases to 0.875 (=7/8). Given the coefficient of the price ratio for Canada at −0.782, the effect of the increase in the price ratio from 0.857 to 0.875 would be −0.782×(0.875–0.857)=−0.014. It means that a $1 increase in specific excise can reduce the probability of using discount brand cigarettes by 1.4%, as discount brand smokers switch to premium brands.
The negative sign of the effect of changes in the price ratio of discount to premium brand cigarettes on the probability of choosing discount brand cigarettes implies that as excise tax increases uniformly across all brands, the percentage gap between premium and discount brand prices narrows. As a result, the relative gain from buying discount brand cigarettes shrinks creating incentive to choose premium brands over discount brands. This finding conforms to the evidence from a recent report published by United Bank of Switzerland (UBS) Investment Research that increasing state excise tax rates in the USA resulted in shift in the market share towards premium brands due to narrowing of the price gaps.28 According to this report, the average cigarette price gap between premium and discount brands is highest and the market share of premium brand cigarettes is lowest in the states with the lowest excise tax per pack. The average price gap is 52% for tax rates below $0.50, 46% for $0.51–$1.00, 37% for $1.01–$1.50 and 27% for above $1.50, while the corresponding market shares of premium brands are 80%, 85%, 85% and 94%.
Discussion
Using data from the first four waves of the ITC Survey in Canada and the USA between 2002 and 2005, this article examines the role of the price of discount brand cigarettes relative to the price of premium brand cigarettes in the choice of discount brand cigarettes by smokers. We find that a lower ratio of discount brand price to premium brand price tends to increase the likelihood of smoking discount brand cigarettes. This result confirms that the widened price differential between premium and discount brand cigarettes was a major cause of an increased share of discount brand cigarette consumption in Canada in contrast to a relatively steady share in the USA during the period under observation (2002–2005). As smokers who switch to discount brands are less likely to quit,15 one can expect that a change in the relative price of cigarette brands in favour of the use of discount brand cigarettes would lead to lower quit rates and greater smoking prevalence. Supporting policy measures are needed to curb the expansion of the discount brand market by controlling the underlying price-cutting strategy of cigarette manufacturers as has happened in Canada accompanying the tax and price increases in the 2000 s.
This result also implies that increasing the price of discount brands relative to the price of premium brands induces smokers to trade up to premium brands, as standard economic theory would suggest that choices are made based on relative prices. This finding stands in contrast with the conventional wisdom about the compensatory behaviour of smokers that higher tax and price would induce smokers to switch to discount brands as a price-minimising strategy.2–10 In countries, such as the USA and Canada, where taxes are specific and the same per unit tax applies to all brands, a given increase in the tax and a full pass-through of the tax increase to price would raise the price of discount brands relative to premium brands. The estimated model of choice of brand predicts that this would reduce the smoking of discount brand cigarettes and create an incentive to switch from discount to premium brands. Indeed, this has been the case in the USA where specific tax increases reduced the market share of generic (lower-priced) brands significantly in the 1980s and 1990 s.29 Upward switching has not previously been seen as a possible response to higher prices, but the present model shows that upward switching naturally follows from the consideration of the change in the price ratio rather than change in average price, and that this phenomenon would be expected to occur under specific tax regimes rather than under ad valorem tax regimes, where an increase in base price does not change the price ratio.
One data limitation of the analysis undertaken in this article is that the smokers of premium brands do not report the market price they face for discount brands and vice versa. This has led us to estimate a price equation to impute the unobservable price and then use it for the estimation of the relative price of discount to premium brand cigarettes. The ability to control for the price of discount brands for premium brand smokers and the price of premium brands for discount brand smokers depends critically on a well-specified equation imputing price. Besides, the estimated coefficient of the relative price variable differs remarkably between the two approaches we take for estimating the price ratio. For Canada, the estimate is −0.18 when we use self-reported price of used brand in contrast to −0.782 when we use imputed price of used brand along with imputed price of the alternative brand. In case of the USA, the estimate is −0.202 when we use self-reported price of used brand, while it becomes −0.308 and statistically insignificant when imputed price of the used brand is used. Thus, the results appear to be sensitive to the use of self-reported or imputed price of the used brand in the construction of the relative price.
The second limitation is that the data available for the brand used by a smoker refer to the one they smoke more than any other. The identification of a single brand used by a smoker may not reflect the true preference pattern of a smoker if the smoker frequently switches between premium and discount brands.
Finally, the choice of the period from 2002 to 2005 is critical for the finding of the study because this is the period when Canada experienced a remarkable shift in the discount brand market share, while the US market stabilised following better enforcement of the MSA. After 2005, the shifts are not going to be as dramatic. This created a perfect experimental situation for us to test our hypothesis.
Conclusion
The present article underlines the significance of studying the effectiveness of tax increases in reducing overall tobacco consumption, keeping in view the effect of tax and price increases on the brand choice behaviour of smokers. Under a tax system comprised entirely of uniform specific tax, a tax increase can result in upward switching from low-priced to higher-priced brands due to a rise in the relative price of lower-priced brands. If a system comprised entirely of ad valorem tax, then an increase in the tax rate would maintain the same relative prices and would have no impact on brand choice, all else remaining the same. If the tax system is a mix of ad valorem and specific taxes, the price gap is larger in countries that rely more heavily on ad valorem tax.30 Under this system, the price gap still narrows a bit as the tax goes up, due to the specific component, and creates incentive to switch upwards. Evidence from European Union countries suggests that under a more complicated tiered system, there is a potential for the price gap to increase as taxes increase, for example, when the rates at the top end rise by relatively more than on the bottom end. While focusing on the implications for the specific tax regime in force in the two countries included in the present study, this article points to the need for similar research in countries with ad valorem, mixed or more complicated tax structures.
What this article adds
-
This article investigates the choice by smokers of premium and discount brand cigarettes in response to tax and price increases based on a model that focuses on the behavioural impact of the price ratio of discount to premium brands. We estimate the model using longitudinal data from representative samples of smokers in Canada and the USA. This model explains why an increase in the tax rate and price that raises the relative price of discount brands may result in upward switching from discount to premium brands as happened in the USA during the 1990 s, or conversely, why the share of discount brand cigarettes increased in Canada in response to declining relative price of discount brands during 2002–2005. Upward switching has not previously been seen as a possible response to higher prices, but the present model shows that upward switching naturally follows from the consideration of the change in the price ratio rather than change in average price, and that this phenomenon would be expected to occur under specific tax regimes rather than under ad valorem tax regimes, where an increase in base price does not change the price ratio.
Acknowledgments
We are thankful to Anne C. Quah for the editing and formatting input.
References
Supplementary materials
Chinese Version
Files in this Data Supplement:
- Chinese version - BMJ Publishing Group Limited takes no responsibility for the accuracy of the translation from the published English original and is not liable for any errors which may occur.
Footnotes
-
Contributors NN undertook the research for this article as her postdoctoral research under the supervision of GTF and FJC. QL contributed to the classification of cigarette brands, which is part of his doctoral dissertation. All authors reviewed and approved the final version of the manuscript.
-
Funding Funding for the research presented in this article was provided by the Canadian Institutes for Health Research (Operating Grants 57897, 79551 and 115016 and a CIHR Strategic Training Program in Tobacco Research: Post-Doctoral Fellowship to the first author), the U.S. National Cancer Institute (R01 CA100362, the Roswell Park Transdisciplinary Tobacco Use Research Center (TTURC; P50 CA111236) and P01 CA138389), Robert Wood Johnson Foundation (045734) and a Senior Investigator Award from the Ontario Institute for Cancer Research to the second author.
-
Competing interests None.
-
Patient consent Obtained.
-
Ethics approval The ITC surveys were cleared for ethics by research ethics boards or international review boards at the University of Waterloo (Canada), Roswell Park Cancer Institute (US) and University of Illinois at Chicago (US).
-
Provenance and peer review Not commissioned; externally peer reviewed.