Article Text

Abstract
OBJECTIVES To outline the design and present selected findings from the evaluation of a state counter-advertising, anti-tobacco media campaign. The appropriateness of the design for states developing media evaluations is discussed.
DESIGN Four cross sectional, telephone surveys of the 12–17 year old population were used to track and monitor advertising and campaign awareness, confirmed awareness, and receptivity. The Florida baseline and one year surveys were used with two parallel national surveys in a quasi-experimental design to assess attitude and smoking related behaviour change attributable to the campaign.
MEASURES Awareness was measured by self report, confirmed awareness by unaided description, and receptivity by self reports of how well advertisements were liked, talked to friends about, and made one think about whether or not to smoke. Eleven attitude and three smoking behaviour items for Florida (treatment) and a national (control) population were compared at baseline and after 12 months.
RESULTS Significant increases in ad specific awareness, confirmed, receptivity, and campaign awareness, and confirmed awareness were reached by the sixth week. They continued to rise through the first year. No attitude and only minor behaviour differences were noted between the treatment and comparison populations at baseline. By the end of the first year, Florida youth had stronger anti-tobacco attitudes and better behaviour patterns than the comparison population.
CONCLUSIONS The industry manipulation strategy used in the Florida campaign resulted in high rates of recall, significant changes in attitudes/beliefs, and reduced rates of smoking behaviour among youth.
- anti-tobacco advertising campaign
- youth
- Florida
Statistics from Altmetric.com
In August 1997 Florida and five tobacco companies announced an $11.3 billion settlement recovering Medicaid funds for smoking related illnesses.1 The state set up a multi-component tobacco pilot programme (TPP), targeting youth aged 12–17 years.2 3 The components include in-school education, enforcement, a school based youth organisation, community based organisations, and the cornerstone, an aggressive, well funded, counter-advertising programme grounded in an industry manipulation theme. The TPP's primary objective, and the objective of the media programme, is tobacco use prevention. TPP staff worked with Florida youth, media, and public relations contractors to develop campaign substance, and with Centers for Disease Control (CDC) staff and evaluation contractors to develop an evaluation plan.
This plan included an annual, self administered, statewide youth tobacco survey (FYTS) conducted in public schools. The primary objective of this survey is to track and monitor the prevalence of tobacco use at multiple geographic levels. The plan also included a series of telephone surveys, the objective of which is to evaluate three dimensions of the media campaign. First, to provide population based estimates of the reach and penetration of individual advertisements (ads) and the campaign's major message. Second, the surveys are to gauge target population reactions to individual ads, and third, they are to evaluate the effects of the ad campaign on anti-tobacco attitudes and smoking behaviours. With respect to the latter, all parties agreed that official estimates of tobacco use prevalence would come from the FYTS.
The objectives of this paper are to outline the methodology developed to evaluate the media campaign, and report the effectiveness of the campaign in terms of each evaluated dimension.
Methodology
DESIGN
The tracking, monitoring, and target reaction functions of the evaluation were planned around four surveys. A baseline was conducted before the campaign's launch in April 1998. It collected data on awareness and confirmed awareness (CA) of anti-tobacco ads, media messages, anti-tobacco attitudes, tobacco use behaviours, and ancillary demographic, household, and lifestyle parameters. The second survey—the Florida anti-tobacco media evaluation (FAME)—was conducted about six weeks into the campaign. This survey's objective was to measure initial campaign message penetration and youth reactions to ads so it was much shorter than the baseline. Two additional first year surveys were planned for September 1998 (six months into the campaign) and May 1999, the end of the campaign's first year. The questionnaire used in the six and 12 month surveys closely parallelled the baseline. Through the first year ad gross rating points averaged about 1600 per quarter. By multiplying reach times frequency of exposure this suggests there were about 16 planned exposures per quarter. It is important to realise that this measure does not indicate the number of times an ad is seen by a member of the target population. Rather, it represents the number of times all persons may see an ad based on an estimate of all viewers at a time when an ad is aired.
To assess whether the media campaign was changing anti-tobacco attitudes/beliefs and tobacco use behaviours a quasi-experimental design was adopted. This design involved identifying a population that parallelled the Florida target except for its exposure to the (treatment) media campaign. Only four states (Arizona, California, Massachusetts, Oregon) had launched, or were thought to possibly launch, organised, large scale, anti-tobacco programmes with notable media components. A number of studies show that cohorts of young people across the USA have become more similar in their attitudes, behaviours, and lifestyles4-7 so the comparison (control) population adopted was 12–17 year olds in states excluding the above four. Representative samples from the comparison population were interviewed at baseline and 12 months using instruments that parroted the FAME survey.
In short, the evaluation design included six surveys: four of the treatment population, and two of the comparison national population. FAME survey content was designed to track and monitor the reach, penetration, and receptivity of ads and the campaign's message theme, and to assess how changing levels of reach, penetration, and receptivity are related to anti-tobacco attitudes/beliefs and behaviours. The national surveys were timed and designed to allow parallel measurements in the control population not exposed to the “truth” campaign.
SAMPLES
An array of potential sampling frames was considered including random digit dialling, “cleaned” lists of random numbers, and targeted random numbers to rosters of public school students from Department of Education records, school directories, and household records maintained by the National Center for Health Statistics for their ongoing data collection programme. The random dialling methods were ruled out early. The reasons for this are discussed in detail elsewhere,8 but related to Florida's unique demographic structure, and the desire to have population, not household, based samples. Other potential sampling frames were ruled out by legal or bureaucratic restrictions, or concerns over their representativeness.
Another venue for sampling frames considered was the purchase of a vendor generated list. One such vendor specialises in the school age population.8 We were able to determine that their files contained an estimated one half of persons in the targeted ages in Florida. The sources from which they obtain their information include both public and private school directories and yearbooks, as well as camps, clubs, and community based organisations providing charitable services as well as subscription lists and other market research sources. The vendor's files include name, address, telephone number, sex, ethnicity, and expected graduation date. This information was used to generate a randomly selected list of names stratified to be representative of the target by region, sex, ethnicity, and age. This source offered the added advantage of allowing us to refer to a specific individual by name as each call was made. The vendor maintains an office in each state that is responsible for assembling state data and reporting it to a central office. We estimated coverage for individual states varies from about 15% to over 65% with the lowest percentages in states with the smallest populations.8 To resolve this problem for the national samples, we aggregated state data to census regions and stratified on the parameters used for Florida. Comparisons with the latest available estimates showed no significant differences for either sample and their referent population along a number of dimensions not stratified for including percentage living in a single parent/guardian household and percentage attending private/public schools. Targeted sample sizes were 1800 for the FAME surveys and 1000 for the national surveys.
TELEPHONE PROCEDURES
Interviewers were college students and teachers who received six hours of training, and were required to pass a “test interview”. Interviews were conducted in English or Spanish. Average completion time (except for the shorter June FAME) was under 25 minutes. All interviews began with a scripted message asking for the parent or legal guardian of the target child by name. Up to five callbacks were made to reach the parent. Parents were informed of the call's purpose and that their child would receive a payment of $12.50 for participating. If the parent/guardian gave consent, and the child was present, we immediately spoke with the child. If the child was not present, or was unable to participate at that time, a callback time was arranged. Up to five callbacks were made per child. Youth interviews began with an informed consent statement.
An analysis of response rates, and the characteristics of youth by parent and youth refusal, was completed. We found no significant differences between surveys on any of the factors considered.8 9 Refusal rates at the parent level have averaged less than 10%; at the child level less than 6%. However, parents of young females have consistently been more likely to refuse permission than both all parents and parents of young males. Refusal rates for this group have still been low (under 13%). After allowing for callbacks, one out of every 1.397 numbers called produced an interview; the average response rate was just under 69%. At the end of each interview, respondents were asked if they would be willing to be interviewed again; 98% gave positive replies. Interviewers self assessed each interview on three dimensions. Interviewers reported they had reason to believe someone was listening in or present in the immediate area for 8.5% of interviews, and for about 21% of these, that the respondent appeared bothered or distracted by this. This was more likely for middle school youth (12%) than high school youth (8%). There has been no systematic bias in reports of tobacco use between respondents reported having someone listening in or present, and those who did not.9 This could, in part, be a function of placing the tobacco use items at the end of the interview. Interviewers reported fewer than 4% of respondents had difficulty understanding any questions asked.
MEASURES
In the analysis below we focus on campaign CA and ad specific awareness and CA. Attention is given to television (TV) ads because detailed analyses have shown that respondents who were aware and CA of TV ads were also respondents aware of ads delivered by other media forms. That is, few respondents who reported being aware of ads, or who confirmed their awareness of ads delivered by other media, did not also claim awareness and confirm it for TV ads.
Awareness, CA, and receptivity of anti-tobacco ads were measured from one series of items asking about each specific ad in each survey. The first item in this sequence provided reference to a single “cue” within the context of the generally worded item: “Have you recently seen an anti-smoking advertisement that showed ‘cue’?” Respondents who gave a positive reply to this item were coded as aware. To measure CA, respondents were asked two additional items. The first required the respondent to describe details of the ad with no additional cues. The second required the respondent to describe the main message or theme of the ad with no cues. Responses that repeated the cue or that were general (for example, “don't smoke”) were not coded as confirmed. Respondents who were aware of an ad were asked three questions to gauge their reactions to it: did they like the ad, did they talk to friends about it, and did the ad make them think about whether or not they should smoke?
The Florida and the national baselines contained the same three TV ads. These were nationally popular public service announcements (PSAs) that had been developed in Arizona, had a deglamorisation theme, and were available through the CDC media resource centre. The successive FAME survey contained three TV ads. These had industry manipulation themes and were produced by the Florida media contractor. For the one year national survey we worked with the CDC and its distribution contractor to determine what had been the three most frequently ordered TV ads over the year. These ads were used in the one year national survey. In the analysis below respondents were counted as aware and CA if they claimed awareness (or CA) of any ad in a flight.
We also report data for four measures of campaign, as opposed to ad specific, CA; two were derived from unaided items. The first measure was derived from two items. Respondents were asked if they were aware of any anti-tobacco or anti-smoking campaign occurring in Florida. If they replied “yes,” they were asked for the major theme of the campaign to CA. A second item was used to measure campaign “brand awareness”. In the discussion this is referred to as “logo confirmation”. This was measured by asking respondents to indicate what they thought of when they saw the word “truth” inside an oval—the symbol for the campaign. Respondents were coded as CA if they repeated one of the campaign's major themes or tag lines—that is, “our brand is truth, their brand is lies”.
The third measure of campaign CA is a composite of ad CA. In addition to the TV component, the campaign included limited radio, billboard, and display ads as well as promotional items such as stickers, lanyards, hats, and T shirts. Items similar to those used to measure CA of TV ads were used to confirm awareness of each of these. For each FAME survey a composite measure of media campaign CA was calculated by coding each person who confirmed on any one of these or a TV ad as confirmed. The last measure of campaign CA is the percentage of respondents who confirmed on at least one of the three above measures.
Data are also presented for selected anti-tobacco attitudes/beliefs items. Each was asked of respondents in the FAME and national surveys. Respondents were asked to report if they strongly agreed, agreed, disagreed or strongly disagreed with each. In the analysis, these categories are collapsed to agree/disagree. All tobacco behaviour measures are based on self reports.
EVALUATION HYPOTHESES
Two sets of hypotheses were established for evaluation purposes. The first relates to the media programme's reach and penetration of the target, and the target's reaction to it. The first of these hypotheses was set by contractual arrangement; the media contractor was to receive a bonus if CA of the campaign reached 85% by the end of the first year. This was the “tracking hypothesis”. A second hypothesis was that the target would be more receptive to an organised, central theme directed set of ads than PSAs. This hypothesis was grounded in communications theory generally,10-13 and in previous research suggesting the “industry manipulation” theme had a high appeal to youth.14-16 The second set of hypotheses was tested with the quasi-experimental design. These hypotheses postulated a campaign effect would produce greater change in Florida than in the nation: awareness and CA of ads, greater receptivity, more anti-tobacco attitudes/beliefs change, and reduced tobacco behaviours.
Results
CONFIRMED AWARENESS OF THE TRUTH CAMPAIGN
Figure 1 shows the trajectory of campaign CA for four measures over the first year. After six weeks about 40% of youth confirmed awareness of both the major theme and the “truth” logo. These measures (that validate one another) largely moved on the same course through the year with logo CA reaching just under 70% by May 1999. The media programme's reach is illustrated by the parallel movement of the two upper lines. By May 1999, 93% of youth confirmed awareness of at least one ad run in the last flight. Taking all other campaign components into account raised CA only slightly (to about 96%). The first evaluation hypothesis was met by the sixth month (September 1998), and it was exceeded in the last six months.
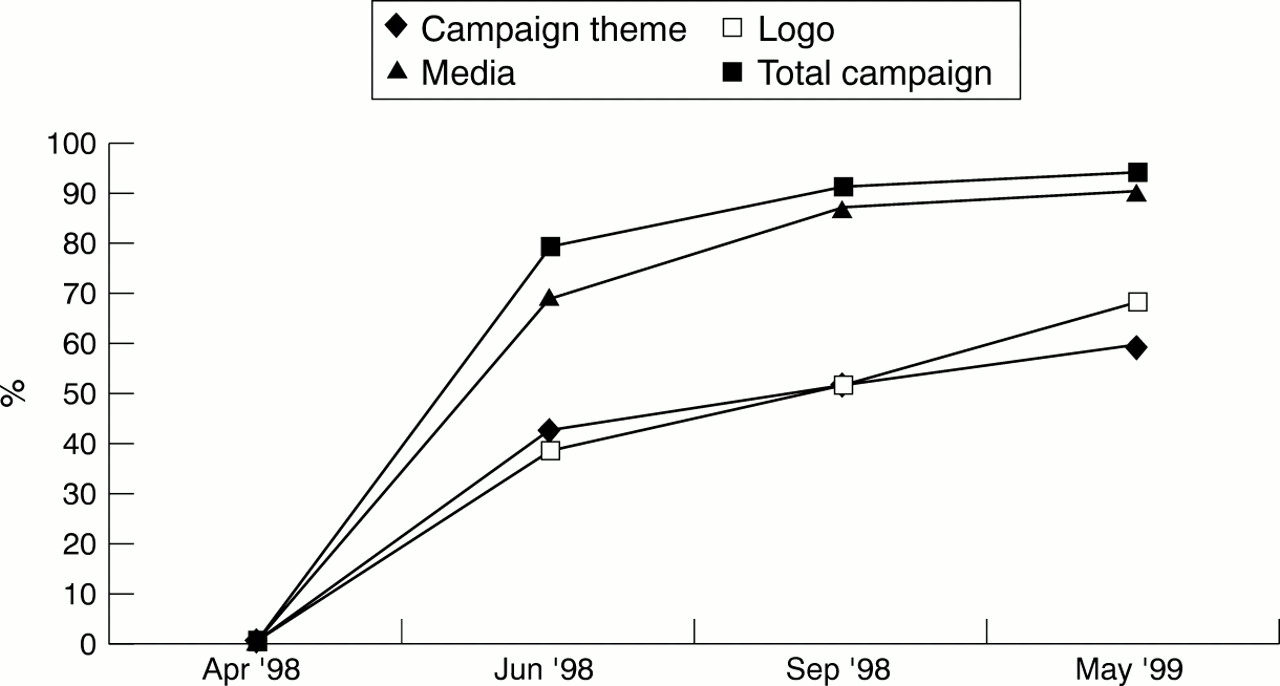
Percentage of Florida samples showing confirmed awareness on four “truth” campaign measures 1998-99.
AWARENESS, CONFIRMED AWARENESS, AND RECEPTIVITY OF TV ADVERTISEMENTS
By the end of the first year nearly 89% of the total (93%) media CA was accounted for by TV ads (fig 2). These data are important for two additional reasons. First, the pre-campaign PSAs ran for roughly an equivalent time as the start of the campaign and the June survey. The state governor used his power to have the pre-campaign PSAs run during prime time and far more frequently than normal for PSAs. Yet, by June the level of CA of “truth” ads was more than double that for the PSAs. Second, the gap between self reported awareness and CA was greater at baseline when the PSAs were run. With each successive survey the levels of self reported ad awareness and CA converged. This suggests that the “hard hitting”, direct, “in your face” industry manipulation “truth” ads produced visuals and messages that were more likely to be retained by the target exposed to them than the milder, humour oriented PSAs.
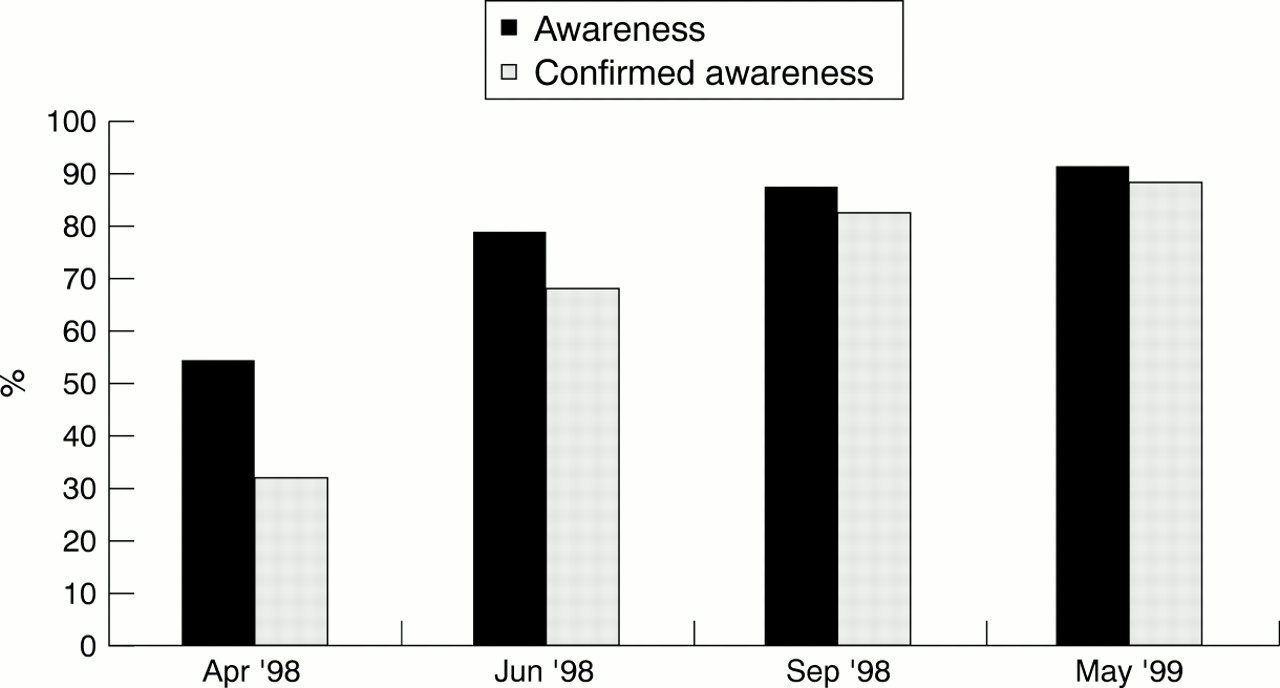
Percentage of Florida samples showing awareness and confirmed awareness of “truth” TV advertisements 1998-99.
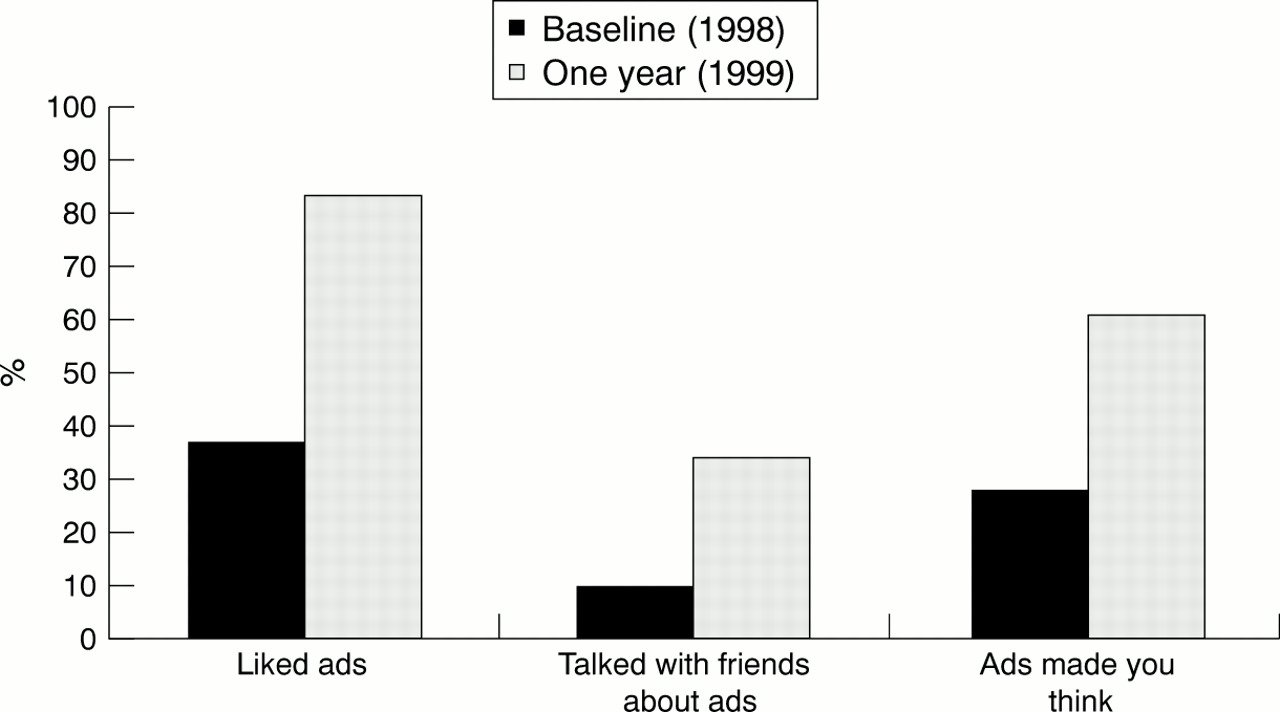
The first set of bars in fig 3 show that before the campaign's start when ads were PSAs, 37% of the target reported liking the ads; after one year 83% reported seeing ads they liked. Similar increases occurred for the other two items measuring how well the target reacted to ads. The percentage reporting television ads which made them think about whether or not they should smoke increased from 28% to 61%, and the percentage reporting talking with friends about ads rose from 10% to 34%.
Percentage of Florida samples showing awareness of combined TV ads and receptivity to the ads 1998-99. Only persons claiming awareness were asked the receptivity items; however, in order to measure target population reaction to the ads the total population is used as the denominator.
FLORIDA/NATIONAL COMPARISONS
Table 1 shows the levels of awareness, CA, and receptivity of anti-tobacco ads at baseline and one year for Florida and the nation. At baseline these were the same three ads, and the higher levels of awareness (54% v 41%) and CA (32%v 6%) for Florida undoubtedly reflect the governor's exuberance to air ads before the “truth” campaign— that is, the higher levels of exposure in Florida suggested by these measures are a function of ads having been run more frequently, and at times when PSAs are not normally aired. This influence is also reflected in the receptivity measures; all were higher at baseline in Florida than the nation. The national baseline figures are probably indicative of what might have been expected in Florida had there been no special airing of PSAs. Even with this baseline distortion the data suggest a “campaign effect”. The level of CA in Florida rose to nearly 89% by year's end. Nationally, it increased to 30%, approximating Florida's CA at baseline. The national increase may reflect the country's rising anti-tobacco sentiment, and the rising acceptability and increased pressure to air anti-tobacco PSAs. By year's end, two receptivity measures were twice as high in Florida as the nation, and the “talked with friends” measure was six times greater.
Percentage of baseline and 1999 Florida and national samples claiming and confirming awareness of anti-tobacco television advertisements and the percentage of those claiming awareness who were receptive1-150
The primary outcome variables are attitudes/beliefs about the tobacco industry and smoking behaviours. At baseline we did not know the specific content of “truth” campaign ads, but we did know they were going to have a general industry manipulation theme. This prohibited tailoring items to ad specific content. The first six statements in table 2 are those used to measure campaign effects on attitudes/beliefs toward the industry. At baseline, there were no differences between the Florida and national populations; by year's end, significant differences existed for all but one (item 4). The differences were the result of significant increases in anti-tobacco attitudes/beliefs in Florida with the exception of items 6 and 4. The former (“tobacco companies use advertising to fool young people”) remained unchanged at about 80%, while declining nationally, and the latter declined in both populations. For three of the industry manipulation items (1, 4, and 6) the national data show a significant change toward pro-tobacco attitudes/beliefs.
Percentage of Florida and national samples agreeing/disagreeing with selected attitude/belief statements at baseline and 1999 by age
Five additional attitude/belief statements are included in table 2(items 7–11). The first (item 7) was included as a baseline measure to determine if the pre-campaign PSAs had any influence. The second (item 8) was included to test the effects of the industry manipulation campaign on anti-tobacco norms. Items 9–11 were included to test target perceptions, and acceptance of the “truth” campaign message delivery. At baseline, two of these items were significantly different for Florida and the nation. Surprisingly, the comparison group was more likely than Florida to indicate (item 7) smoking has nothing to do with being cool, and (item 11) anti-tobacco people are no more honest than pro-tobacco people. After one year the percentage of the Florida target reporting anti-tobacco attitudes/beliefs on each of these items had increased significantly from baseline, except for item 8. Nationally two items (7 and 10) showed increases; three had no changes. Thus, by year's end Florida had a significantly higher percentage of persons with anti-tobacco attitudes/beliefs than the national comparison on all these items, except item 11. On this item the Florida target increased its anti-tobacco level over the year to match the national. These patterns generally hold after age is controlled. The major difference is that younger persons in Florida and the nation had stronger anti-tobacco attitudes/beliefs at baseline, and the Florida target was more likely to develop stronger anti-tobacco attitudes over the year.
For the total populations the prevalence of ever having tried a cigarette and of current cigarette use were not different at baseline (table 3), but significantly more non-smokers in Florida (41%) than the nation (34%) were susceptible to uptake. For all persons in Florida two measures (“ever tried a cigarette” and “susceptibility”) declined significantly during the campaign's first year, but the decline in current cigarette use was not significant. In the comparison group, however, current cigarette use increased by more than it decreased in Florida. For the other two measures there was no change in the national estimates. The data for the total population masks differences between younger and older youth. Among persons under 16 years old the only difference between Florida and the nation at baseline was for susceptibility; non-smoker susceptibility was higher in Florida than nationally. Over the first year, significant declines occurred for each measure among under 16 youth in Florida, while nationally no change occurred in the prevalence of persons who had tried a cigarette or susceptibility, and current use actually increased. By the end of the first year, each measure of tobacco use behaviour was significantly lower in Florida than the nation. Among youth 16 years old and over the only significant change occurred in the prevalence of non-smokers susceptible.
Tobacco use behaviour related measures for the Florida target and the national comparison group at baseline and one year
Discussion
The TPP is multicomponent, and while there can be little doubt that some of the “effects” detected through the quasi-experimental design might be attributable to components other than the media, through the first year these were probably minimal. In part this reflects the fact that it is easier to reach large numbers of persons with a mass media programme than through any other component. Programme planners realised this so expectations for first year contributions from other components were low as emphasis was placed more on planning for these than having them fully operational. Thus, by the end of year 1 only 7% of Florida youth were aware of anti-tobacco groups at their school, and 3.7% reported participating in Students Working Against Tobacco (SWAT) sponsored activities. The number of youth reporting membership in, or participating in activities of, community based organisations was even lower. Similarly, 93% of smokers reported knowing places to purchase cigarettes “with no questions asked,” and only an estimated 8% of students had comprehensive tobacco education in their schools. In short, there should be little doubt that most effects detected through the first year were due to the media programme.
The design and specific measures proved well suited to test both sets of evaluation hypotheses. The tracking and monitoring hypotheses showed that over the course of the year, awareness, CA, and receptivity of specific ads and the campaign increased significantly. Not shown here is that although the ad and campaign measures showed some significant differences by ethnicity and region in June, these disappeared by the six month survey. Whether these differences would have self corrected without the June survey is not known, but the information was valuable and led to corrective steps. One benefit of a survey early in a campaign is its potential for identifying these types of problems.
Having repeated surveys is beneficial. In addition to providing programme staff and the media contractor with updated information, repeated surveys can play an important public relations and political function. In the case of the “truth” campaign a segment of the general public and some legislators were critical of the ads and the industry manipulation approach, if not any counter-advertising campaign. Demonstration of the CA and appeal of ads to the target population through frequent press releases can help to silence and win over critics. In Florida, this function of the survey was enhanced when results of the second FYTS were released showing a decline in cigarette use in the target population, and when a parallel decline was confirmed in the 12 month FAME.
Repeated cross sectional surveys can track awareness, CA, and the appeal of ads as a campaign unfolds, but this is not sufficient to test hypotheses linking a campaign to change in attitudes/beliefs, or the prevalence of tobacco use. The ability to make such a case is greatly enhanced when a control population is available. We were able to use the 12–17 year old population in states without anti-tobacco programmes for this purpose. Our data show that the significant changes in attitudes/beliefs and behaviours found in the state were not matched in the control population. States now in the process of planning media evaluations will have a more difficult time identifying a comparison population that is not being exposed to some anti-tobacco media. This difficulty emerges from the increasing number of states that are in the process of planning campaigns, and the national campaigns now underway, particularly those of the American Legacy Foundation and Phillip Morris. The existence of these poses new challenges for state evaluators, but they are also opportunities to learn how the effectiveness of anti-tobacco campaigns can be enhanced.
In short, as states plan their media evaluations they should include survey items that will allow the tracking and monitoring of other active media programmes in their state as well as their own state campaign's ads. Identifying comparison (control) populations that are being exposed to all (and no other) media programmes except their own state specific programme will serve useful functions and help to improve the total anti-tobacco effort.
Systematically planned evaluations will produce serendipitous information. For example, we had not intended to gain information about competing message strategies, but the baseline data showed our target had significantly higher awareness, CA, and receptivity of the deglamorisation message of the PSAs than the control population. This was not surprising given the PSA blitz orchestrated by Florida's governor. When we compared the attitudes/beliefs and smoking behaviours of our target with those of the control population, however, there was no evidence to suggest that this message theme influenced our target. Similarly, when we planned the evaluation we had hypothesised that the industry manipulation message would influence attitudes/beliefs about the tobacco industry, and that these would lead to reductions in the prevalence of smoking behaviours. However, the data suggest that after one year the industry manipulation message affected a broader domain of attitudes/beliefs than those directly related to industry manipulation.
Finally, systematically planned evaluations of media programmes can produce information useful to tobacco control managers, programme planners, public relations staff, and legislative advocates and decision makers, as well as media contractors. To have credibility across all parties it is crucial to have evaluations performed by an external contractor. It is equally important to communicate at the early stages of a multicomponent programme, that an integrated evaluation considering all components needs to be planned as different components become functional. It is tempting when a media programme shows effects at the start of a campaign to continue to evaluate it at the cost of other programme components, and this can result in the misallocation of effects as a campaign continues.
Acknowledgments
This research was supported by contracts for the media evaluation component of the Florida tobacco pilot program and the Florida tobacco control program, Florida Department of Health, and the Tobacco Research and Evaluation Coordinating Center, University of Miami School of Medicine.