Article Text

Abstract
Objectives: To estimate national population trends in long-term smoking cessation by age group and to compare cessation rates in California (CA) with those of two comparison groups of states.
Setting: Retrospective smoking history of a population sample from the US: from CA, with a comprehensive tobacco-control programme since 1989 with the goal of denormalising tobacco use; from New York and New Jersey (NY & NJ), with similar high cigarette prices but no comprehensive programme; and from the tobacco-growing states (TGS), with low cigarette prices, no tobacco-control programme and social norms relatively supportive of tobacco use.
Participants: Respondents to the Current Population Survey–Tobacco Use Supplements (1992–2002; n = 57 918 non-Hispanic white ever-smokers).
Main outcome measures: The proportion of recent ever-smokers attaining long-term abstinence (quit ⩾1 year) and the successful-quit ratio (the proportion of all ever-smokers abstinent ⩾1 year).
Results: Nationally, long-term cessation rates increased by 25% from the 1980s to the 1990s, averaging 3.4% per year in the 1990s. Cessation increased for all age groups, and by >40% (p<0.001) among smokers aged 20–34 years. For smokers aged <50 years, higher cigarette prices were associated with higher quitting rates. For smokers aged <35 years, quitting rates in CA were higher than in either comparison group (p<0.05). Half of the ever-smokers had quit smoking by age 44 years in CA, 47 years in NY & NJ, and by age 54 years in TGS.
Conclusion: Successful smoking cessation increased by 25% during the1990s in the US. Comprehensive tobacco-control programmes were associated with greater cessation success than were with high cigarette prices alone, although both effects were limited to younger adults.
- CPS, Current Population Survey
- TGS, tobacco-growing states
- TUS, Tobacco Use Supplements
- TUS–CPS, Tobacco Use Supplements to the Current Population Survey
Statistics from Altmetric.com
- CPS, Current Population Survey
- TGS, tobacco-growing states
- TUS, Tobacco Use Supplements
- TUS–CPS, Tobacco Use Supplements to the Current Population Survey
There is considerable evidence that cigarette smoking will cause the premature death of approximately half of those who start and continue to smoke, with half of these deaths occurring before age 70 years.1,2 Public health efforts to rapidly reduce the estimated 438 000 smoking-related deaths in the US each year have targeted increasing successful quitting among current smokers.1,3 The British Doctors Study2 evaluated the relationship between age of smoking cessation and later mortality. The study suggests that smokers who quit successfully by age 35 years may avoid much of the excess mortality risk from smoking, those who quit successfully by age 50 years will avoid approximately half of the excess mortality risk accrued by continuing smokers and those who quit by age 60 years will avoid about one-third of the excess mortality risk. These ages are useful cut-points to assess progress towards tobacco-control goals in population groups.
There are several reasons to expect that successful cessation rates may have increased in the US during the 1990s. Many health economists feel that price increases are among the most effective policy approaches to reduce smoking behaviour.4 Significant increases in cigarette prices have consistently been associated with reductions in both per capita cigarette usage and smoking prevalence, with the latter presumed to occur largely through increased quitting.5 Real cigarette prices increased nationally in the US during the 1980s and 1990s, with the largest increase imposed by the tobacco industry in 1999, associated with the consolidated settlement in 1998 of lawsuits brought by attorneys general from 46 states.6 In addition, during the 1990s, many individual states increased their excise taxes on tobacco products.7 These high prices may have encouraged more smokers both to try to quit and to successfully maintain cessation. Thus, quitting indices should have increased across the US, with more marked increases seen in states with higher cigarette prices.
In addition, during the 1990s, nicotine replacement products such as the nicotine patch and nicotine gum became widely available, following randomised trials that showed their efficacy.8 Older smokers and those who smoked more heavily were more likely to use these cessation aids; by 2001, approximately 40% of smokers aged >35 years had used nicotine replacement products to assist in quitting, leading to an expectation that the major increase in successful quitting would occur in older smokers.9
During the 1990s, there were marked differences among US states in initiatives targeting tobacco cessation. Thus, it is of interest to assess changes in quitting rates not only for the US as a whole but also among groups of states that differed in their tobacco-control initiatives. Among US states, California (CA) was the first to begin a comprehensive tobacco control programme in 1989, which had one specific programme goal to encourage smoking cessation and a broader mandate to change community norms regarding tobacco use.10,11 Through the 1990s, CA was unique in spending an average of $3.67 per person per year on a comprehensive public health programme to change smoking-related norms.12 The programme included price increases and other interventions, and a mass media campaign in which about one-quarter of the advertisements encouraged smokers to quit.13 There is considerable evidence that such a mass media programme can effectively motivate smokers to initiate an attempt to quit.14–16 CA also pioneered the Smokers’ Helpline, an evidence-based cessation approach17,18 that has been an integral part of the CA Tobacco-Control Program since 1993.19 In addition, CA passed the first state-wide law banning smoking in the workplace in 1995, and there is mounting evidence that smoke-free workplaces encourage smoking cessation.20 Thus, it might be expected that CA would have higher rates of successful smoking cessation than states without such a comprehensive tobacco control programme.
In comparison, the adjacent states of New York and New Jersey (NY & NJ) have a combined population size similar to CA, and both were similar to CA in the level of cigarette excise taxes during the 1980s and 1990s, yielding similar high cigarette prices.7 However, neither state supported a comprehensive tobacco-control programme during the 1990s, with funding for tobacco control averaging about $0.20 per capita in NY during this time, and less in NJ (Ursula Bauer, personal communication 2005). It might be expected that NY & NJ would have lower rates of smoking cessation than CA and higher cessation rates than states with lower excise taxes and cigarette prices during the study period.
A third contrasting group are the six US states that accounted for >90% of tobacco production in the US during the study period.21 These have consistently had among the lowest excise taxes and cigarette prices in the nation,7 and none had a state-specific tobacco-control programme in the 1990s. In addition, evidence suggests that social norms are more supportive of tobacco use in tobacco-growing regions.22 These tobacco-growing states (TGS) are Kentucky, Tennessee, North Carolina, South Carolina, Virginia and Georgia, which together have a population slightly larger than CA, or NY & NJ. These states might be expected to show the lowest rates of successful smoking cessation during the study period.
In this report, we assess changes in rates of successful smoking cessation from the 1980s to the 1990s in the US as a whole. We consider trends in cessation rates for three age groups of smokers: young adults (20–34 years), early middle-aged adults (35–49 years) and late middle-aged adults (50–64 years). We then compare rates of cessation in the 1990s for the three comparison groups of states: CA (high cigarette price and a comprehensive tobacco-control programme), NY & NJ (high price but no comprehensive programme) and the TGS (neither high price nor programme). We limit consideration to non-Hispanic whites because of considerable differences in tobacco-use behaviour among race or ethnic groups that may confound the analysis,23 and do not assess trends in cessation within state groups because of small sample sizes.
MATERIALS AND METHODS
Data sources
Surveys
We used the Tobacco Use Supplements (TUS) to the Current Population Survey (TUS–CPS), national household surveys conducted by the US Census Bureau for the National Cancer Institute. The CPSs are monthly household surveys, which provide labour force statistics for the country, and which use a multistage stratified area probability sample and have a household response rate of 92–97%. Approximately 50 000–60 000 households are interviewed by the CPS each month in a rotating panel, with independent samples at 4-month intervals. The TUS–CPS were coordinated by the National Cancer Institute in 1992–3, 1995–6 and 1998–9, each consisting of a supplement to the September, January and May CPSs, which are then combined, and in 2001–2, as a supplement to the June, November and February CPSs. All household members aged ⩾15 years were eligible for the TUS interview. A single household member responded (proxy-response) for those not interviewed in person (self-response). Final response rates for self-respondents to the TUS interview are 61–68%, among the highest in population survey research. Details of methods and complete questionnaires are available elsewhere.24–26 We used data for all non-Hispanic white self-respondents aged 20–66 years from the four TUS–CPSs of 1992–2002 (n = 57 918).
Cigarette prices
The annual cigarette price for each state group is the population-weighted average of the average retail price of cigarettes (generic brands included) of each state in the group, as reported in The tax burden on tobacco,7 an annual compendium of tobacco industry statistics produced by the consulting firm Orzechowski & Walker for the major tobacco companies. The state price estimates are the weighted average price/pack as of 1 November from annual surveys of retailers, although detailed methodology of the surveys is not provided.
Smoking status
Smoking status for each survey respondent was from the standard TUS–CPS questions: “have you ever smoked 100 cigarettes?” and “do you now smoke every day, some days, or not at all?” Ever-smokers were asked at what age they started smoking regularly. Former smokers were asked: “about how long has it been since you completely stopped smoking cigarettes?”, with responses in units of days, weeks, months or years. All respondents were asked their age, gender, race or ethnicity, household income and educational status. Price and income data were adjusted to 2001 constant dollars using the Bureau of Labor Statistics consumer price index for all urban consumers average.27
METHODS
All estimates were weighted by TUS–CPS survey weights, which account for selection probabilities from the sampling design and adjust for survey non-response.24,26
Incidence of successful cessation
Following previous work,28 any former smoker who is abstinent for ⩾1 year is considered to have successfully quit. For each year from 1980 to 1999, we retrospectively computed the incidence rate of successful cessation,29,30 using combined responses from the four surveys. The year in which each former smoker had quit smoking was calculated, and the incidence rate was computed as the weighted number of smokers who quit in a given year divided by the weighted number of smokers at risk for quitting in that year. To avoid censored attempts to quit (those of <1 year’s duration by the survey date), we excluded the data from each survey in calculations for the year before or including the survey date. A respondent was in the risk set for cessation in a given year if he or she was between 20 and 64 years of age and smoked during that year. We omitted data from smokers aged >66 years at the time of the survey to minimise bias from higher mortality in continuing (as compared with former) smokers. Differences in incidence rates between age groups, state groups and time periods were assessed using relative odds ratios from logistic regression, controlling for gender, four levels of education, household income in 2001 constant dollars and a binary variable for household income above twice the Census Bureau poverty threshold (by size of family and number of children)31 using standard demographics collected on the CPS. Trends in annual incidence rates were plotted by smoothing the estimated annual rates using the Loess non-parametric regression.
Successful-quit ratio
For each age from 20 to 64 years, for each state group, we computed the successful-quit ratio from the 2001–2 survey as the weighted proportion of ever-smokers of a given age who were abstinent for ⩾1 year on the survey date. For each state group, the trend in the ratio with increasing age was plotted by smoothing the estimated rates for each age using Loess non-parametric regression.
Statistical methods
Weighted estimates were computed in SAS-callable Sudaan V.9.0.1, using PROC RLOGIST for weighted logistic regression and PROC CROSSTABS for weighted proportions. Variance estimates were computed using the published replicate weights with Fay’s balanced repeated replication.24,32 We combined the unequally sized sets of replicate weights from the different surveys by appending full sample weights as necessary (details available from the authors on request). Non-parametric regression used PROC LOESS in SAS V.9.1, with degree of smoothing from an Akaike information criterion.33
RESULTS
Differences in cigarette prices between state groups
Figure 1 presents the average price per pack of cigarettes in constant 2001 dollars for the three comparison groups of states, from 1980 to 2001. During this period, CA and NY & NJ had similar cigarette prices, and these were consistently higher than those in the TGS. For all three groups of states, real prices generally increased across the first half of the study period. There was a modest industry-wide drop in cigarette prices in 1993, and then prices remained stable until the large increases in 1999. In 1988, just before the funding of the CA Tobacco-Control Program, the average price/pack of cigarettes was $2.06 in NY & NJ (2001 dollars), and was 9% less in CA ($1.89) and 16% less in the TGS ($1.69). By the time of the last TUS–CPS in 2001–2, the average price/pack was $4.15 in NY & NJ, and was 4% less in CA ($3.98) and 25% less in the TGS ($2.99).
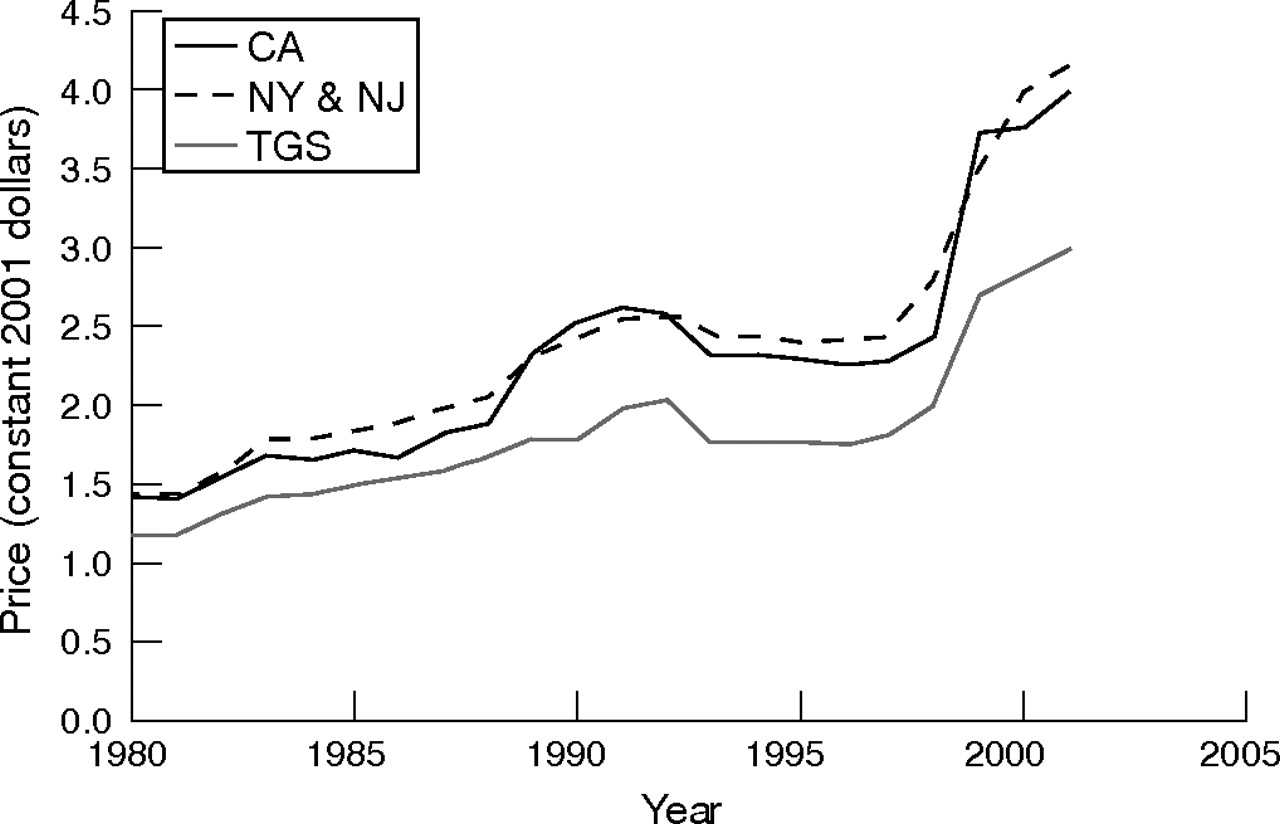
Average price/pack of cigarettes for three groups of states from 1980 to 2001 (constant 2001 dollars), as reported by Orzechowski & Walker in The tax burden on tobacco.7 CA, California, NY & NJ; New York and New Jersey; TGS, tobacco-growing states.
National trends in the incidence rate of successful smoking cessation 1980–99, by age group
Figure 2 shows the national incidence rate of successful cessation estimated for each year from 1980 to 1999, along with a fitted trend from non-parametric regression (heavy line), in a separate panel for each age group. For all three age groups, estimated rates of successful quitting increased over the two decades, and the largest increases were observed for smokers aged 20–34 years. For this youngest age group (fig 2, top panel), the increasing trend observed in the 1980s seemed to accelerate in the 1990s, and estimated successful cessation rates reached almost 5% per year by 1999. For smokers aged 35–49 years (fig 2, middle panel), the increasing trend of the early 1980s seemed to level before increasing again in the late 1990s. By 1999, this age group had the lowest estimated rate of successful quitting at just over 3.5% per year. The highest estimated rates of successful quitting were consistently seen among smokers aged 50–64 years; however, by 1999, the rate for this group seemed similar to that for the youngest age group (fig 2, bottom panel).

Incidence rate of successful smoking cessation for US non-Hispanic white smokers, for each year from 1980 to 1999, by age group. Successful cessation defined as self-reported abstinence of >1 year. Data shown are weighted percentages and standard errors. Heavy line: estimated trends from non-parametric regression.
The average US incidence rate of successful cessation for the decade 1980–9 was 2.7% per year (95% CI 2.65% to 2.69%). For 1990–9, this cessation rate rose to 3.4% per year (95% CI 3.33% to 3.45%). Table 1 compares the relative odds of successful cessation in the 1990s with those in the 1980s for the three age groups, from a logistic regression model adjusted for demographics. For the youngest smokers, aged 20–34 years, from the 1980s to the 1990s, there was a large increase in the relative odds of cessation, by >40%. For smokers aged 35–49 and 50–64 years, there were similar but more modest increases in the relative odds of cessation, by about 10%.
The US incidence rate of successful smoking cessation by age group for US non-Hispanic white smokers, comparing 1980–9 with 1990–9
Differences in the incidence rate of successful smoking cessation 1990–9 between state groups, by age group
Table 2 shows the incidence rate of successful cessation for the decade 1990–9 for the three comparison groups of states, by age group. We used a separate logistic regression model for each age group to assess differences between state groups, adjusting for demographic variables.
Incidence rate of successful smoking cessation 1990–9, comparing three groups of states by age
For smokers aged 20–34 years, the relative odds of successful cessation were higher in CA than in NY & NJ or the TGS. Among smokers aged 35–49 years, observed differences in cessation rates between the state groups were smaller than for younger smokers. The odds of cessation in CA was greater than in the TGS, and did not differ significantly between CA, and NY & NJ. Among smokers aged 50–64 years, there were no significant differences between the state groups in the adjusted odds of cessation. In this older age group, the estimated cessation rate in CA was not different from the national average.
Differences in the 2001–2 successful-quit ratio between state groups, by age group
Figure 3 shows the proportion of ever-smokers, who had successfully quit by the 2001–2 survey, for each state group, for each age from 20 to 60 years. This successful-quit ratio increases with age in all three state groups, with the exception of smokers aged 30–45 years in the TGS. In CA, half of those who had ever smoked had successfully quit by age 44 years, compared with age 47 years in NY & NJ and by age 54 years in the TGS. In all state groups, >70% of ever-smokers had quit before the age of 64 years.

Successful-quit ratio by age for three groups of states, 2001–2 survey. CA, California, NY & NJ; New York and New Jersey; TGS, tobacco-growing states.
DISCUSSION
Contrary to declines in cessation rates reportedly observed in clinical trials,34 in the majority of the US population, successful smoking cessation increased by about 25% from the 1980s to the 1990s, from 2.7% per year to 3.4% per year. Annual cessation rates increased during the study period for all age groups, with the largest increase for smokers aged <35 years. In the 1980s and early 1990s, cessation rates for younger smokers seemed to be well below those of smokers aged 50–64 years, but by the end of the 1990s, cessation rates for both the youngest and the oldest groups had reached nearly 5% per year.
These recent nationwide dramatic increases in the incidence of successful quitting among young adult smokers suggest that there may have been a change in at least one of the major determinants of cessation success for younger smokers. There is considerable evidence that changing norms about smoking in the workplace35 have been diffusing rapidly across the US, along with accompanying restrictions on such smoking.36 Evidence also suggests that such restrictions on smoking in the workplace and in public areas lead to a reduction in the number of cigarettes smoked each day, and that higher rates of non-daily smoking are associated with reduced smoking prevalence.37–41 A companion paper documents a national decline in average cigarette consumption among young adult smokers who smoke daily.42 Future work should explore whether these and associated trends may have led younger smokers to reach lower levels of nicotine dependence than previous generations of smokers,43 thus making it easier for them to quit.44,45
This study provides evidence that sustained higher cigarette excise taxes are associated with sustained higher population incidence rates of successful quitting, but only for smokers aged <50 years. CA’s comprehensive tobacco-control programme was associated with an additional effect on successful quitting in addition to cigarette price increases; however, this effect was limited to the youngest group of smokers. For smokers who were most at risk for a smoking-related health event (aged 50–64 years), successful cessation increased from the 1980s to the 1990s nationally, but the TGS, with low levels of both price and motivational programmes, had cessation rates equal to those in states with higher prices alone (NY & NJ) or as part of a comprehensive tobacco-control programme (CA).
If the experience among the US population is similar to that of British doctors,2,46 these increases in successful quitting should result in a continuation of the decline in smoking-related mortality observed in the US in recent years.47 Indeed, the large increases in successful quitting in the youngest age group should mean that these declines will accelerate in the medium-term future (30–50 years), rather than levelling off as some have predicted.48 In 2002, in both CA and NY & NJ, the median ever-smoker had quit successfully before reaching 50 years of age. According to Doll et al,2 these smokers should avoid half of the excess mortality risk accrued had they continued to smoke. Even in the TGS, the median age of successful quitting was 54 years, and in all state groups, >70% of smokers had quit successfully by age 64 years, avoiding some excess mortality risk. However, the median age of successful quitting in CA, with its comprehensive tobacco-control programme, was 10 years earlier than that in the TGS, and this should result in markedly lower rates of smoking-related mortality and morbidity.
A strength of this study is that it compares state-specific data collected by the US Census Bureau in a national survey, using identical methods at 3-year intervals. The data used are self-reports from smokers and, in large population surveys, these have not been associated with major biases in smoking estimates.49–51 However, as population surveys focus on representative samples, they have higher non-response rates than those reported in other research, and the willingness of randomly selected US residents to complete surveys has been declining over time. There are many reasons for these declining response rates, and annoyance with telemarketing practices has often been cited. Importantly, these declining response rates do not seem to introduce a bias, provided that population data are appropriately adjusted for non-response.52 We accordingly used the recommended weighted datasets, which incorporate non-response adjustments and sampling design probabilities. A limitation of our retrospective analysis of quitting incidence rates is that state of residence at the survey date and at the time of smoking cessation are assumed to be the same. A large movement of former smokers from CA or NY & NJ to the TGS during the study period would artificially inflate the estimated successful quitting rate in the TGS. Similarly, a large movement in the opposite direction would bias our results in the opposite direction. However, we know of no such large population movement between the comparison states during the study period.
In summary, during the 1990s, there was considerable progress in successful smoking cessation in the US, and this should translate into major declines in smoking-related mortality in future years. An unexpected finding was the large increase in successful cessation incidence rates across the nation for smokers aged <35 years. If the current cessation rate of 5% per year is maintained, over half of the smokers who are now in their early 20s will have quit smoking permanently before the age of 35 years and should avoid almost all of the excess mortality risk of smoking.2 For those aged <50 years, successful cessation was higher in states with higher cigarette prices. For those aged <35 years, the comprehensive tobacco-control programme in CA seemed to further increase successful cessation in addition to the effect of price. However, there is considerable room for improvement in successful cessation, particularly among smokers aged 35–49 years. Nonetheless, in all states, large majorities of smokers had successfully quit by age 64 years. Higher prices and comprehensive tobacco-control programmes should be implemented more generally across the US.
What this paper adds
-
Comprehensive tobacco-control programmes have been shown to decrease smoking initiation. However, recent population trends in smoking cessation remain unknown.
-
This study shows that successful smoking cessation rates increased by 25% during the 1990s in the US.
-
An unexpected finding was the large increase in successful cessation rates across the nation for smokers aged <35 years.
-
Also, the largest tobacco-control programme as yet conducted seemed to further increase the rate of successful smoking cessation among these young adult smokers.
Acknowledgments
This work was supported by Tobacco-Related Disease Research Program grants (12RT-0082 and 15RT-0238) from the University of California, California, USA.
REFERENCES
Footnotes
-
Competing interests: The granting agency (Tobacco-Related Disease Research Program) did not have any role in design of or conduct of the study, or preparation, review or approval of the manuscript.