Article Text

Abstract
Objectives: With the male smoking prevalence near 60% in 1991, Thailand was one of the first Asian nations to implement strict tobacco control policies. However, the success of their efforts has not been well documented.
Methods: The role of tobacco control policies are examined using the “SimSmoke” tobacco control model. We first validated the model against survey data on smoking prevalence. We then distinguished the effect of policies implemented between 1991 and 2006 from long-term trends in smoking rates. We also estimated smoking attributable deaths and lives saved as a result of the policies.
Results: The model validates well against survey data. The model shows that by the year 2006, policies implemented between 1991 and 2006 had already decreased smoking prevalence by 25% compared to what it would have been in the absence of the policies. Tax increases on cigarettes and advertising bans had the largest impact, followed by media anti-smoking campaigns, clean air laws and health warnings. The model estimates that the policies saved 31 867 lives by 2006 and will have saved 319 456 lives by 2026.
Conclusions: The results document the success of Thailand in reducing smoking prevalence and reducing the number of lives lost to smoking, thereby showing the potential of tobacco control policies specifically in a middle-income country. Additional improvements can be realised through higher taxes, stronger clean air policies, comprehensive cessation treatment policies, and targeted media campaigns.
Statistics from Altmetric.com
Globally, it is estimated that 5 million deaths each year are attributable to smoking.1 Yet, there is strong evidence that higher cigarette taxes, advertising bans, clean air laws and media campaigns can appreciably reduce adult smoking rates, especially when combined as a comprehensive overall strategy.2–5 However, most of the studies of tobacco control policies have been conducted for high income nations. Less is known about low- and middle-income nations, where smoking rates are high.6–8
With male smoking prevalence near 60% in 1991, Thailand was the first Asian nation to implement strict tobacco control policies.9 10 In 1992, health warnings, a strict ban on advertising, and a ban on smoking in some public places were put in place.11 Tobacco taxes were progressively increased starting in 1994, and the ThaiHealth Foundation was established by a dedicated tax in 2001.12 As one of the most aggressive nations pursuing tobacco control, Thailand provides an important example for other nations, particularly low and middle income countries. Vateesatokit et al11 demonstrated that Thai smoking prevalence has fallen since 1991, but did not distinguish the effect of policies from trends that would have occurred in their absence.
Past empirical studies have examined the effect of only one, or at most two, tobacco control policies13–15 due to the difficulty in distinguishing the effects from different policies. Simulation models combine information from diverse sources to examine how the effects of the different policies unfold over time.16 17 To study the effects in Thailand, we adapted the SimSmoke tobacco control policy model,17–20 which simultaneously considers a broader array of public policies than other smoking models.21–27 The model has accurately explained trends in smoking rates for the US and for several states,19 28 29 and has been applied to other nations.30 31
Using Thai data on population, smoking rates and policies, Thailand SimSmoke (ThaiSS) predicted smoking rates and smoking attributable deaths. Specifically, the model estimated the change in smoking rates and lives saved by tobacco control policies implemented since 1991, and the role of the different policies.
METHODS
SimSmoke includes population, smoking, smoking-attributable deaths, and policy modules.17 19 20 The model begins in a baseline year, 1991, with the population divided into the number of smokers, never-smokers, and previous smokers by age and gender. A discrete time/first order Markov process is employed to project future population growth and smoking rates from the base year forward. The population evolves with fertility and deaths. Individuals begin as never-smokers from birth until they initiate smoking or die, and smokers may become ex-smokers through cessation and may return to smoking through relapse.
Tobacco control policies influence smoking rates. Policies have their greatest effect directly through prevalence in the year they are implemented, but continue to affect initiation and cessation rates during the period over which the policy is in effect. When more than one policy changes, the relative impact of each policy is independent of other policies. The policy parameters in the model used to generate the predicted effects are based on thorough reviews of the literature3 32–37 and the advice of an expert panel. Policies and their potential effect sizes are summarised in table 1.
Following standard attribution methods,38 39 the death rates of never-smokers, smokers, and ex-smokers are estimated using relative risks, prevalence rates and death rates by age and gender. The number of smokers and ex-smokers at each age is then multiplied by their respective death rate minus the death rate of never-smokers to obtain the excess deaths due to smoking.
Data and development of ThaiSS
Population by individual age and gender for 1991 was obtained from the Health and Welfare Survey (HWS),40 a two-stage stratified sampling survey collecting data from 98 054 individuals from 23 702 household sample, about 0.17% of the population. Mortality and fertility rates for 1991 were obtained from the Health Information Group.41 Compared to projections by the Thailand Census,42 model projections are within 2% of the 2006 population and within 1% of the 2016 population.
The data on smoking prevalence is also from the 1991 HWS. Every member of the household age 6 years and older was first asked, “do you smoke cigarettes now?” Those who said that they smoked regularly or occasionally are considered current smokers. Those who have not smoked are then asked if they ever smoked in their lifetime. Ex-smokers include those who are not an active smoker but had ever smoked in their lifetime, and are distinguished by the number of years since they quit. Individuals who had never smoked are considered never-smokers. Smoking rates were calculated by gender and by age group, using a three-age moving average.
Due to empirical challenges in measuring initiation and cessation and to insure internal consistency of the model, initiation rates at each age are measured as the difference between the smoking rate at that age year and the rate at the previous age year. Because smoking rates began to level off at about age 28, initiation in the model occurs until age 28.
One-year cessation rates are measured as a percentage of those smoking a year ago and are currently not smoking from those who were smokers 1 year ago. Cessation is tracked from age 28, since smoking before that age is less likely to have health implications for ex-smokers. Because data were not available for Thailand, we used US relapse rates, however the percentage of ex-smokers by years quit after the first year in Thailand were similar to those of the US.
The policy inputs from 1991 to 2006 are based on information provided by tobacco control experts in Thailand, the National Tobacco Information Online System43 and Tobacco-free Asia websites,44 and studies.9 11
We obtained price data for the leading brand for 1991 to 2001 and a price index of tobacco products for 1997 to 2006 from the Thailand Tobacco Monopoly and the Bureau of Trade and Economic Indices (Ministry of Commerce, Thailand), respectively. To adjust for inflation, prices were deflated using a consumer price index for all goods from the Bureau of Trade.45
Chaloupka et al46 found that more developed countries have price elasticities of −0.4 compared to −0.8 for less developed countries. For Thailand, the total price elasticity has been estimated as −0.67 by Supakorn,47 −0.39 by Sarntisart48 and −0.5 by Guindon.46 We also considered that 49.2% of male smokers in 2004 smoked hand-rolled cigarettes, up from 46.7% in 1991.40 Taking into account the potential substitution towards untaxed hand-rolled cigarettes, US studies distinguishing the price responsiveness by age,49 and demand studies for Thailand, the model uses prevalence elasticities of −0.4 for those up to age 24, −0.3 for those aged 25 to 34, and −0.2 for those aged 35 and above.
Legislation enacted in 1992 banned all forms of direct and indirect tobacco advertising, with effective enforcement mechanisms.9 Enforcement increased in 2002 with the creation of ThaiHealth. In mid-2005, point of purchase restrictions were added requiring that cigarettes be kept behind barriers that are not visible to customers. However, data from the 2004 GYTS50 still indicated that 43.7% of youth had an object displaying a cigarette brand logo, and 11.5% had been offered free cigarettes by a tobacco company representative. In our model, a total marketing ban begins in 1992 with no enforcement, enforcement increased to 50% in 2002, and ends with 75% of full enforcement in 2006. We assume that a comprehensive advertising/marketing policy banning all forms of advertising and marketing reduces prevalence by 6% and initiation by 8%, and increases cessation rates by 3%. Vigilant monitoring and enforcement of the ban adds 2% to the prevalence and initiation effects.
A low intensity media campaign was initiated in Thailand in 1986, which targeted Bangkok and was accompanied by community-based activities. In 2004, the campaign was intensified to a medium intensity media campaign with increased local tobacco control activities. Media campaigns in Thailand may have greater effects than for the US,3 since the population begins with a lower level of awareness about the health risks than high-income nations,51 but may have less effect due to difficulties in reaching rural populations. We assume the same effects for Thailand as for the US model.
In 1992, health warnings were required to cover a third of the package, which we classify as a weak policy. In 1998, they were increased to half of the package, which we classify as half weak/half strong. In 2005, pictorial warnings were required, which we classify as strong policy. In the model, weak warnings on cigarette packages reduce the prevalence and initiation rate by 1% and increase the cessation rate by 1%, while strong health warnings reduce the initiation and prevalence rates by 2% and increase the cessation rate by 4%.
SimSmoke examines the effect of workplace, restaurant, school and other public place clean air laws, and whether the laws are publicised and enforced. Prior to 1992, clean air laws covered few areas with limited enforcement. In 1992, the bans were established in public transportation and elevators, and smoking was restricted to designated areas in schools and in air-conditioned restaurants. This is modelled as zero impact of restriction in private workplaces, and a 50% impact of restrictions in public places and in restaurants. In 1998, smoking was banned in air-conditioned workplaces except in designated areas, and was banned in service businesses, and the impact of both was increased to 75%. In late 2002, smoking was banned in air-conditioned restaurants and in shopping areas, and the impact of clean air laws was increased to 100%. Evidence indicates many violations of the clean air laws,11 48 so that enforcement and publicity are modelled as having zero impact.
No studies of clean air laws were found for Thailand. Taking into account that 40% of the Thai workforce were employed in agriculture52 compared to about 2% in the US, that the Thai labour participation rate was 55%52 compared to about 70% in the US, and that Thai laws only apply to air-conditioned restaurants, we scaled the US effect for restaurants and workplaces by 50%. Bans in school and other public places are estimated to have the same effect in Thailand as in the US.
Although Thailand has had a ban on the purchase of tobacco by youths, according to the 2004 GYTS,50 40.1% who bought cigarettes in a store were not refused service because of their age. Enforcement is therefore modelled as at a low level.11 48
Thailand started a “Quitline” phone service in 1999 and training programs in cessation clinics in 2001, but neither are well funded. Based on our previous work,53 54 the effect of these policies is probably very small, and thus they are not considered in the model.
No published studies of smoking risks were found for Thailand. Since Thailand has a similar level of economic development and similar smoking patterns, we used a large-scale study for Taiwan,55 which obtained an average relative risk for total deaths of 1.55. However, we consider relative risks of 1.35 and 2.1 observed for China,56–59 and the US, respectively.60 For ex-smokers, we assume that relative risks decline at the rate observed in the US,60 since estimates could not be found for a low-/middle-income nation.
Validation and the effect of tobacco control policies
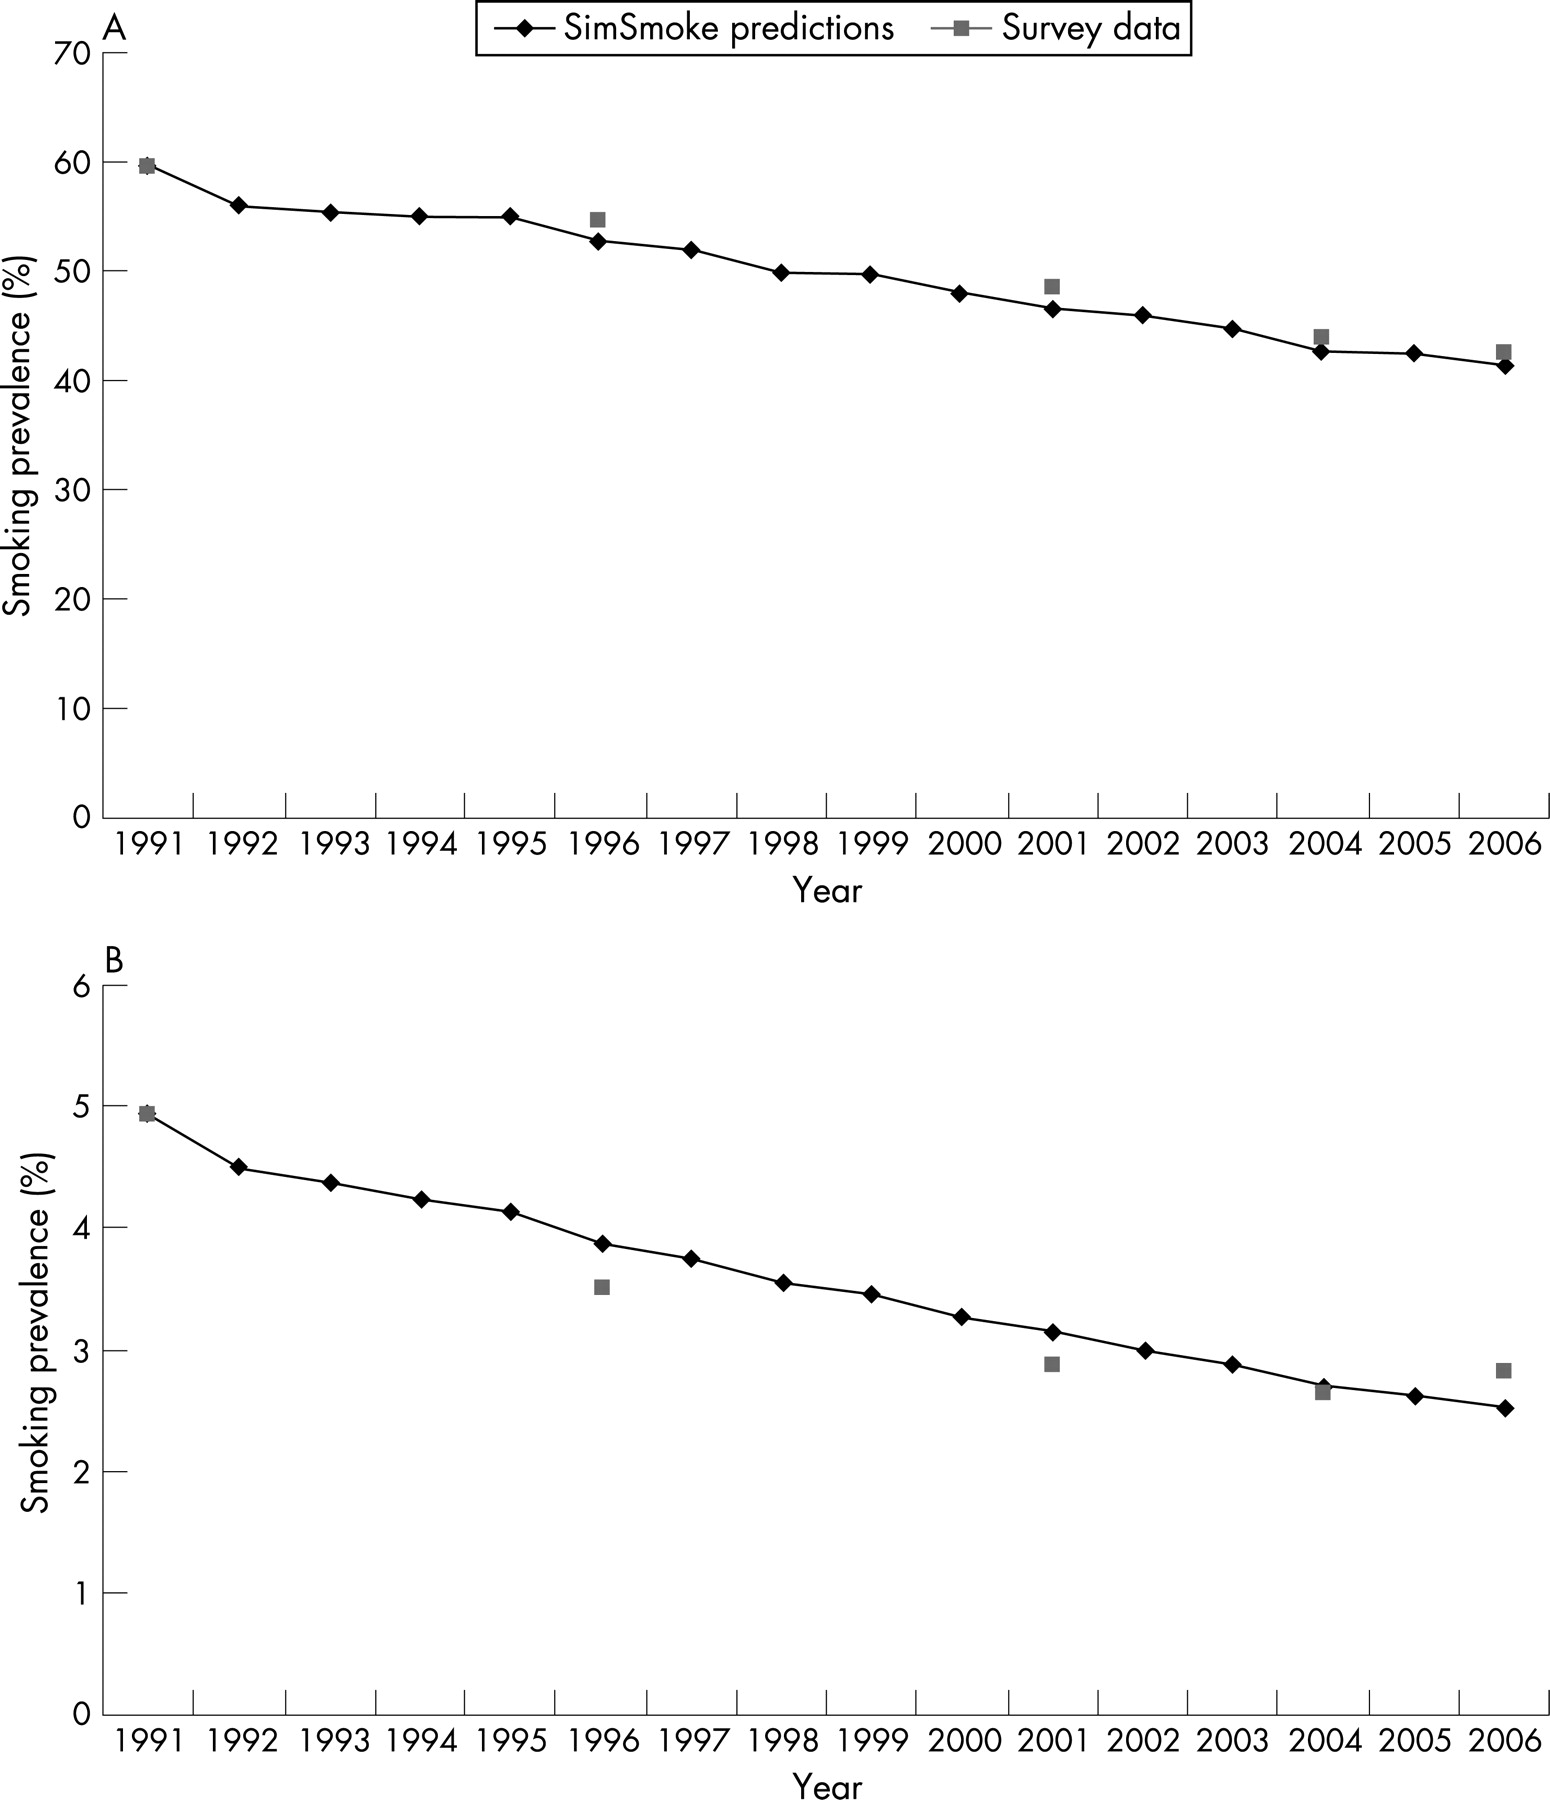
To validate the model, we compare the predicted smoking rates by gender and age to smoking rates obtained from the 1991, 1996, 2001, 2004 and 2006 Health and Welfare Surveys.40 Since changes in trends around policy change are the focus, we examined percentage changes in the rates between survey years.
To consider the effect of all policies implemented since 1991, we set policies up to 2006 to their levels in 1991. The difference between the smoking rate with polices at their 1991 levels and the smoking rate with all policies in place yields the net effect of policies implemented since 1991. For the role of single policies, we compared the scenario with only that policy implemented to the no-policy scenario. Because the effects of multiple policies are assumed to be multiplicative, we examined the reduction attributed to each individual policy relative to the sum effect of all policies. We also estimated the impact of policies on smoking attributable deaths through the year 2021 by subtracting the number of deaths with policies implemented up to 2006 from the number of deaths with policies kept at their 1991 levels.
RESULTS
Model validation
Smoking rates predicted by the model are compared to prevalence rates from survey data in table 2 and figs 1a,b. The male and female models predict adult prevalence (ages 15 and above) well over the years 1991 to 2006. The male model predicts a relative decline of 29.7% for males compared to a decline of 28.9% from survey data. The model overpredicts the relative decline (11.6% vs 8.2% from survey data) during the period 1991–1996 and underpredicts the decline from 2001–2003 (3.9% vs 9.9%). The model predicts well over the periods 1996–2001 (11.5% vs 11.0%) and 2004–2006 (3.0% vs 3.4%). For females, a predicted decline of 48.9% for the whole period is within 13% of the 43.4% decline from survey data. The model slightly underpredicts the decline from 1991 to 1996, but is back on target by 2004 (2.7% from the model vs 2.6% from the survey). The model does not predict the increase in smoking among women between 2004 and 2006 shown in surveys.
For males by age over the period 1991–2006, the model underpredicts the relative decline for ages 15–24 and ages 60 and above, overpredicts for ages 40–59, and is within 3% for ages 25–39. For females age 15–24, the model overpredicts the decline, mostly due to the large relative increase shown between the 2004 and 2006 surveys. The model predicts well for females ages 25–39 (−52.8% vs −51.3%) and ages 40–59 (−63.1% vs 56.9%). The model underpredicts for females ages 60 and above (48.9% vs 57.1%). For the 1991–1996, 1996–2001 and 2001–2004 and 2004–2006 sub-periods, the results by age are similar to those for the entire adult population.
The role of policies
With policy changes, the model predicts a 29% decline in male smoking rates, from 59.4% in 1991 to 41.7% in 2006. The model predicts a 49% decline for females, from 4.9% in 1991 to 2.5% in 2006. With all policies maintained at their 1991 levels, the model predicts that, between 1991 and 2006, smoking prevalence would have fallen from 59.4% to 55.5% for males and from 4.9% to 3.3% for females. Thus, by 2006, the male smoking prevalence was 25% ((41.7–55.5)/55.5) lower for males and 24% ((2.5–3.3)/3.3) lower for females than it would have been in the absence of the policy changes.
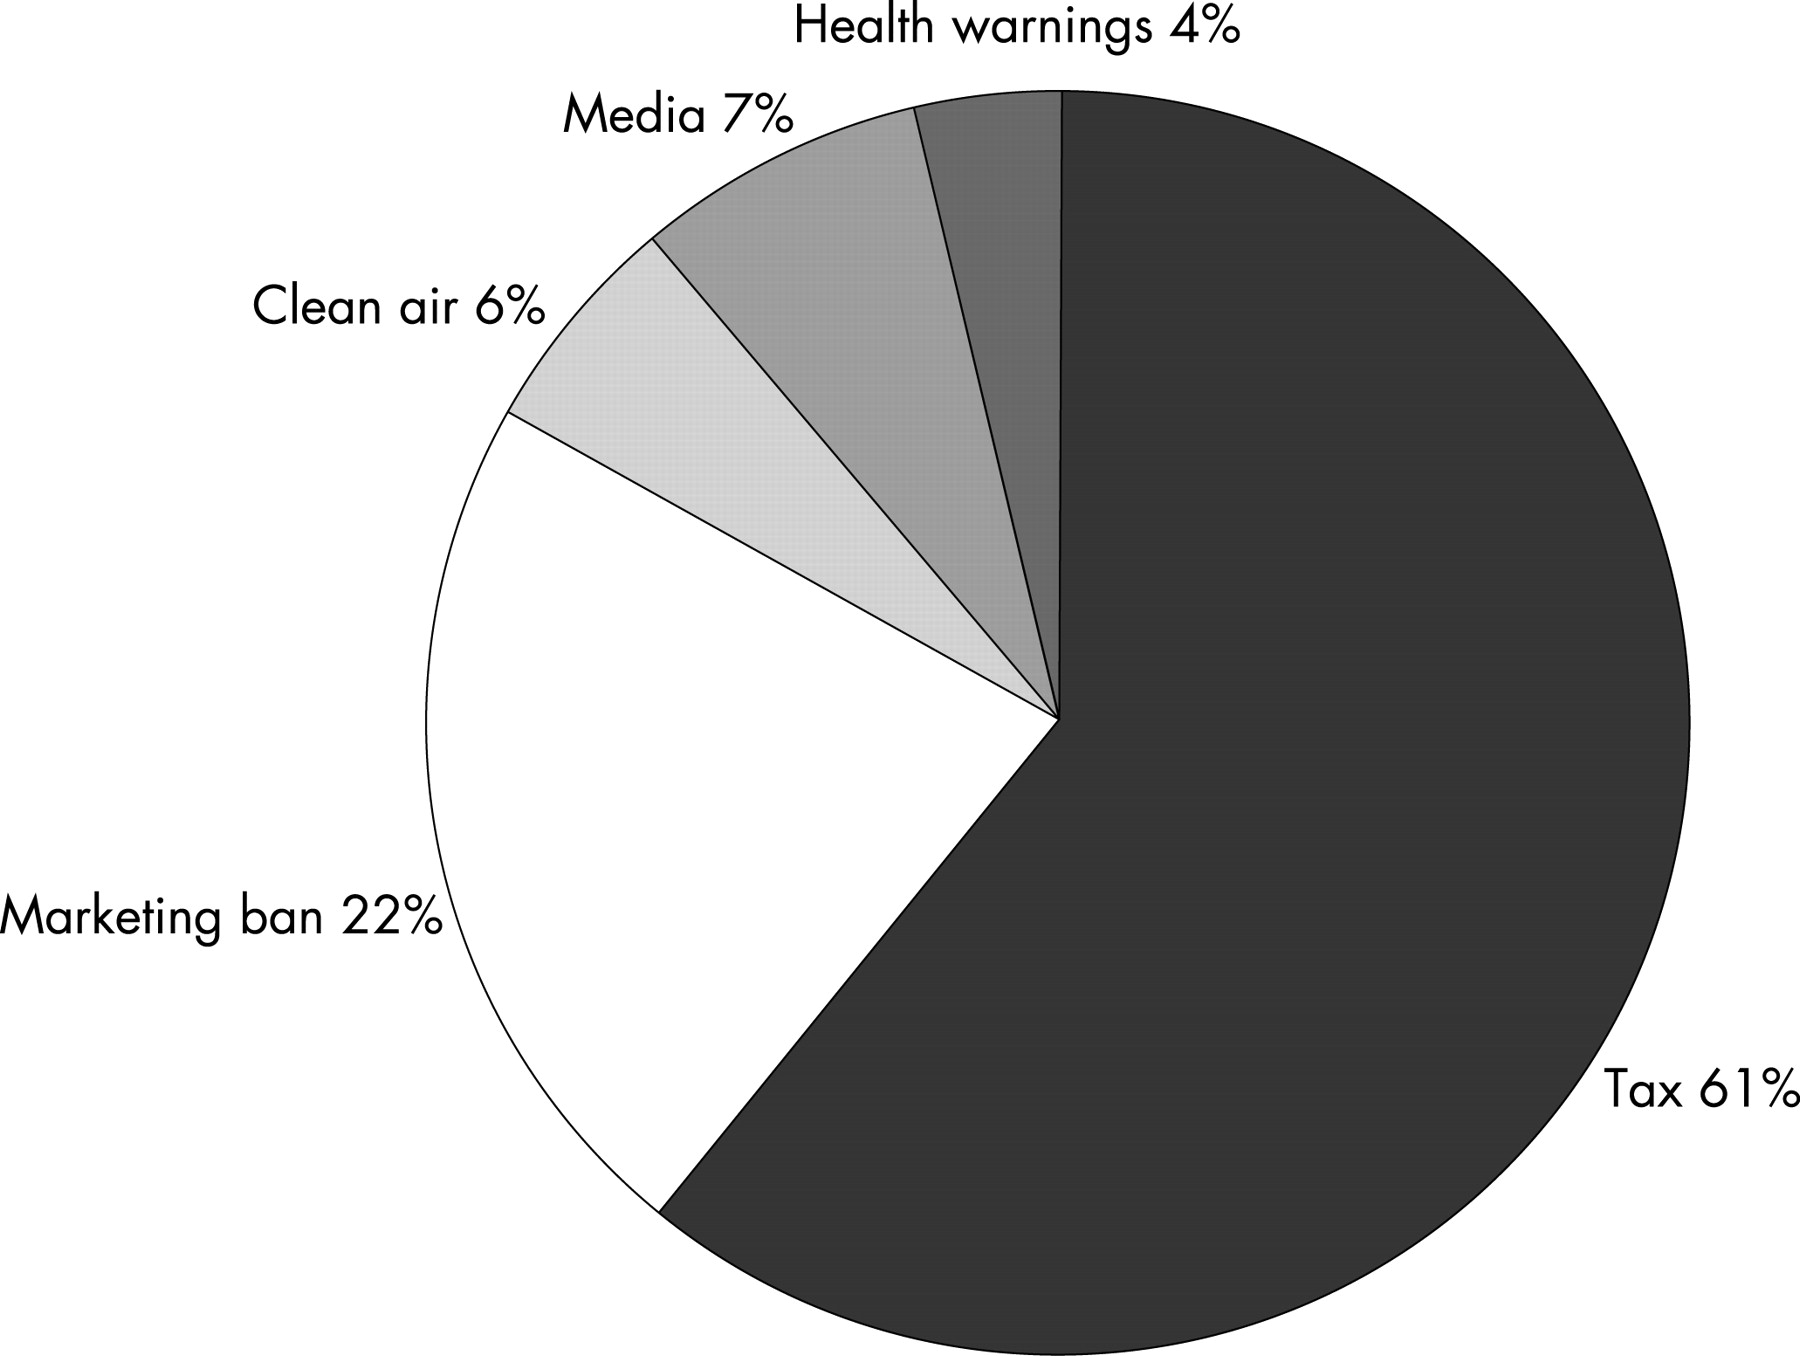
Following little change between 1991 and 1995, inflation adjusted cigarette prices increased up to 2005. With only price changes, the smoking rate among males (females) is predicted to have fallen by 15.8% (14.2%) from 1991 to 2006. The marketing ban from 1992 accounted for a 6.2% (7.2%) drop for males (females). Clean air policies, media campaigns and health warnings were predicted to have smaller but similar effects for males and females. As shown in fig 2, the relative contribution of each specific policy on the reduction in male smoking prevalence as of 2006 is 61.2% for price, 21.8% for the marketing ban, 7.5% for media campaigns, 5.7% for clean air laws and 3.8% for health warnings. For females, the marketing ban played a larger role (26.3%), due to the larger percentage at younger ages.
Lives saved
As shown in table 3, we estimate that 39 342 (35 267 males and 4075 females) smokers and ex-smokers died as a result of cigarette use in Thailand in 1991, using a relative risk for total mortality of 1.55. The model estimates that 54 553 individuals died in 2006 from smoking compared to 60 282 that would have died in the absence of policies, or a difference of nearly 5729 lives in that year alone. This difference grows over time, as the effects of the policy on the number of smokers increases and as the time since quitting of ex-smokers increases. Summing over the years 1991 to 2006, we estimate that 31 867 lives were saved by 2006. By 2021, the estimated number of lives saved increases to 18 409 in that year alone. Between 1991 and 2026, we estimate that 319 456 lives will be saved in total. If the relative risk was that of the US (2.4), the number of lives saved would increase to 539 458 lives saved by 2026, and if the relative risk was that of China (1.35) the estimate would decrease to 221 480.
DISCUSSION
The Thailand SimSmoke applies data and parameter values developed for Thailand to the US model. Validated against prevalence rates from large-scale surveys, the model predicts well, indicating relative declines of 30% for males and 49% for females between 1991 and 2006. However, the model for males overpredicts the relative decline during the period 1991–1996, which may be explained by factors not considered in the model. During that period, foreign tobacco firms introduced lower-priced alternatives and strategies to avoid the marketing ban.11 These tactics are likely to have dampened the effect of the policies. The model predicts well over the period 1996–2001, but underpredicts the decline from 2001–2004. The Thai Health Foundation established in 2002 may have acted as a watch guard for the enforcement of tobacco control policies and thereby thwarted the aggressive pricing and promotion tactics of the industry. The female model displayed less consistency by sub-periods, especially between 2004 and 2006, possibly due to larger sampling variation resulting from few female smokers. The model generally predicted well by age groups, but tended to underpredict for males aged 15–24 and for females aged 60 and above. These groups may be more responsive to price and advertising policies than indicated by the model.
What this paper adds
With the male smoking prevalence near 60% in 1991, Thailand was one of the first Asian nations to implement strict tobacco control policies. However, the success of their efforts has not been well documented. Except for tax policies, the role of tobacco control policies has received little attention in middle and low-income nations.
The role of tobacco control policies is examined using the SimSmoke tobacco control model. The model validates well against survey data. The model shows that by the year 2006, policies implemented between 1991 and 2006 had decreased smoking prevalence by 25% compared to what it would have been in the absence of policies. Tax increases on cigarettes and advertising bans had the largest impact, followed by media anti-smoking campaigns, clean air laws and health warnings. The model estimates that the policies saved 31 867 lives by 2006 and will have saved 319 456 lives by 2026.
Separating long–term trends in smoking rates from the effects of policies implemented between 1991 and 2006, the model estimates that tobacco control policies alone were responsible for a 25% decline in male and female smoking prevalences. The model predicts that smoking rates would have still decreased slightly in the absence of policies (ie, long-term trends). However, with the opening of the cigarette market to foreign tobacco firms in 1988, the smoking prevalence actually increased from 56.3% in 1986 to 59.3% in 1991, just prior to when the model begins. If these trends were to have continued, smoking rates may have increased in the absence of policies, suggesting that the model may underpredict the role of policies.
Using relative risks for a comparable nation, the model estimates that 31 867 fewer smoking attributable deaths resulted from the policies by 2006 and a total of 319 456 fewer deaths will result by 2026. As income increases and smoking patterns mature, relative risks may increase to the levels observed from the US and the number of estimated smoking-attributable deaths avoided increases to about 540 000. In addition, these estimates do not include the additional deaths avoided due to reductions in second-hand smoke exposure, a particular problem in the home for nations with a high male to female smoking ratio.
Of the decline in smoking prevalence due to policies, the model attributes 61.2% to price changes, 21.8% to the marketing ban, 6.3% to stronger media campaigns, 5.7% to stricter clean air laws, and 3.8% to stronger health warnings. The central role for price policies mirrors results obtained for the US,19 California29 and Arizona.28
The model is complex, and the results depend on data reliability, assumptions and parameters underlying the model. For example, the smoking module assumes that initiation, cessation and relapse are constant over time except when they are due to policy-induced changes in future years. Income is assumed to have no independent effect on smoking rates, based on the conflicting results from previous studies.49 When we considered the effect of increased income using estimates for Thailand, the model predicted less well.
The policy parameters are subject to uncertainty. In another paper,29 we developed estimates of uncertainty and obtained confidence bands of between 25% and 50% of the policy effect sizes. The model’s policy parameters for Thailand are based primarily on US, Australian and European studies. While studies of price find similar and generally larger effects for nations with lower incomes, there is much less knowledge for other policies.61 In particular, further research is need on the effects of substitution towards hand rolled (ie, untaxed) cigarettes, the impact of marketing bans, and the synergistic effects when policies are combined.62
Although Thailand’s tobacco control policies have already had a substantial impact, further gains might be realised by implementing stricter policies. By 2026, smoking prevalence could be reduced by 10.2% as a result of increasing the cigarette tax from 79% to 85% of price and by 9% as a result of implementing comprehensive cessation policies. These policies, along with more intensive media campaigns and stricter clean air laws, are predicted to reduce smoking prevalence by 28%.
In summary, this study estimates that tobacco control policies have reduced smoking prevalence in Thailand by 25% within 15 years. Higher taxes and marketing bans have played an important role. As one of the more active nations in tobacco control policy, Thailand provides an important example for other nations, especially low and middle income nations. Simulation models such as SimSmoke can help document the effects of policies in these nations.
Acknowledgments
We would like to thank the Roswell Park Cancer Institute and the Southeast Asia Tobacco Control Alliance for funding to develop the Thailand SimSmoke model and write this article.
REFERENCES
Footnotes
Funding: The Roswell Park Cancer Institute (P50 CA111236 “Building the Evidence Base for Tobacco Control Policies” per RFA-CA-04-012 “Transdisciplinary Tobacco Use Research Centers”), and the Southeast Asia Tobacco Control Alliance funded development of the SimSmoke model and writing of this article. The funding sources had no direct role in study design or in the collection, analysis, and interpretation of data.
Competing interests: None.