Article Text

Abstract
Background Brazil experienced a large decline in smoking prevalence between 2008 and 2013. Tax rate increases since 2007 and a new tobacco tax structure in 2012 may have played an important role in this decline. However, continuous tax rate increases pushed up cigarette prices over personal income growth and, therefore, some consumers, especially lower income individuals, may have migrated to cheaper illicit cigarettes.
Objective To use tobacco surveillance data to estimate the size of illicit tobacco consumption before and after excise tax increases.
Methods We defined a threshold price and compared it with purchasing prices obtained from two representative surveys conducted in 2008 and 2013 to estimate the proportion of illicit cigarette use among daily smokers. Generalised linear model was specified to understand whether the absolute difference in proportions over time differed by sociodemographic groups and consumption levels. Our findings were validated using an alternative method.
Results Total proportion of illicit daily consumption increased from 16.6% to 31.1% between 2008 and 2013. We observed a pattern of unadjusted absolute decreases in cigarette smoking prevalence and increases in the proportion of illicit consumption, irrespective of gender, age, educational level, area of residence and amount of cigarettes consumed.
Conclusions The strategy of raising taxes has increased government revenues, reduced smoking prevalence and resulted in an increased illicit trade. Surveillance data can be used to provide information on illicit tobacco trade to help in the implementation of WHO Framework Convention on Tobacco Control (FCTC) article 15 and the FCTC Protocol to Eliminate Illicit Trade in Tobacco Products.
- Taxation
- Illegal tobacco products
- Price
- Public policy
- Surveillance and monitoring
Statistics from Altmetric.com
Introduction
Brazil has implemented a broad set of legislative, regulatory, educational and economic interventions to address tobacco use since 1986, making it a world leader in tobacco control and one of the most successful countries in reducing tobacco use (from 34.3% in 1989 to 14.7% in 2013).1–4
Real price increases most likely acted synergistically with other tobacco control policies to achieve the dramatic changes in smoking initiation and cessation.5 Between 1986 and 2013, Brazil experienced multiple tobacco excise tax (IPT–Industrialized Product Tax) policies, going from a single rate ad valorem system in the 1990s, passing through a multi-tiered specific system between 1999 and 2011, and, finally, implementing a mixed system since 2012.3 ,6 ,7 In 2007 and 2009, tax authorities decided to increase specific rates over accumulated inflation rates between adjustment periods.3 ,7 The new cigarette excise tax structure that went into effect in 2012 was composed of two specific rates and one small ad valorem component. This last component would be increased every year.8 Moreover, the law established a minimum price for a pack of cigarettes, which would be also increased yearly over expected inflation rate from 2012 onwards.9
Table 1 illustrates what happened with cigarette consumer prices and its two main components: net-of-tax prices and total tax amounts per pack, during the excise tax reform. Between 2008 and 2014, consumer prices increased by 146% and total tax amount increases were responsible for two-thirds of consumer price expansion, while company behaviour accounted for one-third of it. Cigarette firms increased ex-factory prices over inflation rates to recover profit mass, given the sales volume decline. This combination of tax and net-of-tax price changes augmented consumer prices over inflation rates.
Performance of the Brazilian Cigarette Excise Tax Reform — Consumer and Net-of-Tax Prices, Tax Amounts and other relevant nominal variables — Selected years
Given this new tax and price reality and the existence of illicit cigarette products in Brazil, it may be important to investigate if some consumers, especially lower income individuals, may have migrated to cheaper illicit cigarettes in order to save money.10–12 This question is pertinent, because the evolution of the illegal market may undermine efforts to reduce smoking prevalence.13
Illicit cigarettes could indeed have become more attractive, given that they are mainly cheaper, non-duty paid, coming from a lower tax and lower cost neighbouring country, Paraguay. Moreover, there is no evidence of expensive or premium-brand smuggled cigarettes in the country.7 Prices of illegal Paraguayan cigarettes have been kept lower than those of cheap legal brands, because Brazilian consumers prefer legal to illegal cigarettes; and there are also transaction costs to buy smuggled cigarettes (mainly, search efforts and greater perceived risks). From the supply side, Paraguayan cigarette prices are cheaper for two reasons: lower tobacco costs (a large part of Paraguayan tobacco inputs is smuggled from Brazil without any payment of Brazilian taxes) and lower Paraguayan cigarette taxes. Finally, Paraguayan cigarette production is mostly sold to smugglers without any tax payments in its country.7
Assessments of the tobacco illicit market are mostly made by the tobacco industry. Academic and statistical-based studies have found that industry-funded assessments tend to overestimate the size of the illicit market and are used to influence tobacco excise policy.14 ,15 In the case of Brazil, using trade volumes is not useful for illicit trade estimations, because cigarettes coming from Paraguay had no legal registration at all on Paraguayan or Brazilian Customs. Regretfully, Brazilian tax and health authorities have not promoted independent studies using other feasible methodologies.
In order to offset this type of biased information, and as one alternative, surveillance data on tobacco use could provide a regular source of information on the illicit market through several variables, such as brand names, prices, consumed quantities, health warnings and locale of purchasing (eg, bar, restaurant, street vendor, gas station, newspaper kiosks/newsstand, etc).13 ,16
The major aim of the present study is to compare the size of illicit tobacco consumption in Brazil between 2008 and 2013 using price information of two household tobacco surveillance surveys, in order to assess the relationship between the tax rate increases implemented after 2008 and the illicit participation in total cigarette consumption.
Methods
This study uses the GATS-Brazil 2008 and 2013 surveys.2 ,6 GATS-Brazil was a nationally representative cross-sectional survey and was designed to obtain data on tobacco use indicators using the same sampling procedures.
A stratified and weighted probabilistic sample with four selection stages (municipalities, census tracts, households and individuals aged 15 years and older in 2008—or 18 years and older in 2013) was used. A total of 39 847 households (in 2008) and 62 986 (in 2013) were selected for GATS-Brazil, after excluding, respectively, 11 164 (in 2008) and 18 781 (in 2013) vacant/non-existent units and refusals. Only one individual per household (39 425 in 2008 and 60 237 in 2013) was sampled to answer questions about tobacco use. For comparison purposes, a total of 37 317 individuals aged 18 years and older in 2008 were used in the analysis. Detailed methods for both surveys have been published elsewhere.2 ,6
Interviewees were identified by individual sociodemographic characteristics, such as:
Educational level: participants reported the number of years of education they had attained, which was grouped into 0–7 years of education (‘low’) and 8 or more years of education (‘high’). This cut point reflects the educational program’s efforts made in the past decade to increase the proportion of individuals who have at least 8 years of education.
Age: participants were grouped into ‘24 years-old or less’ and ‘older than 24 years’, as around 95% of the Brazilian population starts smoking before 25 years of age.6
Area of residence: dichotomised into ‘urban’ and ‘rural’.
Illicit cigarettes in Brazil are typically priced below legal, tax-paid cigarettes. Our method to estimate the volume of illicit cigarette consumption relies on calculating the fraction of smokers in the GATS survey whose effective purchase price of cigarettes is below the price that legal producers would charge, and applying that fraction to the market size of Brazilian cigarettes. We also consider that legal firms and its retailers do not provide discounts per packs. In 2008, only 1.3% of the interviewees said that they received or saw a discount in the past 30 days; in 2013, 0.6% of the respondents said that prices were below the minimum legal price and above the threshold price (TP) defined below, which could be seen as evidence of a retailing discount.
To establish a boundary between both legal and illegal markets, we defined a ‘threshold price’, which would cover: (1) production and distribution costs of a cheap brand, (2) excise and other taxes and (3) retail margins per pack, but without any net profit margin for the manufacturer. The rationale is that firms paying all costs and taxes would try to price their products above this TP to make some profit per pack; thus, it is expected that legal prices would be higher than this TP. Below that TP, cigarette products would be covering production and distribution costs and retail margins (otherwise distributors and retailers would not be in the market), but these prices would not include tax payments. More precisely, producers would make profits from not paying taxes and selling above their costs up to the TP. It is reasonable to expect that illicit (or non-duty paid) products would be distributed below the TP in order to attract smokers, and far from legal prices to forestall any possibility that legal products try to compete on prices.
From the above definition of TP, and given that the Brazilian structure of ad valorem tax and retail margin rates is based on final prices, the TP could be derived as follows:

The central question in the definition of a TP is the assumption about average production and distribution costs for cheap brands. Production costs include raw material and wage remuneration. Distribution costs include margins of wholesale distributors and material costs of distribution (fuel, equipment depreciation). The Secretariat of Federal Revenue—the tax administration body which collects this type of information from the companies—provided the production and distribution costs. The TP and its components for 2008 and 2013 are defined in table 2.
Threshold price* and its components, Brazil, 2008 and 2013
Then it was necessary to calculate the purchasing price per pack from the surveys. We combined two questions: (1) ‘The last time you bought manufactured cigarettes for yourself, how many cigarettes did you buy (“Cigarettes” OR “Number of Packs×Cigarettes”)?’ and (2) ‘In total, how much money did you pay for this purchase?’ so as to create an average value paid per pack of cigarettes in smokers’ last purchase.
Since we used the amount paid for a pack of cigarettes in smokers’ last purchase to estimate the illicit market, we excluded from the analysis occasional manufactured cigarette smokers (10.3% in 2008 and 12.1% in 2013) in an attempt to minimise recall bias. Among daily manufactured cigarette smokers, 9.8% in 2008 and 1.4% in 2013 were also excluded from the analysis as they stated they had never bought cigarettes for themselves.
After that, we dichotomised illicit consumption as follows. For 2008, illicit consumption was based on individuals who informed having paid less than BRL (Brazilian reais) 1.668 per cigarette pack. For 2013, those individuals paying less than BRL 3.236 per cigarette pack characterised the same phenomenon. As noted, this defined TP was smaller than the minimum price established by legislation (BRL 3.500).9 The TP is the price we estimate below which legal, tax-paid cigarettes will not be sold, because it only covers production and distribution costs plus taxes. Intuitively, a government-established minimum price must be larger than the TP because of the need to consider profit margins per pack; legal producers would otherwise have resisted the minimum price.
We also estimated the size of the illicit yearly consumption in Brazil among daily smokers who bought illicit cigarettes at their last purchase. For this purpose, we used information on manufactured cigarette daily consumption from the GATS Survey, which was based on two questions: (1) ‘Currently, do you smoke, (“Daily”, “Less than daily” and “Not at all)?’ and (2) (if “Daily”) ‘On average, how many (manufactured) cigarettes do you smoke per day?’; then we multiplied by 365 to obtain smokers’ yearly consumption.
Data analysis
Measures of the smoking prevalence rate and proportion of illicit manufactured cigarettes bought in the last purchase were stratified by sociodemographic variables. Moreover, the proportion of illicit consumption was also stratified by the amount of cigarettes smokers bought at their last purchase (more than a pack, one pack and less than a pack) with the objective of understanding whether price increases inconvenienced highly addicted smokers more than light smokers; finally, we also decided to distinguish between Brazil federal states with land borders and the others, in order to understand whether international transit contributed to the increase of illicit consumption. Unadjusted absolute differences over time were assessed by a χ2 test. Given the public health implications of our study, we also assessed the additive interaction to understand whether absolute differences in the proportion of illicit consumption between 2008 and 2013 were homogeneous by categories of selected variables.17 For this purpose, the generalised linear model using the Poisson family and Gaussian link function was specified to estimate the overall difference in the proportion of illicit consumption, adjusted simultaneously by gender, age group, educational level, area of residence, cigarette consumption and land borders, using p values ≤0.05 to define a significant interaction term.18
We also performed a sensitivity analysis to estimate the proportion of illicit consumption if the cut-off point varies up or down by 5%. We did not use higher percentages because, in the downward case, it would not make any economic sense, that is, cigarette packs would be considered legal after paying all taxes and retail margins, but only paying a small part of the production and distribution costs of a cheap brand.
Finally, the measures of total yearly illicit cigarette consumption and respective CI95% were also stratified by categories of selected variables.
STATA V.12.0 statistical application was used to take into account the complex sample weights.19
Results
The distribution of the Brazilian smoking population for 2008 and 2013 stratified by sociodemographic groups has been presented elsewhere.4
Daily manufactured cigarette smoking prevalence rates decreased between 2008 and 2013 from 13.3% to 10.8% (table 3). During the same period, the total proportion of illicit cigarette consumption and the total amount of yearly illicit manufactured consumption increased from 16.6% to 31.1% and from 13.0 to 24.3 billion of units, respectively. The same pattern over time was observed for all categories of selected variables. In an attempt to minimise information bias, we excluded from the analysis occasional smokers who represented around 10% of our initial manufactured cigarette smoking population. In fact, prices paid by occasional smokers in their last purchases (BRL 3.1 (2.9 to 3.4) in 2008 and BRL 5.7 (5.4 to 6.0) in 2013) were significantly statistically different from prices paid by daily smokers (BRL 2.5 (2.4 to 2.6) in 2008 and BRL 4.5 (4.4 to 4.6) in 2013). However, even if we had included these individuals in the analysis, the main conclusions would have remained virtually unaltered (eg, the proportion of illicit consumption would have increased from 15.8% in 2008 to 29.7% in 2013; data not shown).
Unadjusted smoking prevalence rates (%), proportion of illicit consumption (%), and amount of yearly cigarette consumption, by sociodemographic characteristics, amount of cigarettes bought at smokers’ last purchase, and Brazil’ Federal States land border status, 2008 and 2013
Smokers living in rural areas experienced a greater absolute increase in the proportion of illicit consumption (pinteraction<0.01) than those living in urban areas between 2008 and 2013. Moreover, daily smokers whose last purchase was more than a pack presented a larger absolute increase over time in the proportion of illicit consumption, as compared to those who bought less than a pack (pinteraction<0.01) (table 3). Average daily manufactured cigarette consumption was positively associated with the amount of cigarettes smokers bought at their last purchase as follows: in 2008, less than a pack, 9.3 (CI95% 7.9 to 10.7); one pack, 13.0 (CI95% 12.6 to 13.3); more than a pack, 20.1 (CI95% 19.2 to 21.0); in 2013, less than a pack, 6.0 (CI95% 5.3 to 6.8); a pack, 11.7 (CI95% 11.3 to 12.1); more than a pack, 19.1 (CI95% 18.0 to 20.2) (data not shown in a table).
The already high proportions of illicit consumption among daily manufactured smokers who live in cross-border states, which serve as gateways to the rest of the country, increased between 2008 and 2013 (table 3). As a consequence, the total yearly illicit cigarette consumption also increased from 4.7 billion of units to 8.4 billion of units.
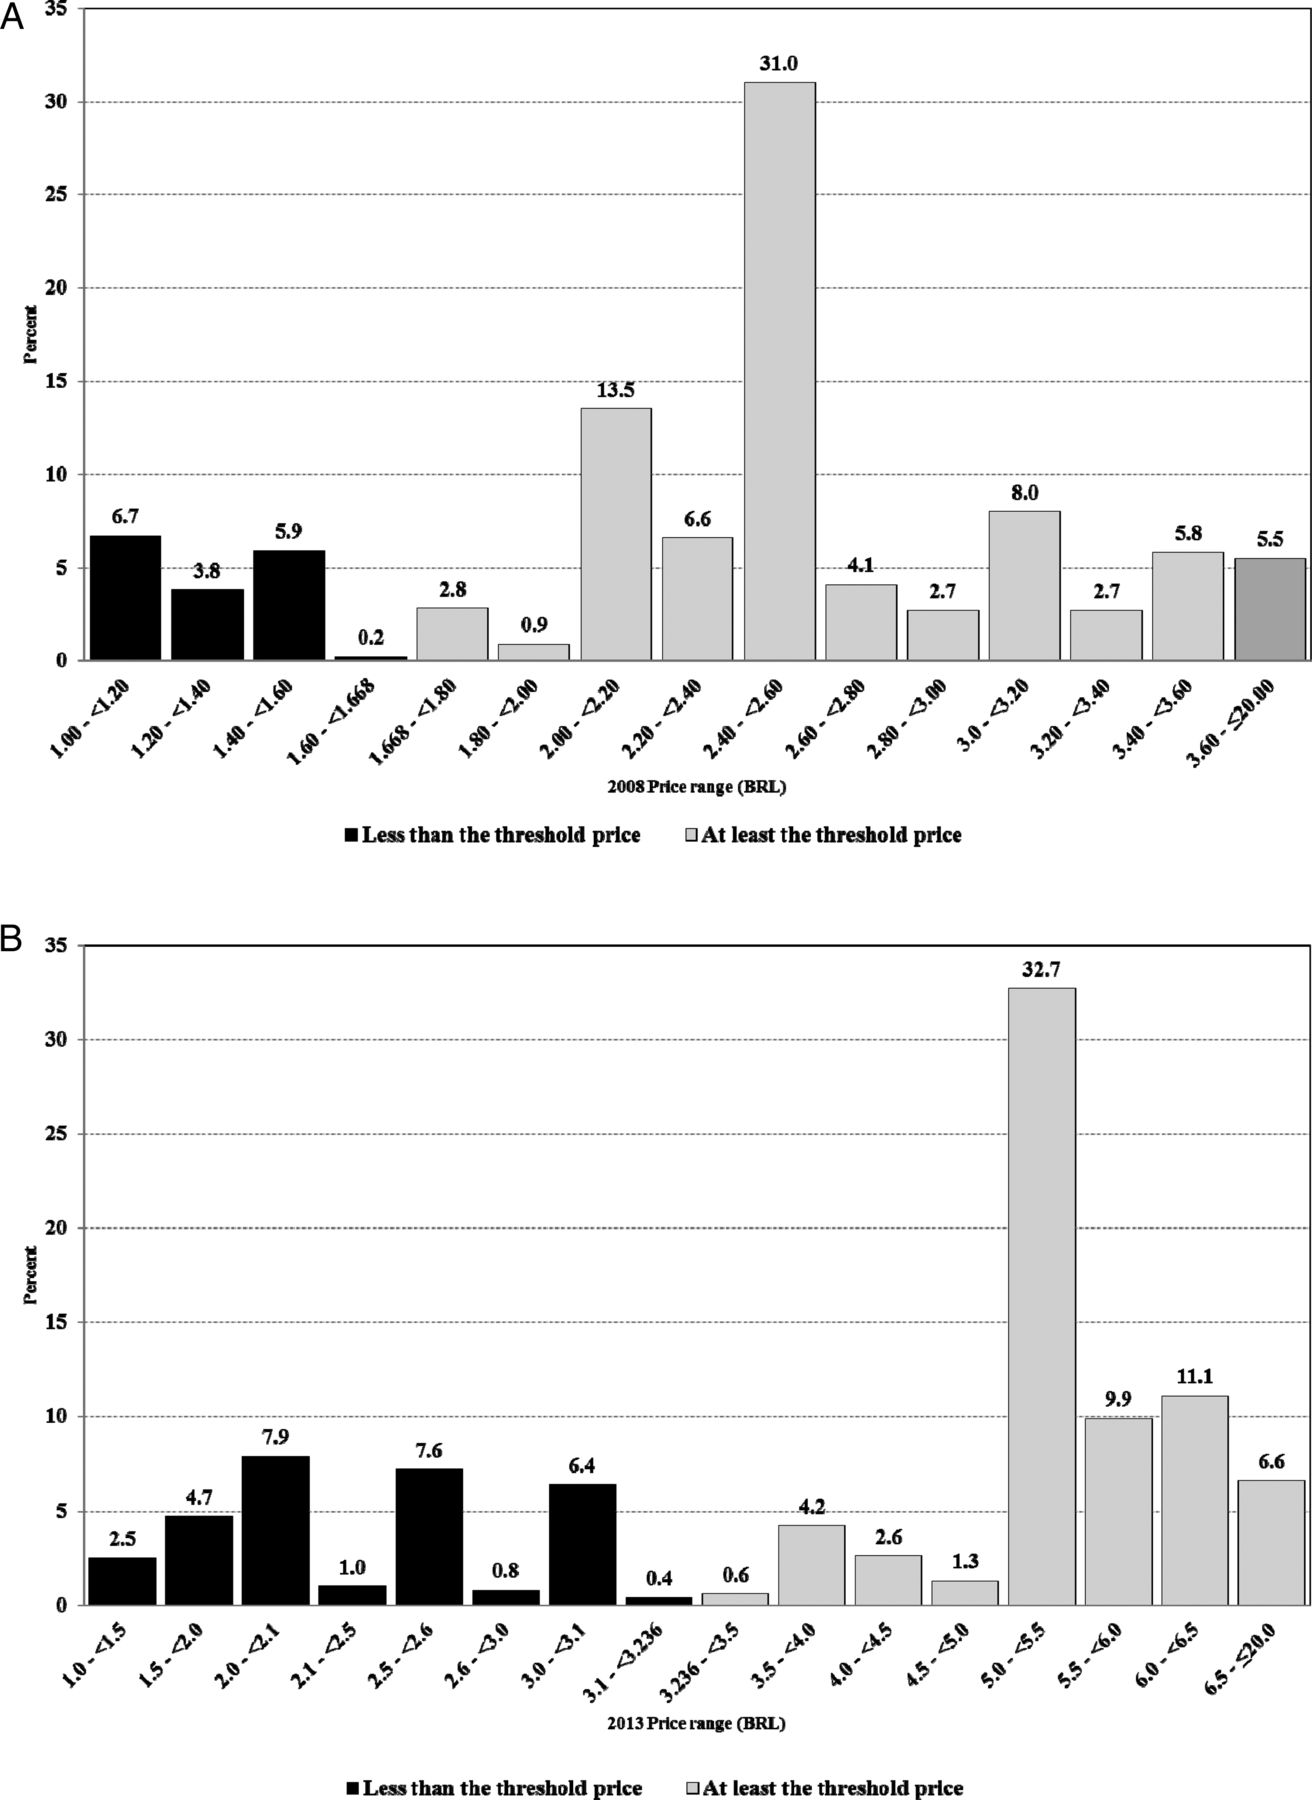
Figure 1 shows price frequencies below and above the TP of each year. Price frequencies are low around TPs, particularly in 2013, thus suggesting that prices of the illegal market are not concentrated close to the TP. Moreover, online supplementary table S1 highlights that the average price for legal cigarettes grew more than the average price for illegal cigarettes between 2008 and 2013 (101.5% vs 78.6%). Consequently, the price differential between illegal and legal products went up from −53.0% (−52.0% to −54.0%) in 2008 to −58.4% (−57.3% to −59.5%) in 2013.
Distribution of prices paid by cigarette smokers at their last purchases, Brazil, 2008 (A) and 2013 (B) (BRL, Brazilian reais).
When we varied the cut-off point up or down by 5% (data not shown), the main conclusions remained unchanged and the proportions of illicit cigarette consumption were as follows: lower bound, from 16.1% (14.5% to 17.8%) to 30.7% (28.3% to 33.2%); upper bound, from 18.7% (17.1% to 20.5%) to 31.5% (29.1% to 34.0%).
Discussion
The observed decrease in daily cigarette smoking prevalence rates in Brazil among all sociodemographic groups suggests that tobacco excise taxes and programmes implemented in recent years (eg, starting in 2008, several states began implementing 100% smoke-free air restrictions) may have been successful in reducing the smoking epidemic in the country.2 ,6 On the contrary, we found that the consumption composition has changed: illicit manufactured cigarette consumption increased among daily smokers who continued to smoke, or started to smoke between 2008 and 2013, irrespective of the selected sociodemographic variable. Moreover, as expected,11–13 ,20 particularly among the remaining vulnerable smokers (ie, those living in rural areas, with low educational level or with high cigarette consumption) we observed an increase in their already high baseline proportions of illicit consumption, thus undermining tobacco control efforts.
Recent tobacco industry public statements about illicit trade in Brazil indicated that, before 2012, the illicit trade was on a historical average of 20%, which is over but close to our 2008 estimation.21 In the same statement, the British American Tobacco authorities declared that the illicit market was 34% in 2014, a figure also in the neighbourhood of our analysis results.
The strategy of raising taxes has increased government revenues, reduced smoking prevalence and resulted in an increased illicit trade. For instance, cigarette excise tax collection more than doubled between 2006 and 2013 (from $1.10 billion to $2.36 billion).22 These three things could be compatible in a context of raising taxes where institutional and law enforcement barriers against smuggling flows are not reinforced. If a country increases taxes surrounded by a low tax and low law enforcement jurisdiction, it should increase its institutional barriers against illicit flows.
Between 2000 and 2007, fiscal and law enforcement authorities put in place measures to deal with domestic tax evasion and smuggling.7 In relation to domestic tax evasion, several obligations to cigarette manufacturing were imposed, and a system of unique identification in each pack of cigarettes was implemented (SCORPIOS) with controls of assembling lines, thus eliminating any possibility of under-reporting in the legal established factories in Brazil.13
However, our findings suggest that current antismuggling policies in Brazil were not so efficient in preventing cigarette supply at cheaper prices than the minimum price established by law and the one necessary to cover all costs plus taxes. The Brazilian government should have increased its dialogue and cooperation with Paraguayan authorities to enforce the law in the neighbouring country (or at least to encourage it) and to negotiate legal exports from Paraguay to Brazil after the tax increase (otherwise, illegal export would become financially more attractive, as in fact happened). It is also important that Brazil and its neighbouring countries harmonise their tax policies and fully implement article 15 of the WHO Framework Convention on Tobacco Control (FCTC) and ratify the FCTC Protocol to Eliminate Illicit Tobacco Trade.23 ,24
To regularly track the evolution of the tobacco illicit market in Brazil, it is important to develop different estimation strategies to measure the extent of overall tax evasion, such as a comparison of data from duty-paid sales and self-reported data on tobacco consumption13; or, alternatively, purchase price data from consumer price surveys. Merriman25 proposed a methodology to obtain an overall measure of illicit trade using legal sales, self-reported consumption data from surveillance surveys such as GATS-Brazil and VIGITEL (ie, a telephone survey conducted among adults living in Brazilian state capitals),2 ,26 and an assumption of the proportion of under-reporting in relation to total consumption/sales. Basically, in its methodology, self-reported total consumption from surveys could be considered a constant proportion of total sales (legal+ illegal), and this proportion should be calculated in a year with known figures of illegal sales. Applying this methodology to our case, and considering 2008 as a baseline year, where the amount of illicit consumption is calculated by our methodology for daily and occasional smokers (data not shown), it is possible to estimate a proportion of under-reporting for the Brazilian case (table 4). Having obtained this under-reporting parameter, and knowing the self-reported consumption and legal sales in 2013, it is possible to estimate the amount of total consumption/sales and, after deducting legal sales, obtain the amount and proportion of illegal sales for 2013. Thus, with a different methodology—just having an estimation of the proportion of under-reporting in the country—we arrived at a similar proportion of illicit consumption of the country, that is, 33.2% of the total cigarette market (vs 32.3%, when considering the number of illicit cigarettes consumed among daily and occasional smokers in 2013 as a proportion of the total number of cigarettes consumed; data not shown).
Merrimańs methodology to estimate the illicit market in 2013
Limitations
Biases may have resulted from self-reporting tobacco behaviours as follows: (1) there may be an increasing tendency over time to under-report cigarette consumption due to the growing social disapproval associated with smoking27 and (2) smokers who stated that they had never bought cigarettes for themselves (10% in 2008 and 1.4% in 2013) were excluded from the analysis. Since these individuals smoked, on average, 14.2 and 6.0 cigarettes/day, respectively (data not shown), the total amount of annual illicit cigarette consumption presented in this paper was most likely underestimated, especially in 2008. However, data from official legal sales also suggest a temporal decrease in overall cigarette consumption and an increase in the illegal market.
Finally, our data did not provide information on brand name, which could have allowed us to better understand the different types of illicit practices in the Brazilian market: whether the pack was (1) smuggled, (2) produced in Brazil but not having paid all taxes or (3) sold with discount below the minimum price established by law (for 2013, the defined TP (BRL 3.236) was indeed smaller than the minimum price established by legislation (BRL 3.500); however, this ‘evasion of the minimum price law/discount market’ was reported by <1% of our daily manufactured cigarette smoking population (see figure 1).
Conclusion
Future studies are important to understand the impacts of the new tax structure implemented in Brazil in 2012 on both the decline in smoking prevalence and increase in illegal cigarette consumption among remaining smokers. Further research to evaluate the degree of non-compliance of current tobacco control laws is also necessary for countries and, in particular, for Brazil to move forward with stronger actions.
What this paper adds
Assessments of the tobacco illicit market are mostly made by the tobacco industry. Academic and statistical-based studies have found that industry-funded assessments tend to overestimate the size of the illicit market.
This study used tobacco surveillance data to estimate the extent of illicit tobacco consumption before and after excise tax increases.
The strategy of raising taxes has increased government revenues. Moreover, we observed a pattern of unadjusted absolute decreases in cigarette smoking prevalence and increases in the proportion of illicit consumption, irrespective of gender, age, educational level and amount of cigarettes consumed.
Surveillance data can be used to provide information on illicit tobacco trade to help in the implementation of the WHO Framework Convention on Tobacco Control (FCTC) article 15 and the FCTC Protocol to Eliminate Illicit Trade in Tobacco Products.
References
Supplementary materials
Supplementary Data
This web only file has been produced by the BMJ Publishing Group from an electronic file supplied by the author(s) and has not been edited for content.
- Data supplement 1 - Online supplement
Footnotes
Contributors RMI prepared the methodology and participated in the data analysis and as the lead author in the elaboration/preparation of the article. ASS prepared the methodology and participated in the data analysis and in the elaboration/preparation of the article as a co-author. MCdS participated in the data processing and in the elaboration/preparation of the article as a co-author. LMdA participated in the elaboration/preparation of the article as a co-author.
Funding The GATS-Brazil was funded by the Brazilian Ministry of Health and the Bloomberg Foundation.
Competing interests None declared.
Provenance and peer review Not commissioned; externally peer reviewed.
Data sharing statement GATS-Brazil surveys are freely available at http://www.ibge.gov.br/home/.