Article Text

Abstract
Introduction The availability of flavoured tobacco products is associated with increased initiation and youth smoking. New York City prohibited all sales of flavoured cigars, cigarillos, little cigars, chew, snuff, snus, tobacco, pipe tobacco, roll-your-own tobacco, and dissolvables, excluding menthol, in October 2009; enforcement began in November 2010. This paper describes the sales ban evaluation.
Methods Data on retail tobacco sales of cigars, smokeless and other tobacco products such as pipe tobacco and roll-your-own, were analysed using interrupted time series methods, estimating changes in flavoured and non-flavoured tobacco product inflation-adjusted dollar sales overall, and by product type. Changes in ever use of flavoured tobacco products, any tobacco product use, and smoking prevalence among adolescents were estimated using multivariable logistic regression.
Results Sales of flavoured tobacco products declined overall (87%; p<0.001), and for flavoured cigars (86%; p<0.001) and flavoured pipe and roll-your-own (91%; p<0.001) following ban enforcement, while non-flavoured sales increased for cigars (5%; p=0.003) and pipe and roll-your-own (4%, p=0.030). In adjusted models, teens in 2013 had 37% lower odds of ever trying flavoured tobacco products (p<0.001), 28% lower odds of using any type of tobacco product (p=0.025), and a non-significant change in current smoking prevalence (p=0.114) compared with teens in 2010.
Conclusions Flavoured tobacco product sales and odds of ever using flavoured tobacco products or using any tobacco products among teens declined significantly after ban enforcement began. Collectively these findings demonstrate significant evidence that the flavoured tobacco products sales ban was successful in New York City, and could succeed elsewhere.
- Non-cigarette tobacco products
- Priority/special populations
- Public policy
Statistics from Altmetric.com
Introduction
The growing availability of flavoured tobacco products is a concern in the public health community given evidence that use of these products is associated with increased youth smoking, initiation and experimentation.1–3 The flavouring agents added to tobacco products, which produce a range of tastes, from alcohol (eg, piña colada) to fruit (eg, peach) to candy (eg, chocolate), as well as menthol and other mint flavours, help conceal the coarse taste and toxicity of tobacco, producing a more appealing product that is easier for new users, like teens, to tolerate.2–5 Flavours have been used across the range of combustible tobacco products, including cigars, cigarillos, pipe tobacco, and roll-your-own tobacco, and smokeless products, including snus, chew and dissolvables. Analysis of tobacco industry documents indicates that the product promotion is intentionally targeted at adolescents and young adults despite the explicit US ban on directing tobacco advertisement at youth per the Master Settlement Agreement.2 ,5–7
Tobacco product sales trend data show that while cigarette sales are declining, cigar and smokeless sales are increasing.8 The empirical evidence demonstrates that youth prefer flavoured tobacco products over non-flavoured products. Research on national cigar preferences among youth and young adults have found that most prefer brands that offer flavoured products. These preferences are strong among females, blacks, cigarette smokers and daily cigar smokers.9 ,10 Delnevo et al9 also found an increase in the market share of flavoured cigars, from 41.9% to 49.5%, between 2008 and 2011. Smokeless sales trends have also increased between 2005 and 2011.11 Tobacco products, like cigars and smokeless tobacco, are often not subject to the same level of taxes as cigarettes, making them less expensive and increasing their attractiveness to youth, a price-sensitive group.12–14
The US sales trends for tobacco products (cigarettes, cigars and smokeless) are similar to youth trends in cigarette, cigar and smokeless use in New York City (NYC). Analysis of the NYC Youth Risk Behavior Survey (YRBS) showed that the prevalence of high school cigarette smoking has been stable between 2007 and 2013 (8.5% and 8.2%, p=0.648), while prevalence of current cigar smoking (4.5% vs 7.7%, p<0.001) and the proportion of dual use of cigarettes and cigars among current users (22.0% vs 33.4%, p<0.001) rose significantly during this time period.15 Tobacco use studies among youth have found that the prevalence of past 30-day cigar use is second only to cigarette use, with current use of cigars among adolescent males being twice as likely compared with current smokeless use16 Smokeless use among NYC youth has also increased since 2007 (2.2% vs 4.4%, p<0.001).15 These patterns of declining cigarette sales and stalled youth cigarette smoking reductions, coupled with increases in sales and prevalence of youth cigar and smokeless product use suggest that youth preference for flavoured tobacco products is contributing to this pattern.
In an effort to reduce the use of flavoured tobacco products among youth, the Food and Drug Administration (FDA) prohibited the production of flavoured cigarettes in September 2009, excluding menthol cigarettes. NYC followed suit in October 2009 by prohibiting the sales of all other flavoured tobacco products (other tobacco products (OTP): cigars, cigarillos, little cigars, chew, snuff, snus, tobacco, pipe tobacco, roll-your-own (RYO) tobacco and dissolvables), also excluding menthol. After successfully overcoming legal challenges, NYC began enforcing the sales ban on all flavoured OTP at the end of November 2010. Except in legally permitted tobacco bars, menthol flavoured tobacco products are now the only products with characterising flavour allowed to be sold in NYC.
This paper describes two analyses evaluating the NYC ban on flavoured OTP sales. We first analysed changes in flavoured and non-flavoured OTP sales in NYC before and after the ban using interrupted time-series analysis of OTP sales data. The second study separately assessed changes in the prevalence of adolescent experimentation with flavoured tobacco products, changes in the prevalence of adolescent use of any tobacco products, and changes in adolescent smoking prevalence before and after the ban using data from the NYC YRBS. We hypothesised that sales of flavoured tobacco products, and the prevalence of teens who had ever tried flavoured tobacco products, used any tobacco products, and currently smoke would all decline significantly following enforcement of the NYC ban.
Methods
OTP sales
Sample
Data on retail tobacco sales of cigars, smokeless tobacco, and all remaining tobacco products (including pipe and roll-your-own (RYO) tobacco) were obtained from Symphony Information Resources Inc for the five boroughs of NYC between 2008 and 2012. The data, listed by Universal Product Code (UPC) number, were aggregated over 4-week periods and included information on the dollar, unit and volume sales for each item. There were over 1000 unique UPCs listed for the study years. These data were collected from stores with annual sales over US$2 million (74% chain pharmacy, 12% grocery store, 7% dollar store, 4% gas station convenience store, 2% mass merchandiser, and 1% club store). The number of stores in the sample varied from 736 stores in 2008 to 868 stores in 2012, for a total of 922 unique stores.
Outcomes
All tobacco products were categorised into one of three types: cigars, smokeless, or pipe and RYO. Each product (ie, number of units) included a description (eg, PHILLIES STRAWBERRY BLUNT CIGAR 1CT) and these descriptors were used to categorise products as flavoured tobacco products (excluding any menthol or mint-related flavours) or not flavoured tobacco products (eg, SWISHER SWEETS REGULAR LITTLE CIGARS CIGAR 16CT). Products were categorised as flavoured tobacco products if the description included fruit (eg, grape), candy (eg, chocolate) or alcohol (eg, wine) flavours. All other products were categorised as non-flavoured tobacco. This non-flavoured group included menthol tobacco products; menthol products were identified by descriptors referring to menthol (eg, GAMBLER MENTHOL SMOKING TOBACCO 3OZ), or any mint flavours (eg, GRIZZLY MINT LONG MOIST SNUFF 1.2OZ, or KODIAK WINTERGREEN LONG MOIST SNUFF 6OZ). All the flavoured and menthol products were coded by one researcher and reviewed by a second researcher to ensure agreement. Product descriptions were checked for colour descriptors due to anecdotal observations that some NYC tobacco retailers carry products labelled as ‘purple’ or ‘red’, which were previously sold as grape and strawberry; no colour descriptors were found in the data set. The primary outcome variables were flavoured and non-flavoured inflation-adjusted dollars sold, created by summing the total number of tobacco product inflation-adjusted dollars sold per 4-week period. These variables represented the 4-week sales for flavoured and non-flavoured products. The Bureau of Labor Statistics Consumer Price Index Inflation Calculator was used to determine the per cent of inflation each year between 2008–2011 and 2012 (6.6% for 2008, 7.0% for 2009, 5.3% for 2010, and 2.1% for 2011) and dollar sales for each year were adjusted with their respective percentages.17
Analyses
The sales data were analysed using segmented regression for interrupted time series designs.18 The key variables in the model were a continuous time variable counting the 4-week periods (coded 1–65) to control for secular trends, a dummy variable representing enforcement of the NYC flavoured ban (coded 0 before the ban and 1 after) to estimate the mean change in sales following enforcement, and a variable to capture any changes in the sales trends following enforcement (coded 0 before the ban and continuously from 1 to 27 after) to assess the impact. The NYC flavoured tobacco product ban included all tobacco products except flavoured cigarettes, which were prohibited by the FDA ban in September 2009. We controlled for the effect of this policy on non-cigarette tobacco product sales with a dummy variable representing implementation of the FDA ban (coded 0 before the FDA ban and 1 after). A variable representing the number of stores each year, to adjust for variation in the number over time, was included.
The OTP sales models analysed the tobacco product inflation-adjusted dollar sales overall, and stratified by product type (cigars, smokeless and pipe and RYO) and flavoured versus non-flavoured, to assess trends in sales among products affected by the ban and those not affected. All analyses were conducted using the AUTOREG procedure in SAS 9.2 to account for autocorrelation in the data. Predicted mean sales overall and by product type were calculated to determine the per cent change between pre-ban and post-ban sales.
Ever use of flavoured tobacco products, and any use of tobacco products among teens
Sample design
Data on adolescent ever use of flavoured tobacco products, use of any tobacco products, and current smoking prevalence were obtained from NYC YRBS. The YRBS is a biennial anonymous, cross-sectional self-administered survey of public high school students in classrooms about their health-related behaviours. It uses a stratified, two-stage, cluster sample design to produce a representative sample of NYC public high school students. Pre-ban data came from the 2010 Special YRBS, which was conducted in an off year, as part of the Communities Putting Prevention to Work grant. Post-ban data came from the standard YRBS in 2013. In both years, school selection was proportional to enrolment, and eligible classes were randomly selected. The 2010 YRBS was completed by 1800 students from 28 schools, with an overall response rate of 79%. The 2013 YRBS was completed by 9439 students from 81 schools; the overall response rate was 71%. The YRBS surveys captured demographic characteristics as well as information about use of cigarettes, cigars and smokeless products.
Outcomes
The measure of ever flavoured tobacco product use in 2010 asked, ‘Have you ever tried any flavoured tobacco products, such as chocolate, candy, fruit, cinnamon, or alcohol-flavoured cigarettes, cigars, blunts, chewing tobacco, snus, snuff, dip, or dissolvable tobacco pellets?’ This item was modified slightly in 2013 to help improve comprehension: ‘Have you ever tried any flavoured tobacco products such as chocolate, candy, fruit, cinnamon, or alcohol-flavoured cigarettes or cigars?’ The measure of any tobacco use included respondents who currently smoked cigarettes (‘During the past 30 days, on how many days did you smoke cigarettes?’), were current cigar/cigarillo users (‘During the past 30 days, on how many days did you smoke cigars, cigarillos, or little cigars?’), were current smokeless users (‘During the past 30 days, on how many days did you use chewing tobacco, snuff, or dip, such as Redman, Levi Garrett, Beechnut, Skoal, Skoal Bandits, or Copenhagen?’), whoever tried flavoured tobacco products, and whoever tried menthol cigarettes (‘Have you ever tried smoking menthol cigarettes, even one or two puffs?’). The measure of current smoking was used as the third outcome.
Analyses
Analyses of the YRBS data included all teens ages 13–17 years, for samples of 1708 in 2010 and 8814 in 2013. Descriptive statistics were calculated for demographics (sex, race/ethnicity, and age), current smoking, current cigar and cigarillo use, current smokeless use, ever tried menthol cigarettes, and ever use of flavoured tobacco products. We compared demographics between 2010 and 2013 for the entire sample. Overall differences between years were assessed using t tests. Unadjusted logistic regression of the entire sample was used to separately test whether ever use of flavoured tobacco products, any use of tobacco products, and smoking prevalence declined between 2010 and 2013. The first multivariable logistic regression estimated the change in flavoured tobacco product use over time after adjusting for a priori selected covariates, which included sex, race/ethnicity, age and current use of cigarettes, cigar/cigarillos, smokeless, and ever use of menthol cigarettes. The second multivariate logistic regression estimated the change in any tobacco product use over time, adjusting for a priori selected covariates, sex, race/ethnicity and age. The third multivariate logistic regression estimated the change in current smoking over time, adjusting for sex, race/ethnicity, age, current cigar and smokeless use, and ever use of menthol cigarettes or flavoured tobacco products. The data were weighted to adjust for the probability of selection and post-stratified by sex within grades and race/ethnicity. Analysis utilised SAS V.9.2 and SAS-callable SUDAAN V.11.0.1 to account for the complex survey design and incorporate the weights into the analysis. An α of 0.05 was used to determine statistical significance.
Results
Sales data
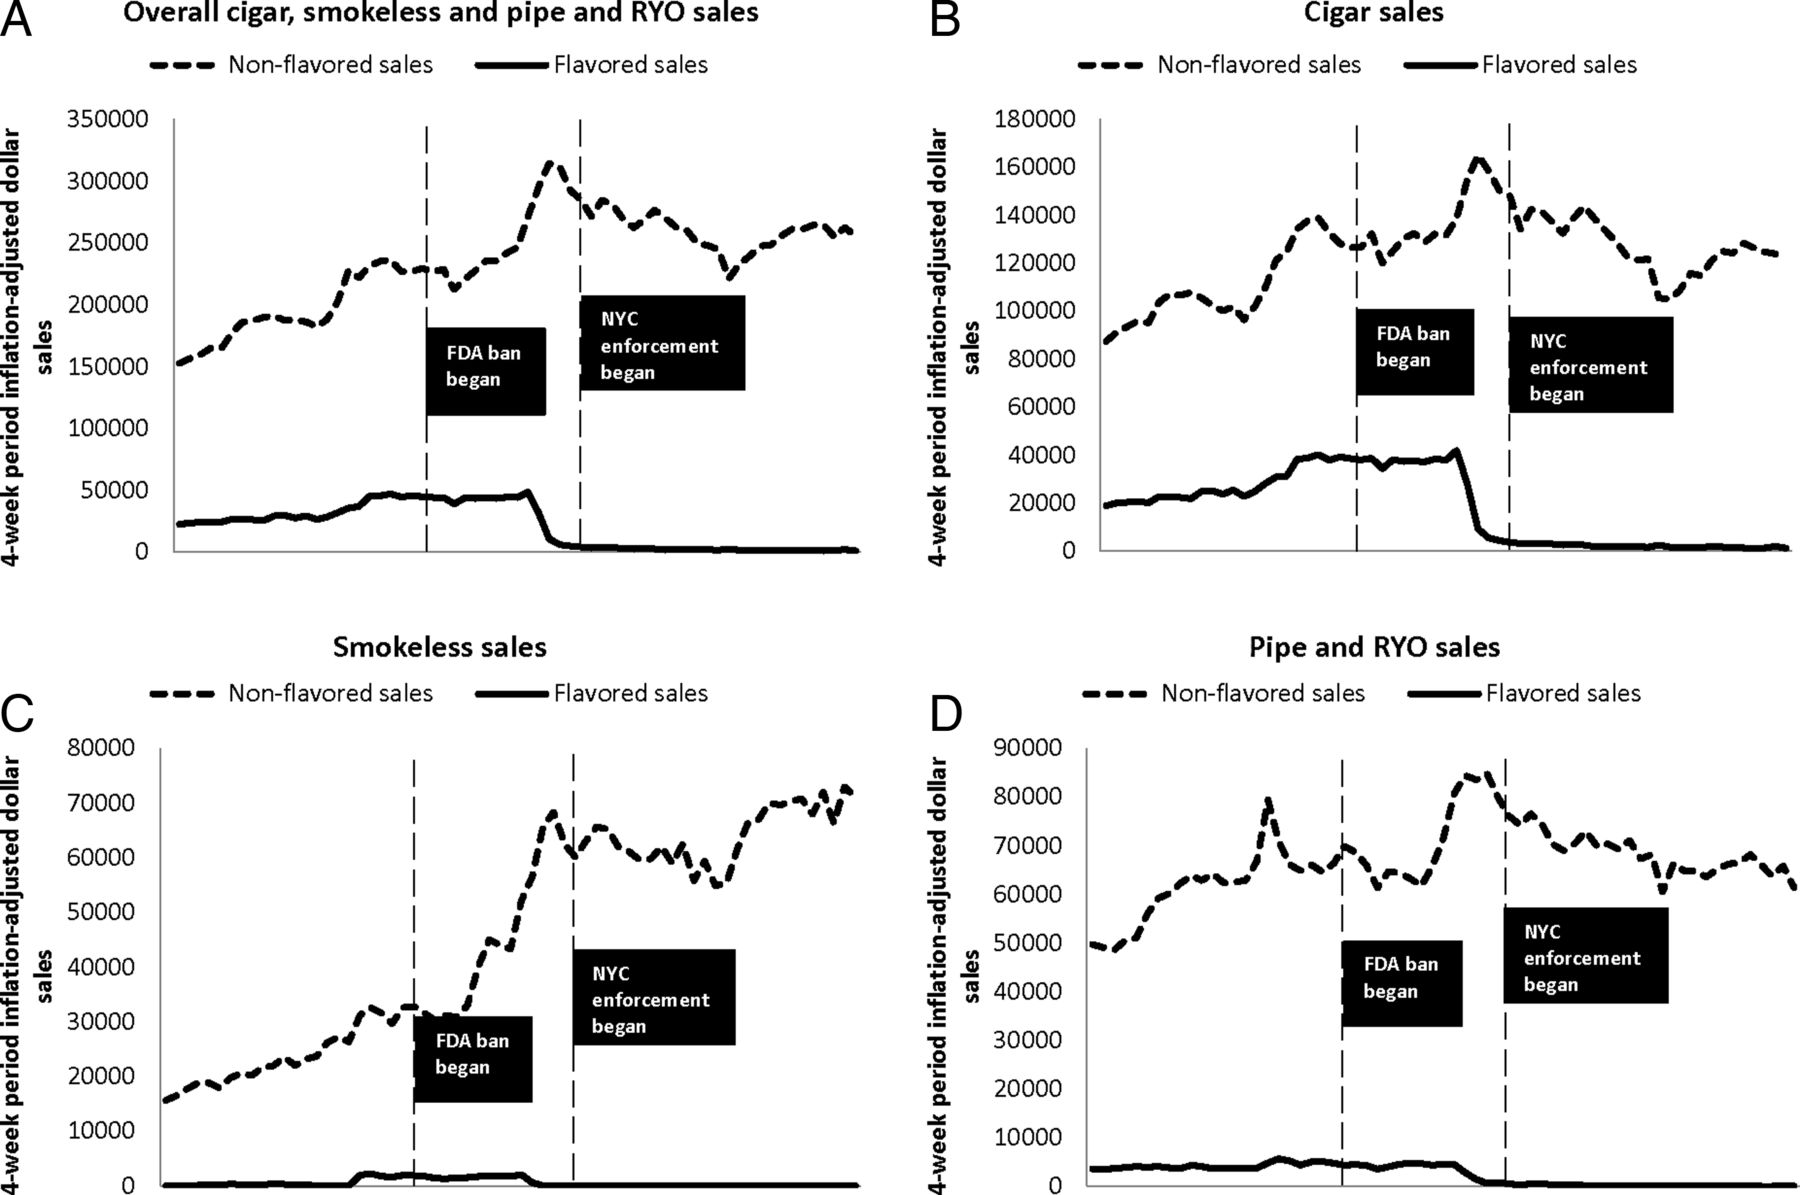
Figure 1 exhibits the trends in flavoured and non-flavoured tobacco product, 4-week period inflation-adjusted dollar sales between 2008 and 2012 overall, and for cigars, smokeless and pipe and RYO. Flags on each graph indicate when enforcement of the NYC flavoured ban began, as well as when the FDA ban on flavoured cigarettes took effect. All the figures demonstrate a decline in flavoured sales before enforcement of the NYC flavoured tobacco product sales ban took effect, as tobacco retailers were notified a few months before enforcement would commence. Non-flavoured sales show generally small increases in the post-NYC ban enforcement time period.

4-week period tobacco product sales, 2008–2012. NYC, New York City; RYO, roll-your-own.
Table 1 presents the results of the segmented regression models evaluating change in 4-week flavoured tobacco product sales before and after the NYC flavoured tobacco product ban overall and by product type. In the overall model, the mean sales of flavoured tobacco products significantly declined 87% following enforcement of the NYC ban (31 918.00 pre to 4227.07 post) (β=−20 247.00, p<0.001). This drop appears to have been driven by significant declines in sales of specific flavoured products, cigars (86%), and pipe and RYO (91%).
Changes in flavoured tobacco product inflation-adjusted dollar sales after a ban on sales of OTP, overall and by specific product type
Table 2 presents the results of the segmented regression models evaluating change in 4-week non-flavoured tobacco product sales before and after the NYC flavoured tobacco product ban overall and by product type. In the overall model, the mean sales of non-flavoured tobacco products showed a non-significant increase following enforcement of the NYC ban (18%, p=0.066). The changes in non-flavoured product-specific sales for cigars and pipe and RYO both demonstrated significant increases of 5% (p=0.003) and 4% (p=0.030), respectively. Additionally, all non-flavoured sales showed significant trends after enforcement, overall and across product types.
Changes in non-flavoured tobacco product inflation adjusted dollar sales after a ban on sales of OTP, overall and by specific product type
Flavoured product use among adolescents
Table 3 presents descriptive statistics for the YRBS samples overall, stratified by year (2010 vs 2013). Demographics were similar between years. The per cent of teens who reported ever using flavoured tobacco products suggested a decline of 20% between 2010 and 2013 (19.6% vs 15.6%, p=0.054).
Population demographics and smoking experiences among teens aged 13–17 years, special NYC CPPW YRBS 2010 and NYC YRBS 2013
Table 4 presents the adjusted ORs for ever use of flavoured tobacco products, any use of tobacco, and current smoking, comparing 2010 and 2013. In unadjusted models, teens in 2013 had 24% lower odds of ever trying flavoured tobacco products (OR 0.76, 95% CI (0.65 to 0.89), 14% lower odds of ever trying any tobacco products (OR 0.86, 95% CI (0.75 to 0.97)), and no difference in current smoking (OR 1.04, 95% CI (0.82 to 1.32)) than teens in 2010 (data not shown). In the adjusted ever-flavoured use model, teens in 2013 had 37% lower odds of ever-trying flavoured tobacco products than teens in 2010 (OR 0.63, 95% CI (0.52 to 0.77)). In the any-tobacco use adjusted model, teens in 2013 had 28% lower odds of ever using tobacco products than teens in 2010 (OR 0.72, 95% CI (0.62 to 0.85)). In the adjusted current smoking model, there was no significant difference in the odds of smoking among teens between 2010 and 2013 (OR 1.31, 95% CI (0.94 to 1.84)).
Multivariable logistic regression models of ever flavoured use, use of any tobacco products, and current smoking among teens aged 13–17 years, special NYC CPPW YRBS 2010 and NYC YRBS 2013
Discussion
To evaluate the ban on flavoured tobacco products in NYC, we analysed changes in the sales of flavoured and non-flavoured tobacco products, and ever use of flavoured tobacco products, any use of tobacco products, and current smoking among high school students in NYC. There were significant declines in the sales of flavoured tobacco products overall, and for cigars, and other flavoured tobacco products such as pipe tobacco and roll-your-own following enforcement of the NYC law. For non-flavoured sales, we found a non-significant increase in sales overall and small significant increases for cigars and pipes and RYO sales. We also found that the odds of ever using flavoured tobacco products and the odds of use of any tobacco products among teens decreased significantly in 2013 compared with 2010. There was no significant change in current smoking after the ban. Together, these results suggest that the ban on flavoured products in NYC was effective as adolescent experimentation with flavoured tobacco products as well as any tobacco products declined after enforcement, as have sales of flavoured OTP.
To our knowledge, this is the first evaluation of any ban on sales of flavoured tobacco products; it suggests modest success in reducing flavoured tobacco product sales as well as flavoured tobacco product, and any tobacco use overall among underaged teens. To supplement these findings, we reviewed flavoured tobacco violations assessed by the NYC Department of Consumer Affairs between the end of November 2010 and the end of 2014. These inspections are conducted at all tobacco retailers on an annual basis. Among all tobacco inspections conducted, 4% received flavoured violations in both 2010 and 2014, indicating that consistent low levels of flavoured tobacco product sales continue. These findings demonstrate that banning a particular type of tobacco product is a viable form of tobacco control that can be used at any jurisdictional level, providing local means for limiting access to harmful products not regulated elsewhere. While banning sales of flavoured tobacco products is an important step in preventing the uptake and use of tobacco, menthol-flavoured tobacco products remain available to adolescents. Adolescents who smoke cigarettes are significantly more likely to smoke menthol cigarettes (57%) compared with adults (aged 18–25 years: 45%; 26–34 years: 35%; 35 years and older: 31%), and studies have documented stronger tobacco dependence among menthol-smoking adolescents than among non-menthol smokers, leading researchers to suggest that menthol cigarettes may be a starter product for youth, or possibly attenuate cessation efforts.2–4 ,19–21
The ban demonstrated no overall association with sales of non-flavoured tobacco products, and may have contributed to increasing sales of non-flavoured cigars and pipes and RYO, although these increases may be attributable to national cigar sales increases generally.8 While non-significant, the more than 100% increase in non-flavoured smokeless sales also aligns with national sales trends.11 There was no evidence that the ban was associated with a decrease in the smoking prevalence among NYC teens.15 It is possible that over time, the ban will influence current smoking as well.
These analyses had several limitations. First, the sales data came from a non-random sample of 922 stores out of a tobacco retailer population exceeding 9000 citywide. These stores, mostly pharmacies, all had sales of over US$2 million annually, while the majority of NYC tobacco retailers are small, independently owned corner stores (ie, bodegas). Additionally, these data do not provide information about tobacco sales from Native American reservations or the black market. However, there is no systematic way to acquire sales data from these outlets, making larger retail stores the only source of traceable information on retail sales trends for specific tobacco products over time. Second, it is possible not all sales of flavoured tobacco products were identified in the data set due to vagaries of product labelling. Because product definitions are not available by UPC, we had to identify each item individually using product name descriptors. Consequently, it is possible that some products were overlooked or miscoded. This non-differential misclassification would likely lead to an underestimation of the changes in flavoured OTP sales and an overestimation of changes in non-flavoured OTP sales, and make our results conservative. Finally, it should be noted that sales data are only modestly influenced by youth tobacco use, as adolescents represent a small proportion of tobacco users.
The YRBS data were cross-sectional, preventing us from drawing causal inferences about the impact of the ban. The Special 2010 YRBS had a smaller sample size which increases variability in point estimates and could have lowered the likelihood of observing significant differences. However, this shortcoming would work against our predictions, further suggesting that our findings are conservative. It is possible that the flavoured tobacco product question was misinterpreted as including menthol or mint flavours; however, respondents answered a menthol cigarette use question prior to the flavoured use question in both years of the survey. This should reduce the potential for overlap, as menthol experiences were previously accounted for. The wording of the flavoured question was changed slightly between 2010 and 2013, removing blunts, chewing tobacco, snus, snuff, dip or dissolvable tobacco pellets from the question, products that are often flavoured. This wording modification simplified considerations for respondents but may have contributed to a lower estimate of flavoured tobacco product use in 2013 and, consequently, an overestimate of the decline across years. Since most tobacco use among teens centres around cigarettes and cigars, we retained those tobacco products in the list. Since the prevalence of current smokeless use among NYC adolescents was significantly less than either current cigarette or cigar use, we did not expect this wording change to have had a large impact on flavoured use overall, or the findings of our analysis. The measure of any tobacco product use was a mix of ever and current use variables, and may not have represented all possible tobacco products. However, it did include representation for cigarettes, cigars, smokeless, flavoured and menthol tobacco products.
Conclusions
Taken together, the results from the analyses of flavoured and non-flavoured tobacco product sales data, youth flavoured tobacco use, any tobacco use, and smoking prevalence, provide converging evidence to support the conclusion that the ban on sales of flavoured tobacco products was successful in reducing availability and use of these products. The decline in any tobacco use demonstrated that prohibiting flavoured tobacco products could contribute to reductions in tobacco use among youth, and initiation overall. Other jurisdictions might therefore consider adopting similar policies. While more time would be needed to assess changes in youth initiation due to the absence of flavoured tobacco products in retail stores, this initial decline is promising. More research in other jurisdictions will be needed to build a robust empirical evidence base.
What this paper adds
Current smoking habits among adolescents have been changing over time, with declining trends in prevalence of cigarette smoking, and increases in current use of cigars and other tobacco products, particularly, more flavoured and menthol tobacco products.
These changes in preference of tobacco products have been mirrored by national sales data as well.
Following the implementation of a ban on sales of flavoured tobacco products in New York City, this study is the first evaluation of a flavoured tobacco product sales ban in an urban jurisdiction.
The evaluation encompasses changes across the retail environment by estimating changes in flavoured and non-flavoured tobacco product sales over time, and changes in adolescent experimentation with flavoured tobacco products and any tobacco products. Sales data and longitudinal cross-sectional survey data show parallel trends.
Acknowledgments
The authors thank John Jasek for his willingness to review and comment on this manuscript.
References
Footnotes
Contributors SMF designed the study, performed the analysis and drafted and edited the manuscript. MJ supported study design and analysis, and edited the paper.
Funding This study was supported by the New York City Department of Health and Mental Hygiene and, in part, by Cooperative Agreement Number 1U58DP002419-01 from The Centers for Disease Control and Prevention—Communities Putting Prevention to Work and in part by Cooperative Agreement Number 5U58DP003689 from The Centers for Disease Control and Prevention—Community Transformation Grant. Its contents are solely the responsibility of the authors and do not necessarily represent the official views of the Centers for Disease Control and Prevention.
Competing interests None declared.
Ethics approval NYC Department of Health of Mental Hygiene IRB.
Provenance and peer review Not commissioned; externally peer reviewed.
Data sharing statement With appropriate review and approval, data from the New York City Department of Health and Mental Hygiene Youth Risk Behavior Survey are available on request.