Article Text

Abstract
Objective To analyze trends in excise taxes, real price and the affordability of cigarettes in Europe, and to examine the impact of EU wide tax policies on new member states.
Design We use a sample of 37 European countries with data from 2004 to 2010. 27 countries are EU member states of which 12 joined in 2004 or 2007 (new members), while 10 non-EU countries are included as a comparison. Data is sourced from the European Commission and the Economist Intelligence Unit.
Results The excise tax burden increased in all new member states between 2004 and 2010 while remaining relatively unchanged in existing member states. In 2010, the excise tax burden was higher in new (mean 63.8%) than in existing member states (mean 59.4%). Although cigarettes were significant cheaper in new member states the difference in affordability was narrower between the two groups. Excise taxes and prices rose aggressively in new member states while the increases in existing member states were smaller. While cigarettes became less affordable in most EU member states there was little difference between new and existing member states. The average annual percentage change in per-capita cigarette consumption was negative in all existing member states and in 9 of 12 new member states between 2004 and 2010, indicating declining per-capita cigarette consumption.
Conclusions Joining the EU results in significant increases in excise taxes and prices, and declines in affordability. Additionally, the structure of taxes, specifically the high excise tax floor resulted in higher taxes and prices.
- Economics
- Price
- Taxation
Statistics from Altmetric.com
Introduction
Economic growth and associated increases in income can weaken tax-based and price-based tobacco control measures designed to reduce tobacco use. Affordability is a concept that simultaneously considers the impact of price and income on consumption: an increase in price makes tobacco products less affordable, while an increase in income makes them more affordable. Recent studies show that, on average, cigarettes are becoming less affordable in high-income countries, but more affordable in low-income and middle-income countries,1 where cigarette affordability is also increasing at a more rapid rate due to unprecedented rates of economic growth. This information has led to calls to benchmark tax and price policies to affordability rather than price in rapidly growing economies.2
The affordability of cigarettes in Europe and its ramifications deserve special attention given the existence of both a uniform tobacco tax policy within the European Union (EU) and country-specific tax policies in the rest of Europe. The EU requires its members to meet a minimum excise tax burden (defined as the percentage share of excise tax in retail price) as well as a minimum excise tax amount collected per cigarette (excise tax floor). Since 1993, the minimum excise tax burden is 57% of retail price of the most popular price category (MPPC),3–5 and the total excise tax must be at least €64 per 1000 cigarettes6 implying an excise tax floor of €1.28 per pack of 20 cigarettes. In addition, the excise tax must have both specific and ad valorem components. This policy results in similar tax burdens across EU countries, which is among the highest in the world. The minimum excise tax burden, however, does not guarantee the same level of prices across the EU since the tobacco industry carries significant power to set prices, often with a goal of keeping cigarettes affordable.
In the EU, the tobacco excise tax regulations are reviewed every 4 years. The most recent review in 2008 resulted in an increase in the excise tax benchmark from the current 57% to 60%, and the total minimum excise (including both ad valorem and specific excise) to €90 per 1000 cigarettes as of January 20147 (€1.80 per pack of 20 cigarettes). Additionally, the MPPC benchmark price has been changed to the weighted average retail price. The new EU member states must meet the minimum tax requirements within a relatively short period of time after the accession, leading to substantial tax increases among most of them. However, if the EU accession also stimulates rapid economic growth, increased average incomes could negate the impact of higher taxes and prices on cigarette consumption.
The purpose of this paper is to assess the trends in affordability of cigarettes in Europe since the significant enlargement of the EU in 2004. Twelve new countries with different cigarette prices and tobacco excise tax policies joined the EU between 2004 and 2007. Particular attention is paid to new EU members in order to study how the EU tobacco tax regime influenced the affordability of cigarettes in those countries, and to contrast this trend with the situation in EU member states of longer standing, as well as other European countries that are not EU members. This analysis is important for the EU, and also serves as an example of the impact of tobacco tax policy coordination within a regional bloc, which may be considered a policy option in other parts of the world where interest in regional economic integration is growing.
Data and methods
Data on cigarette prices and per capita gross domestic product (GDP) were available for three groups of countries (box 1). The first group includes 15 countries that were EU members prior to the 2004 expansion (the EU 15). The second group consists of 12 countries that became EU members during or after 2004 (EU 12+). The third group includes 10 countries that belong to the WHO EURO region, are not members of the EU (non-members), and for which we have data on cigarette prices.
Box 1 Countries included in the analysis (with EU accession date)
-
EU 15
-
Austria (1995)
-
Belgium (1957)
-
Denmark (1973)
-
Finland (1995)
-
France (1957)
-
Germany (1957)
-
Greece (1981)
-
Ireland (1973)
-
Italy (1957)
-
Luxembourg (1957)
-
The Netherlands (1957)
-
Portugal (1986)
-
Spain (1986)
-
Sweden (1995)
-
UK (1973)
-
EU 12+
-
Bulgaria (2007)
-
Cyprus (2004)
-
Czech Republic (2004)
-
Estonia (2004)
-
Hungary (2004)
-
Latvia (2004)
-
Lithuania (2004)
-
Malta (2004)
-
Poland (2004)
-
Romania (2007)
-
Slovakia (2004)
-
Slovenia (2004)
-
Non-EU member (belonging to WHO EURO region)
-
Azerbaijan
-
Iceland
-
Israel
-
Kazakhstan
-
Norway
-
Russian Federation
-
Serbia
-
Switzerland
-
Turkey
-
Ukraine
We use two sources of cigarette price data. For the EU member countries, the prices of the MPPC are obtained from the European Commission (EC).7 These prices were collected in May 2004 and in January and July of 2005–2010. The average of the January and July values is used as an annual figure, while the May 2004 figure represents 2004 prices. Prices are reported in euro per 1000 cigarettes, and were converted to prices per pack (20 cigarettes). Additionally, nominal prices are converted to real prices using the consumer price index (2005=100) for each year from the European Central Bank. Since the EC does not collect data for non-member states, we also employ the Economist Intelligence Unit's (EIU) ‘Worldwide Cost of Living Survey’ cigarette price data. EIU data include prices for two brands (Marlboro, or equivalent premium brand, and a local brand) sold in three retail environments (high-priced, medium-priced and low-priced) and collected typically twice a year (June and December) in a number of cities worldwide. We used the average of the June and December prices (unless the prices are collected only in one of these 2 months) for the least expensive brand sold in all three types of retail stores to represent the average annual price. The least expensive brand most closely corresponds to the MPPC (see table 1 for a comparison of the EIU and MPPC prices). Most countries in the EIU data are represented by a single city (the capital city or the commercial capital), but for a small number of countries, multiple cities are included. In that case, we used the average price of the cheapest cigarettes from all cities originally included in the EIU price survey. If another city is included at a later date we did not include it in the average in order to maintain consistency. Prices are collected in local currencies and are converted into euro using exchange rate data (average for the year) from the World Bank's World Development Indicators database.
Table 2 shows the measures of central tendency and variation for the two price series by country groups for 2010. Both the EIU and the EC data are available for the EU 15 countries, but for only half the EU 12+ countries (Bulgaria, Czech Republic, Hungary, Poland, Romania, and Slovakia). Therefore, we present the EC price data both for the whole EU group and for the subset of countries with both price measures (labelled ‘comparable’ in the table). The EC prices are slightly higher compared with the EIU prices, but the difference is not statistically significant. Thus, we used the EC prices for the EU countries and the EIU prices for the additional 10 non-member countries, which allowed us to include the largest possible number of countries.
Cigarette prices (2010) by price series and country groups
Per capita GDP is used as a broad measure of income, and is available in euro from the Eurostat database for the EU member countries and from the World Bank's World Development Indicators for the non-member countries in US dollars converted to euro.
There are two methods of measuring affordability. The relative income price (RIP)1 ,2 ,8 measures the percentage of per capita GDP required to purchase 100 packs of cigarettes. The higher the RIP, the less affordable cigarettes are, and vice versa. The minutes of labour method (MoL), on the other hand, measures the working time required to purchase a pack of cigarettes,9 based on net earnings. One can use median earnings (based on a number of occupations—the 50th percentile) or the 25th percentile as suggested by Kan,10 to account for inequalities in income. The differences between the methods are that RIP is available for a greater number of countries and on a more consistent (annual) basis generating larger samples of countries with a greater number of data points, and thus, enabling the analysis of trends. The MoL method is easier to interpret and allows adjustment for income inequality, but would result in analyses with a few years of data. Blecher and Van Walbeek (2009) show that the MoL and RIP methods are closely correlated, especially so in high-income countries (HICs), even when comparing the RIP to the MoL at the 25th percentile.11 Since the analysis of trend over time is of interest in the present study, and since 23 of the 27 EU countries in this study are HICs, we employed the RIP method. The annual average change in affordability is calculated using a constant growth regression rather than the change from 2004 to 2010. This reduces the impact of possible outliers in the first and/or the last years included in the time series.1 ,2 ,8 Furthermore, it takes into account the trends in the years between the first and last years, and is not solely reliant on the start and end values.
Results
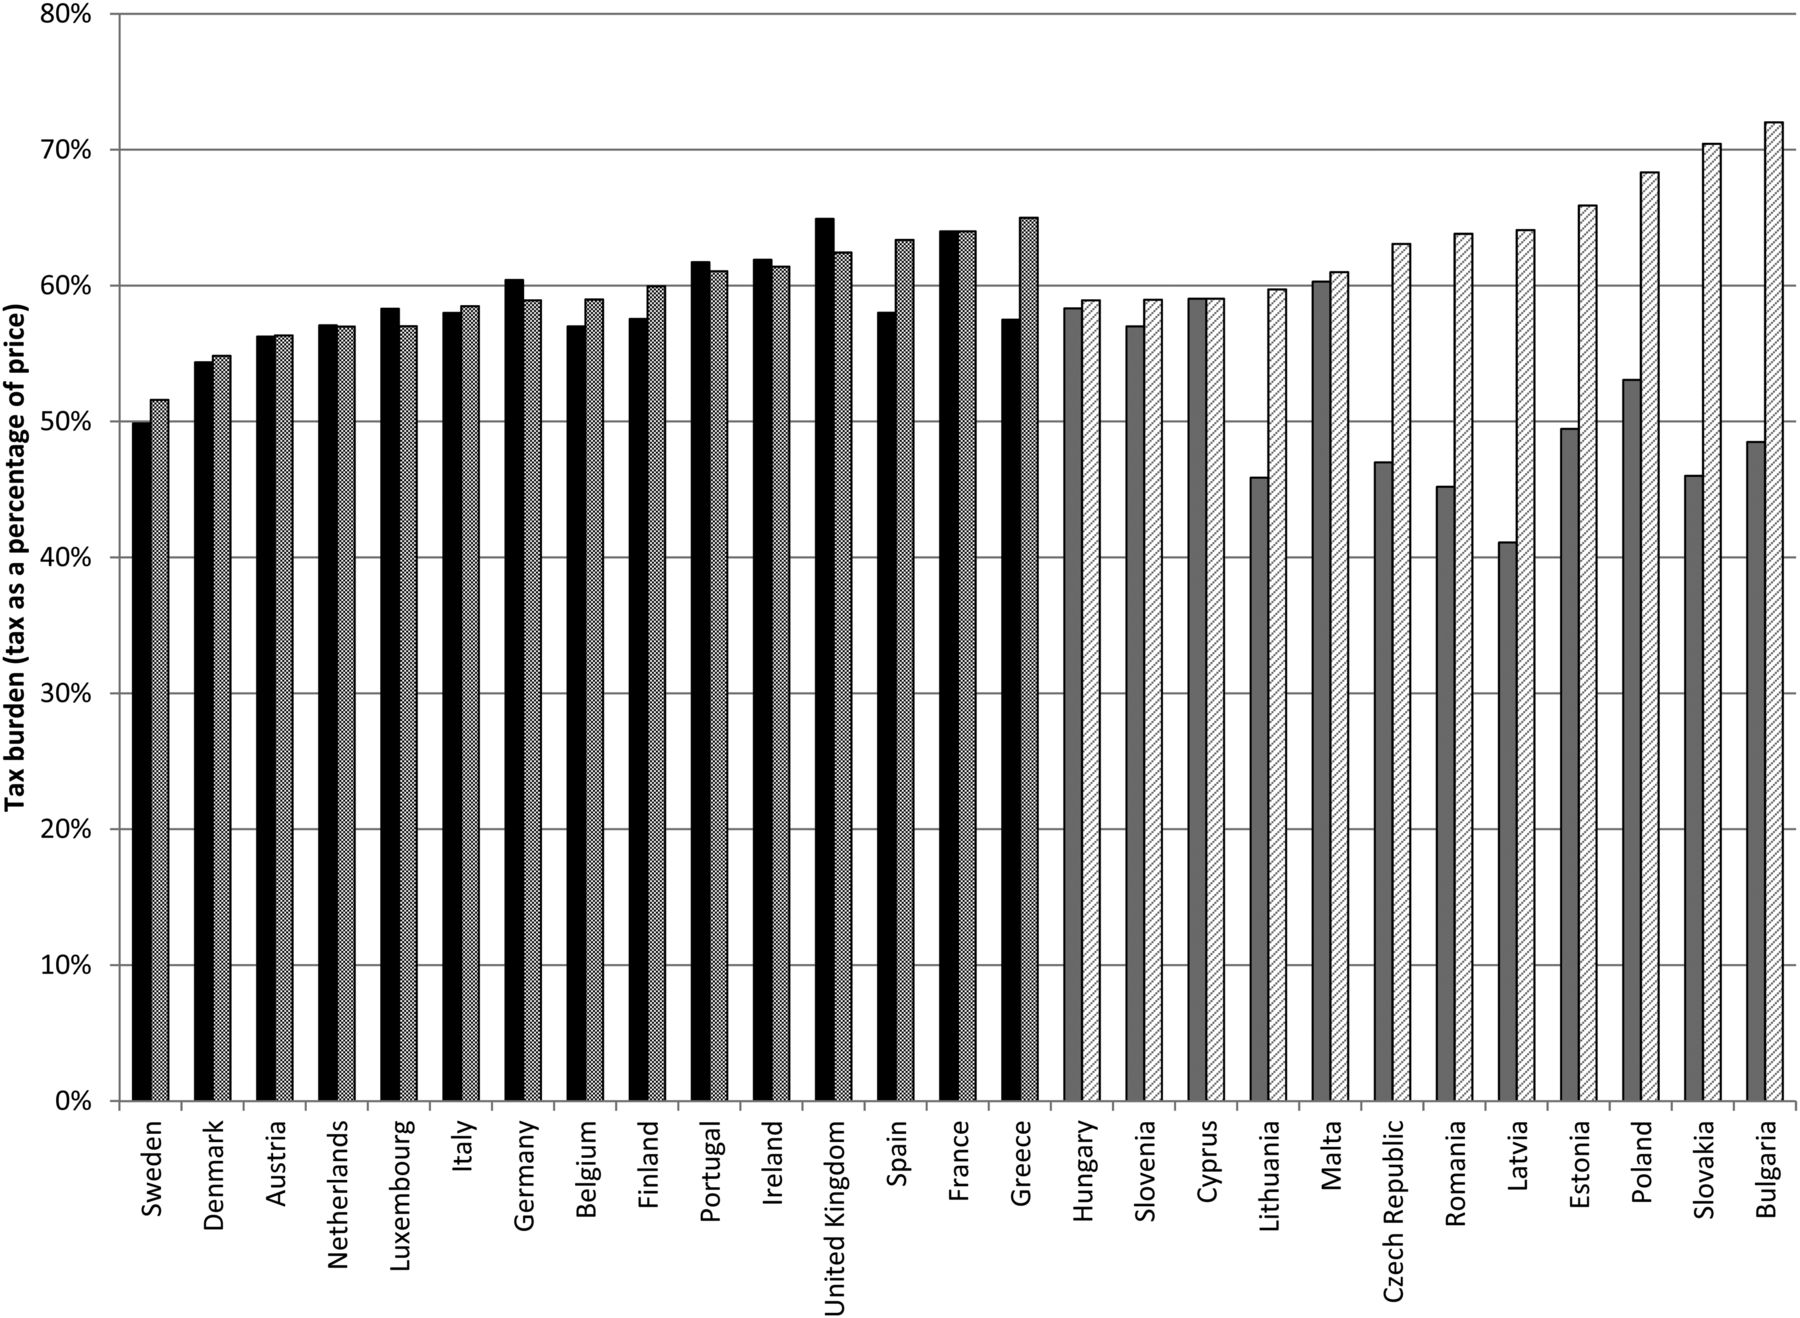
The excise tax burden (excise tax as a percentage of retail price) in most EU countries is above the established benchmark of 57%, with some countries setting their taxes significantly above it. Figure 1 shows the excise tax burden in 2004 and 2010 in EU 15 and EU 12+. The figure reveals an interesting trend: In 2004, the EU 15 countries had significantly higher excise tax burdens (mean 58.5%) than the EU 12+ countries (mean 50.9%). By 2010, the situation reversed and the EU 12+ group had a significantly higher excise tax burden (mean 63.8%) compared with the EU 15 group (mean 59.4%). Excise tax burdens significantly increased in EU 12+ countries, but changed little in EU 15 countries between 2004 and 2010. The higher-than-required excise tax burdens in the EU 12+ countries result from having to meet the excise tax floor of €1.28 per pack. In four EU 12+ countries, the excise tax floor alone exceeds the 57% minimum excise tax burden, and in six of them the excise tax floor represents more than 50% of the retail price. Among the EU 15 countries, the excise tax floor represents a maximum 40% of the MPPC price (Greece). This implies that it was the excise tax floor rather than the minimum excise tax burden that was driving tax increases in EU12+ countries.

Excise tax burden in EU member countries in 2004 and 2010. Note: European Union (EU) 15 in black and EU 12+ in grey. Solid bars are tax burden in 2004, and shaded bars are tax burden in 2010.
Figure 2 shows the price of cigarettes in euro by country group using 2010 data. The summary statistics are presented in table 1. On average, EU 15 countries have the highest prices (though the highest individual country price is in one non-EU member, Norway), the non-member countries have the lowest, and the EU 12+ countries lie in between. Furthermore, prices vary more among non-EU members compared with the EU members. This is to be expected since EU member countries have a common tobacco excise tax policy in addition to being much more homogeneous than the non-member countries, which include high-income countries like Switzerland, Iceland, Norway and Israel, emerging economies like Turkey and countries of the former Soviet Union. Cigarette prices in the high-income non-EU member countries would fit within the range of those found in the EU 15, but cigarette prices in the middle-income non-EU members (with the exception of Turkey) are significantly lower than in any EU member countries.

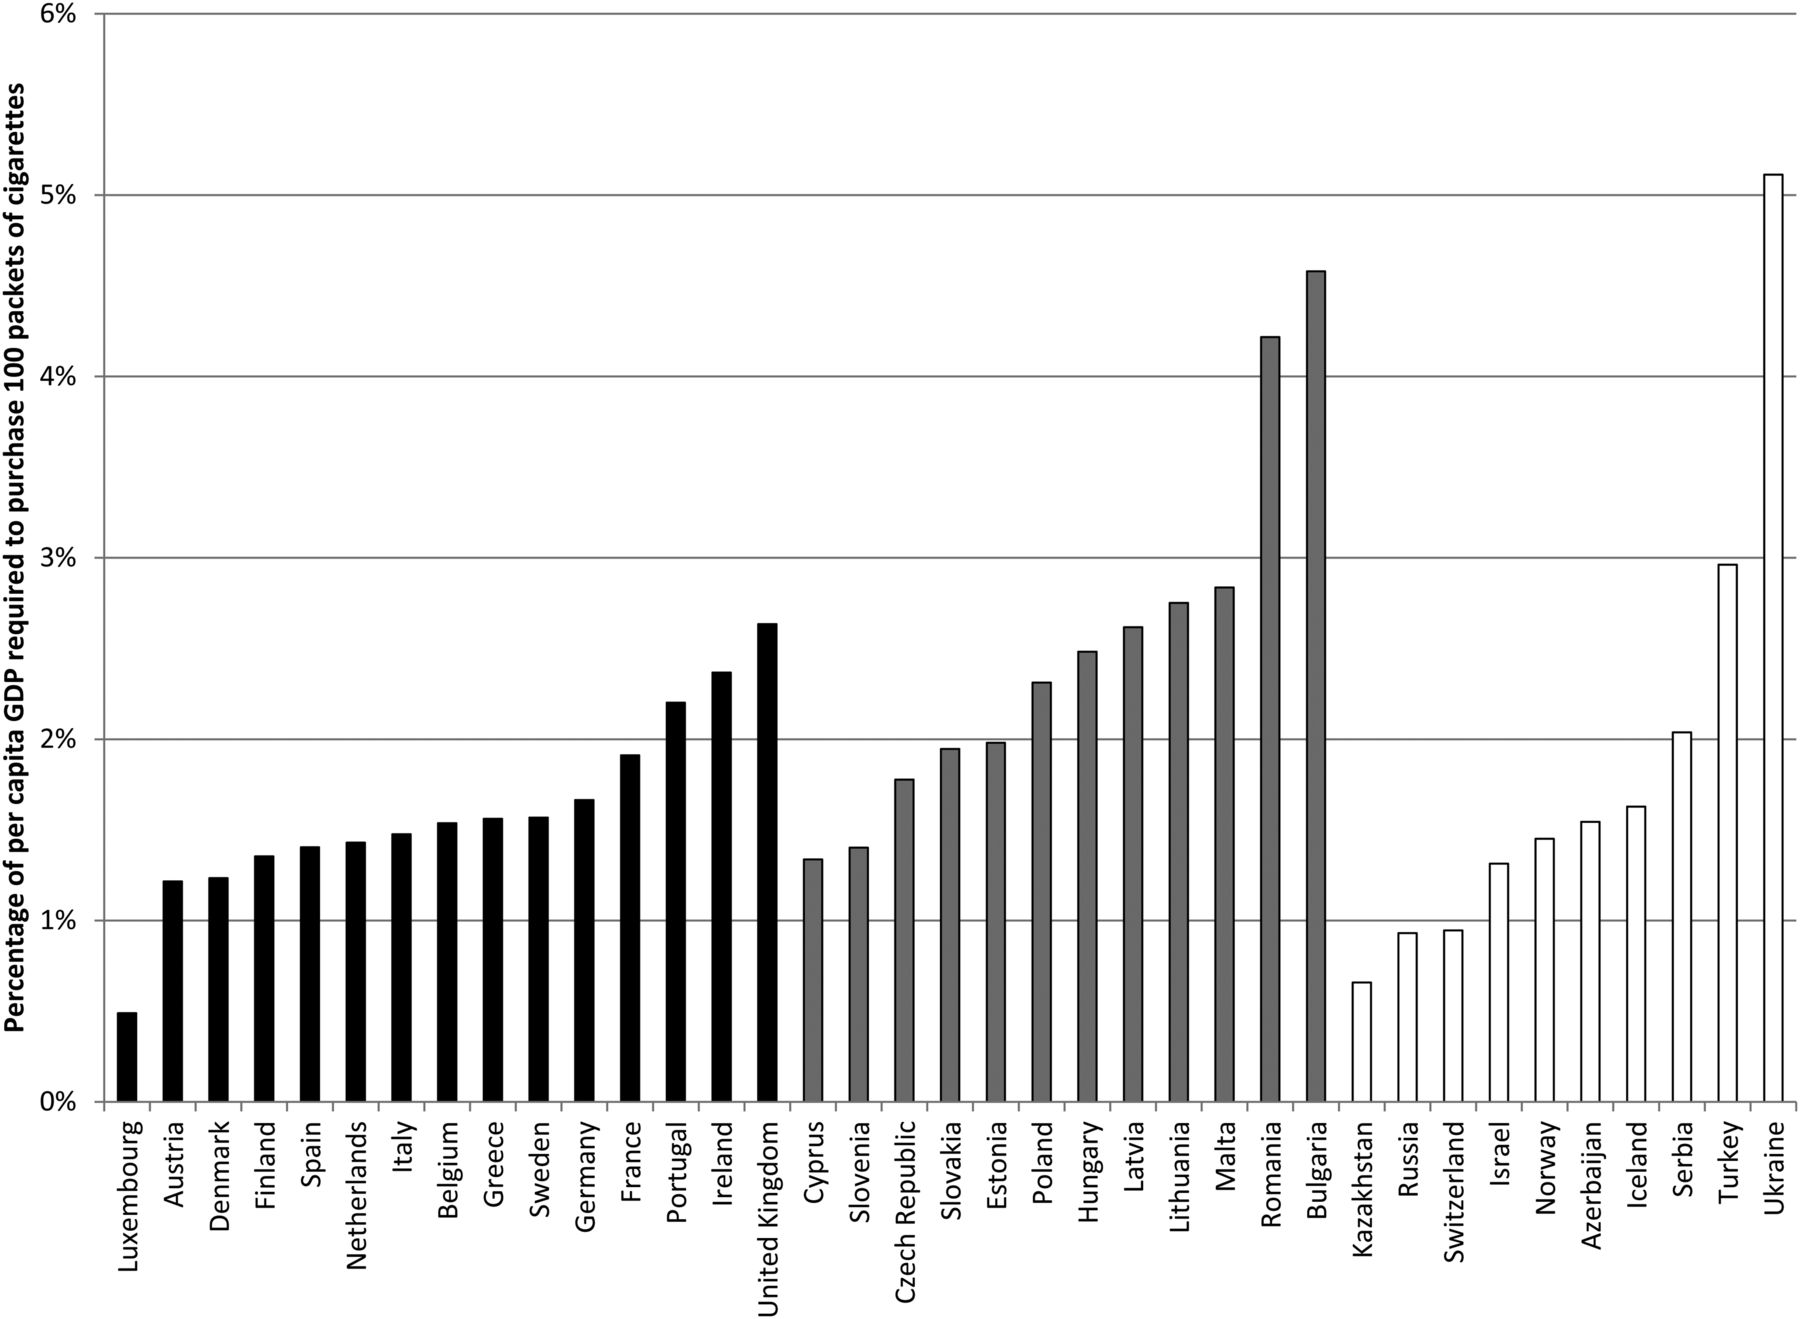
The affordability of cigarettes in 2010 is presented in figure 3, and the summary statistics are shown in table 2. Affordability is measured by the RIP, with a higher percentage, meaning that more income is required to purchase a pack of cigarettes, thus making them less affordable. Generally, cigarettes are least affordable in EU 12+ followed by the non-EU members, while cigarettes in the EU 15 countries are most affordable. The difference in average affordability between the EU 15 and non-EU members is much smaller than the difference in affordability between the EU 15 and EU 12+. Similar to the pattern observed for prices, the largest variation in cigarette affordability is among the non-member countries, reflecting the wide differences in income and cigarette prices. When considering the within-group variation, we find that cigarette affordability varies more within the EU 12+ and non-member groups than within the EU 15 countries, although this is not as clear when using the EIU data in a limited sample of EU 12+ countries.
Summary statistics for cigarette affordability (relative income price) in 2010

Figure 4 demonstrates the average annual percentage change in real price and excise tax per pack for 2004–2010. The tax data is only available for EU countries and is shown in the shaded bars, alongside prices in solid bars. The average annual growth rate in real cigarette prices is positive in most countries, meaning that real prices of cigarettes in the European region have been increasing between 2004 and 2010. Inflation-adjusted prices have fallen in only three EU 15 countries (Finland, France and the UK), although the declines in Finland and France were very small (0.3% per year). The average annual price change ranged from a minimum of −1.6% per annum (UK) to a maximum of 6.5% per annum (Italy) with a mean of 2.6% per annum. Prices grew much faster in the EU 12+ countries where six countries (half the group) experienced price increases higher than any of the EU 15 countries. The real price changes ranged from −2.3% per year in Cyprus to 24.3% per year in Latvia with a mean of 8.5%. The non-EU member countries had modest increases in real cigarette prices, averaging 1.3% per annum. Three of them (Norway, Russia and Turkey) had a decline in real cigarette prices with a particularly large drop in Russia (–10.3% per year), where nominal prices stayed flat and inflation reached 83% between 2004 and 2010.
Average annual growth rate in real cigarette price and excise tax per pack, 2004–2010. Note: European Union (EU) 15 in black, EU 12+ in grey and non-members in white. Solid bars are prices, shaded areas are excise tax. No excise tax data is available for non-EU members.
Data in figure 4 allow us to study the link between excise tax changes and price changes. The relative change in real excise tax per pack between 2004 and 2010 is in the same direction as the relative change in real price for 26 out of 27 countries for which data are available (r=0.96). The exception is Finland, where the change in both excise tax and price is very small. In EU 15, the increases in real excise tax are very similar to the increases in real price, indicating that tax increases are probably passed on to consumers. In EU 12+, increases in real excise tax are, in most cases, significantly larger than the increases in real price. However, to consider whether tax increases are under-shifted or over-shifted to consumers, one needs to examine the absolute changes in tax and price. If the value of the tax rises by X cents, and the price rises by greater than X cents, then the tax increase has been over-shifted to consumers. Among EU 15 countries, taxes were over-shifted 91% of the time (based on the total number of tax increases and the number of countries), while tax over-shifting occurred only 81% of the time among EU 12+ between 2004 and 2010. Nevertheless, the tax increases required in order to meet the EU benchmarks resulted in significantly larger tax and price increases in the EU 12+ countries than in the EU 15 countries between 2004 and 2010.
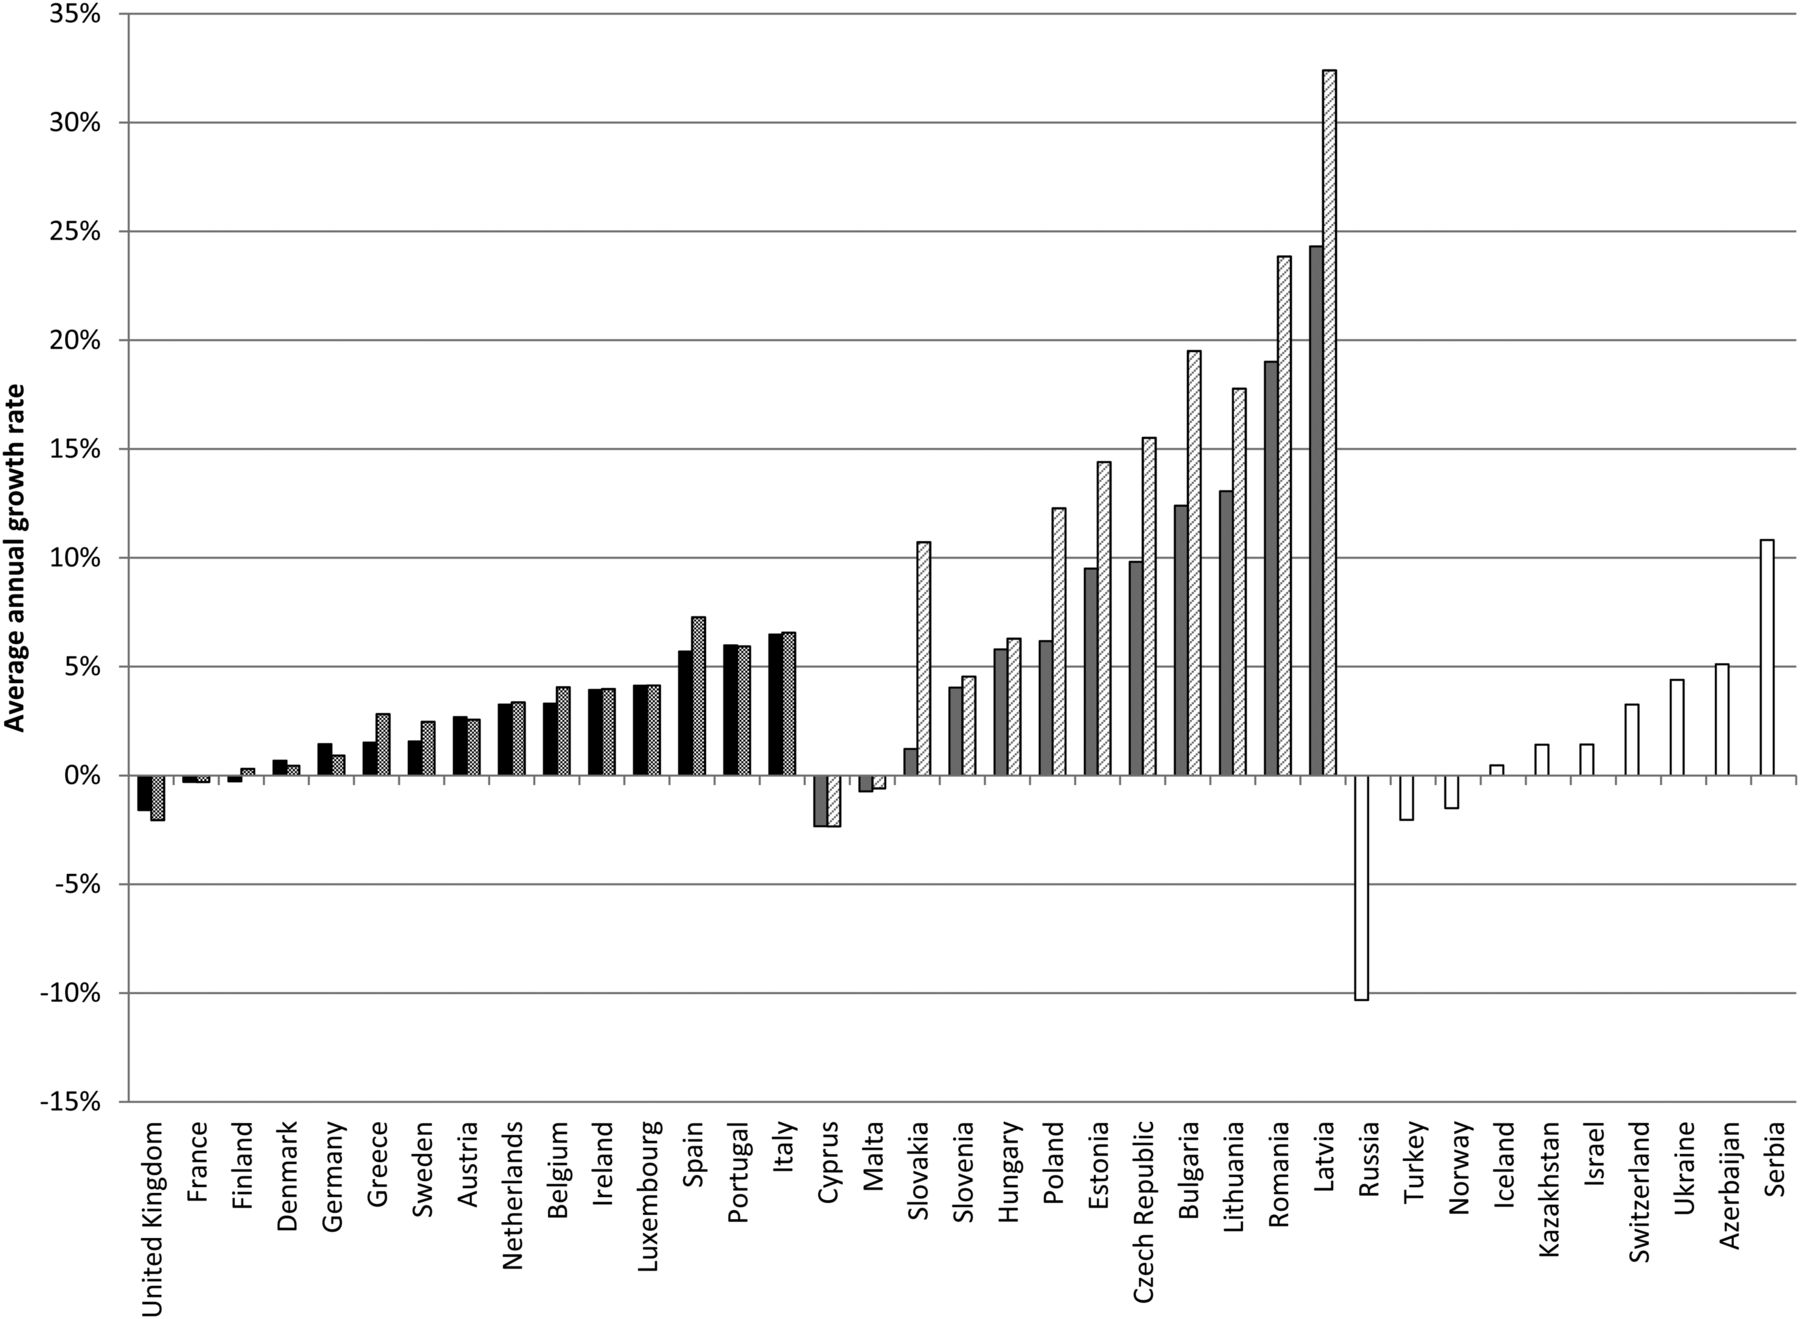
Figure 5 shows the average annual percentage change in affordability of cigarettes between 2004 and 2010, measured by the RIP. A positive value in figure 5 implies that the RIP has, on average, increased between 2004 and 2010, meaning that cigarettes have become less affordable. A negative value means that cigarettes have, on average, become more affordable. Since 2004, cigarettes became less affordable in 11 of the EU 15, in eight EU 12+ countries (despite the sizeable price increases in all of them), and in only three non-EU member countries. Two non-member countries, Azerbaijan and Russia, have experienced the largest increases in cigarette affordability in Europe.

Average annual growth rate in affordability (relative income price) of cigarettes, 2004–2010. Note: European Union (EU) 15 in black, EU 12+ in grey and non-members in white.
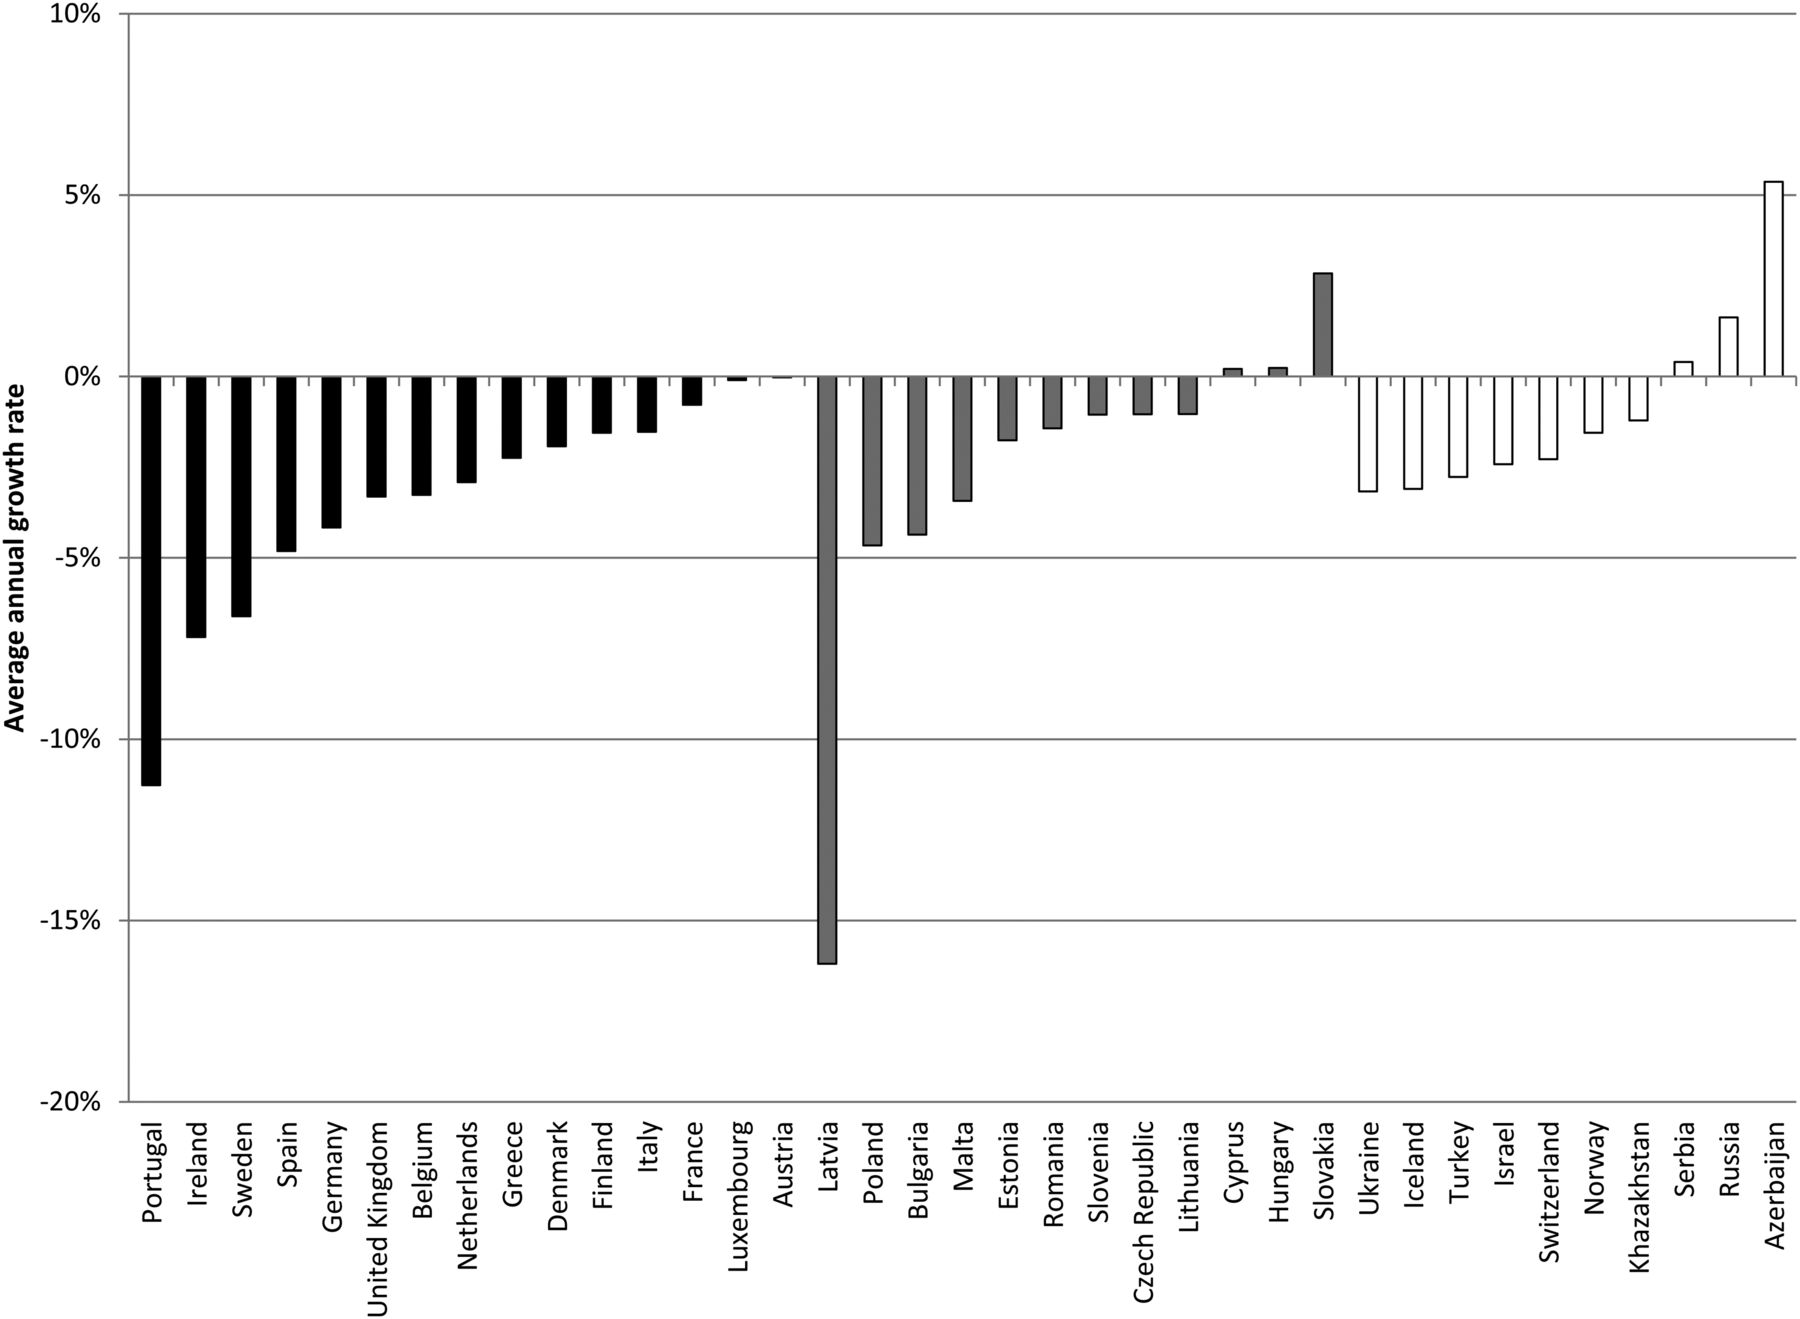
The change in affordability can be decomposed into a change in price and a change in income. Since a decline in income is hardly desirable as a tobacco control tool, the focus should be on a change in price, which can be achieved by tobacco tax policy. Figure 6 shows the changes in real cigarette prices and real per capita incomes (average annual growth rate) between 2004 and 2010, countrywise. Countries are ordered according to their change in cigarette affordability, starting from Russia, where cigarettes became more affordable at the most rapid rate, and ending with Latvia, where cigarettes became less affordable at the most rapid rate. Countries that have seen the largest increases in real cigarette prices between 2004 and 2010 have also experienced the largest increases in real per capita income (the correlation coefficient between the average annual percentage change in price and income is 0.74 in EU countries). This may explain why, as a result of the rapid economic growth, the increase in taxes and prices among EU 12+ countries did not necessarily translate into cigarettes becoming significantly less affordable. Examining figure 6 further, we notice that countries where cigarettes have become less affordable (on the right-hand side) have the fastest-growing prices (and taxes). For example, of the six EU countries which saw affordability decline by more than 4% per annum (Ireland, Italy, Latvia, Lithuania, Portugal and Romania), three, Latvia, Lithuania and Romania, experienced very strong economic growth, while cigarette prices (and taxes) increased even faster than their incomes. In a small number of countries (on the left-hand side in figure 6), income growth outstripped price growth, resulting in cigarettes becoming more affordable.

Average annual growth rate in real cigarette prices and income, 2004–2010. Note: prices in black, income in white, non-European Union members shaded.
Trends in smoking
Smoking prevalence data is not available as a time series for almost all countries in the sample, however, data on cigarette consumption is and may be able to better reflect trends in use during the period under discussion. Using data from the ERC Group, we are able to examine trends in annual per capita consumption of cigarettes using time series data between 2004 and 2010. Figure 7 measures the average annual percentage change in per capita consumption between 2004 and 2010.The average annual percentage change was negative in all EU 15 countries between 2004 and 2010, meaning on average, per capita cigarette consumption declined in all EU 15 countries on an annual basis. This is encouraging, but not surprising, given that cigarettes became less affordable in 11 of the 15 countries during the same period. Among the EU 12+ countries, the average annual change in per capita consumption was negative in nine countries and showed an increase in three countries (Cyprus, Hungary and Slovakia). Notably, Slovakia which saw a 2.8% average annual increase in consumption had an annual average increase in affordability of 10.5% per year between 2004 and 2010. While a 2.8% annual increase does not seem large, the cumulative effect was an increase in per capita cigarette consumption of 9.3% between 2004 and 2010. Among non-EU member countries, the average annual change in per capita consumption was negative in seven countries and showed an increase in three countries (Azerbaijan, Russia and Serbia). Of all 27 European countries, the four largest average annual increases in affordability (Azerbaijan, Cyprus, Russia and Slovakia) all saw average annual increase in per capita consumption.

Average annual growth rate in per capita cigarette consumption, 2004–2010. Source: 32. Note: European Union (EU) 15 in black, EU 12+ in grey and non-members in white.
Discussion
Smoking represents the most prominent preventable cause of chronic disease, disability and premature death. Increasing prices of tobacco products and making them less affordable over time is a necessary intervention to reduce the number of smokers and deaths in Europe and beyond.
This paper investigates affordability of cigarettes in Europe by studying the rate of change in affordability between 2004, the year of enlargement of the EU, and 2010. After the accession to the EU, EU 12+ countries had to align their tax structure with the existing EU tax regime. This led to substantial increases in tobacco excise taxes, as well as real cigarette prices exceeding those in EU 15. However, joining the EU had a positive effect on the economic growth in many EU 12+ countries, and this growth in income offset the impact of higher tobacco prices by modifying cigarette affordability. The accelerated economic growth in some cases negated the impact of tobacco excise tax harmonisation on the affordability of cigarettes in EU 12+ countries. An important question is whether tax and price increases occurred as a result of EU accession, or whether these countries were already increasing taxes and prices, or would have anyway. To answer this, one could contrast the trends in real cigarette prices prior to and after the EU accession. Unfortunately, data on prices prior to 2004 are available only for a few EU 12+ countries. For instance, between 2000 and 2004, the average annual change in real prices for three of these countries (Czech Republic, Hungary and Poland) was −0.7%, 6.3% and −0.7%, respectively, while between 2004 and 2010, they were 15.5%, 6.3% and 12.3%, respectively. Interestingly, Hungary, where prices had been increasing both prior to and after the EU accession, met the EU requirement upon entry, while the Czech Republic and Poland had to increase taxes substantially following the accession, in order to meet the EU benchmarks. While earlier data from three countries is not enough to generalise the trend in all EU 12+ countries, this example offers a more definitive description of the trend and serves as an interesting anecdote.
The pricing strategy of the tobacco industry has tried to lower the potential impact of excise tax harmonisation on tobacco use in Europe. Over-shifting of tax increases is more common in the EU 15 countries than in the EU 12+ countries. We found that the industry has absorbed parts of the tax increases in seven EU 12+ countries in some years, which kept cigarettes more affordable. This is not the first time the industry has applied a similar price strategy.12 The evidence of the impact of tobacco taxes on prices comes primarily from high-income countries. Early studies from the USA report different tendencies: cigarette tax increases not fully passed on to consumers,13–15 increases fully passed on to consumers,16 or prices surpassing tax increases.17–19 More recent studies often reported over-shifting of taxes—for example, in South Africa,20 ,21 the USA22–25 and Ukraine.26
All EU member states where cigarettes became less affordable increased their tobacco excise taxes above the inflation level. However, increasing excise taxes faster than inflation may not be enough to reduce cigarette affordability. Countries where incomes grow relatively rapidly, or where the industry can absorb relatively small tax increases, need to increase their taxes at well above the inflation rate to prevent an increase in cigarette affordability that could stimulate higher cigarette demand. WHO recommends that in countries where tobacco use increases with income, and where incomes grow at a more rapid pace than tobacco product prices, tax increases need to be large enough to offset the impact of higher real incomes.27
An important result of adopting the uniform EU tobacco tax policy was a reduction in variation in excise tax burdens across the region. The 2004–2010 within-group variation of the excise tax burden (measured by the coefficient of variation) stayed low and stable for the EU 15 (coefficient of variation=0.06), and declined substantially (from 0.13 in 2004 to 0.07 in 2010) for EU 12+ countries. This is an important finding that would support regional excise tax harmonisation as a measure to reduce tax avoidance and evasion that can be motivated by tax differences in neighbouring countries.27
A recent study that considered the relationship between cigarette prices, affordability and smoking prevalence in the EU28 concluded that cigarette affordability in the EU declined by 40% between 2003 and 2009, and that this decline did not result in significant reductions in smoking prevalence. However, the study suffers from several limitations. It measured affordability in only three individual years (2003, 2006 and 2009), and considered smoking prevalence estimates for only 2 years (2006 and 2009) based on small sample surveys. Analysing the relationship between changes in affordability and smoking prevalence based on such limited data can lead to distorted results. Even if the data points considered were not outliers, the impact of other factors, such as economic shocks (eg, financial crisis) in the chosen years, may bias the results. This is especially important given that 2009 was one of the most economically unstable years, worldwide, in decades.
There are noticeable differences in our results and those of Bogdanovica et al.28 While both studies show that cigarette affordability in the EU declined between 2004 and 2010, we found that per capita cigarette consumption declined, including the period covered by Bogdanovica and colleagues. Our measure of tobacco use relies on time-series data for per capita cigarette consumption which better represents the general trends than single time-period observations, and is less susceptible to the influence of outliers.
Further attention needs to be paid to the long-term trends in smoking behaviour alongside tax policies and tobacco industry price strategy. There are possible explanations for the apparent increases in smoking prevalence despite significant decreases in cigarette affordability in the recently published paper cited above: smokers who are more sensitive to prices of manufactured cigarettes could have switched to lower-priced/taxed tobacco products (eg, loose tobacco for roll-your-own), or they may have switched to lower-priced cigarette brands introduced by the tobacco companies as a response to tobacco tax policy increasing excise levied.
This paper describes important trends in excise taxes, real prices and the affordability of cigarettes in Europe between 2004 and 2010. Importantly, it highlights the differences in trends between EU and non-EU member states, and within EU member states, the differences in trends between new and old members. Joining the EU has resulted in significant increases in excise taxes and real prices and reductions in affordability for the large majority of countries. However, between 2004 and 2010, changes in taxes, prices and affordability measures have been far more modest in older EU member states. The more aggressive tax policies of new EU member states is likely to have significant public health impacts with lower rates of tobacco use.
The work presented in this paper does have some limitations. First, we are not able to use consistent price data for all countries. Different data sources are used for EU and non-EU member states contributing to within-group and between-group variability in price effects, and we are missing time-series excise tax data for non-EU member states. Second, the lack of price data for the EU 12+ prior to 2004, severely limits the analysis of price trends prior to EU accession. Third, our analysis is limited to cigarettes and does not cover other forms of tobacco. Fourth, the use of the RIP as a measure of affordability, while allowing to study longer time series limits us to using a broad measure of income which does not sufficiently account for inequalities in income.
What this study adds
-
This paper shows that joining the EU has resulted in cigarettes becoming less affordable over time, and the tax burden becoming more similar among the new EU member states.
-
The EU minimum tax requirements, particularly the tax floor, plays the most important role in this process.
References
Footnotes
-
Contributors All authors provided substantial contributions to conception and design, analysis and interpretation of data, drafting the article and revising it critically for important intellectual content, and approved the final version.
-
Funding This work was supported by the European Commission, EC FP7 under the project, Pricing Policies and Control of Tobacco in Europe (PPACTE), grant number HEALTH-F2–2009-223323.
-
Competing interests None.
-
Provenance and peer review Not commissioned; externally peer reviewed.
-
Data sharing All data from the European Commission is publicly available online at no charge. Data from the data sharing statement, Economist Intelligence Unit, is available publicly via a subscription service.