Article Text

Abstract
Objective: To compare levels of particulate matter, as a marker of secondhand smoke (SHS) levels, in pubs before and 2 months after the implementation of Scottish legislation to prohibit smoking in substantially enclosed public places.
Design: Comparison of SHS levels before and after the legislation in a random selection of 41 pubs in 2 Scottish cities.
Methods: Fine particulate matter <2.5 μm in diameter (PM2.5) was measured discreetly for 30 min in each bar on 1 or 2 visits in the 8 weeks preceding the starting date of the Smoking, Health and Social Care (Scotland) Act 2005 and then again 2 months after the ban. Repeat visits were undertaken on the same day of the week and at approximately the same time of the day.
Results: PM2.5 levels before the introduction of the legislation averaged 246 μg/m3 (range 8–902 μg/m3). The average level reduced to 20 μg/m3 (range 6–104 μg/m3) in the period after the ban. Levels of SHS were reduced in all 53 post-ban visits, with the average reduction being 86% (range 12–99%). PM2.5 concentrations in most pubs post-ban were comparable to the outside ambient air PM2.5 level.
Conclusions: This study has produced the largest dataset of pre- and post-ban SHS levels in pubs of all worldwide smoke-free legislations introduced to date. Our results show that compliance with the Smoking, Health and Social Care (Scotland) Act 2005 has been high and this has led to a marked reduction in SHS concentrations in Scottish pubs, thereby reducing both the occupational exposure of workers in the hospitality sector and that of non-smoking patrons.
- EPA, Environmental Protection Agency
- PM2.5, particulate matter <2.5 μm in diameter
- RSP, respirable suspended particulate
- SHS, secondhand smoke
- WHO, World Health Organization
Statistics from Altmetric.com
- EPA, Environmental Protection Agency
- PM2.5, particulate matter <2.5 μm in diameter
- RSP, respirable suspended particulate
- SHS, secondhand smoke
- WHO, World Health Organization
Public health policy in a growing number of countries has moved to control non-smokers’ exposure to secondhand smoke (SHS), with recent legislation introduced in Ireland, Italy, Spain and Norway. The Smoking, Health and Social Care (Scotland) Act 2005 to ban smoking in substantially enclosed public places was implemented on 26 March 2006 with the aim of protecting non-smokers from the health effects of SHS.1
A recent review of occupational exposure to SHS suggested that workers in the hospitality sector have among the highest exposures to SHS of all occupational groups.2 Data on exposure to SHS across a wide range of entertainment establishments indicated that airborne nicotine concentrations were up to 18.5 times higher than in offices or domestic residences.3 Studies have shown that non-smoking bar workers have salivary cotinine levels four times those of non-smokers who live with partners who smoke.4 Data from New Zealand indicate that non-smoking hospitality workers in establishments that permit smoking have salivary cotinine levels between 3 and 4 times those of non-smoking workers in smoke-free premises.5 One estimate indicates that between 1500 and 2000 non-smokers’ deaths per year in Scotland can be attributed to SHS exposure.6 It has been suggested that SHS exposure may lead to the deaths of over 50 hospitality sector workers in the UK each year.7
The introduction of smoke-free legislation in other countries has been shown to dramatically reduce SHS levels. A recent analysis of the effect of the Norwegian legislation8 showed that total dust levels in 13 bars and restaurants reduced from an average level of 262 to 77 μg/m3, a 70% reduction, whereas a study in the USA indicated that respirable dust levels in a selection of 8 hospitality venues reduced to approximately 9% of the pre-ban level.9 Similar work in New York State in a mixture of bars and restaurants measured levels of particulate matter <2.5 μm in diameter (PM2.5), and found that mean levels decreased from 412 to 27 μg/m3 (93.5%).10 Mulcahy et al11 measured changes in airborne nicotine levels as a result of the Irish smoking ban. Their study of 20 pubs showed nicotine reductions of approximately 83%.
Although there are currently no air quality standards for PM2.5 in the UK, both the US Environmental Protection Agency (EPA) and the World Health Organization (WHO) have issued air quality guidance for outdoor air pollution levels measured in PM2.5.12,13 The US EPA air quality guidance is divided into bands, and for PM2.5 these bands are arranged at cut points of <15.4 μg/m3 (good), 15.5–40.4 μg/m3 (moderate), 40.5–65.4 μg/m3 (unhealthy for sensitive groups), 65.5–150.4 μg/m3 (unhealthy), 150.5–250.4 μg/m3 (very unhealthy) and >250.5 μg/m3 (hazardous). The US EPA standard for PM2.5 has a 24 h averaged target of 65 μg/m3, with an annualised average of 15 μg/m3. The WHO recently revised its outdoor air quality guidance and now recommends a 24 h average limit of 25 μg/m3, with an annual average not exceeding 10 μg/m3 measured in PM2.5.13
This paper describes our methods of measurement of SHS concentrations in a selection of Scottish pubs and examines the changes in SHS levels that occurred as a result of the implementation of the ban on 26 March 2006. It forms part of a comprehensive evaluation strategy to measure the effects of the introduction of the Scottish smoke-free legislation.14
RECRUITMENT
All public houses in the Aberdeen city postcodes (AB10–12, 16, 23–25) and Edinburgh city postcodes (EH1–8), together with pubs in small towns (<3000 population) in the Borders and Aberdeenshire council regions, were entered into a database generated from a search of internet local service directories (http://www.yell.com and http://www.thomsonlocal.com). The Aberdeen and Edinburgh city postcodes represented the central areas of these cities. From this database, we randomly selected a total of 50 pubs for sampling in the 2 months before the introduction of the ban on smoking on 26 March 2006 and then again approximately 8 weeks after implementation. We aimed to sample each pub selected during a period representative of typical busy conditions and at a time representative of quieter opening hours. The busy visits were conducted on Thursday, Friday or Saturday evenings between 6pm and 11 pm, with the quiet-time visits carried out from Monday to Thursday before 5 pm.
METHODS
We used PM2.5 as our marker for SHS concentrations. PM2.5 levels in pubs were measured discreetly using methods similar to those described by Edwards et al.15 We used a battery-operated aerosol monitor (TSI SidePak AM510 Personal Aerosol Monitor, TSI Incorporated, Minnesota, USA) fitted with an impactor to sample the concentration of PM2.5. The monitor was placed in a small bag with a short length of Tygon tubing attached to the inlet and left protruding to the outside. The monitor was calibrated to zero each day before use and the airflow rate set at 1.7 l/min using a Drycal DC Lite flowmeter. The monitor was switched on, to log PM2.5 levels at 1 min intervals, at least 5 min before the entry to a pub.
On entry to each establishment, the researcher purchased a beverage before proceeding to a seat or area as central as possible and away from any doors, windows or obvious potential sources of PM2.5 such as open solid-fuel fires or kitchen areas. The researcher aimed to place the bag containing the monitor at the seat or table level to ensure that sampling was as close as possible to the breathing zone and also tried to ensure that they were not within 1 m of anyone smoking. Air sampling was carried out for a minimum of 30 min.
Details of pub layout and other relevant data such as the use of ventilation systems were noted. The number of patrons and the number of those actively smoking at three time points (entry, 15 min post-entry and 30 min post-entry) were also recorded, as were special events (live music, karaoke), the availability of food and the presence of other possible PM2.5 sources such as coal fires and candles.
The post-ban visits were carried out on the same day of the week and as close as possible to the same time of the day (±30 min) as those visits carried out pre-ban. The methods used were identical to those for the pre-ban visits, though we additionally noted the presence of no-smoking signs, as required by the legislation, and also the number of people smoking outside the pub entrances at our time of entry and exit. We also looked for the presence of smoking paraphernalia inside the pubs as indicators of continuing smoking activity in the premises.
DATA ANALYSES
Data from each pub visit were downloaded to a PC using the TSI TrackPro V.3.41 software. A calibration factor of 0.295 was applied to all raw measurements to correct for the properties of SHS particles.16 A time-weighted PM2.5 average concentration was calculated for each visit.
Descriptive statistics including the geometric and arithmetic means, standard deviation, minimum, maximum and median were generated for the PM2.5 levels across the whole dataset and then subdivided by city and quiet or busy sampling time. Differences between pre- and post-ban concentrations were analysed by analysis of variance on the common logarithmic scale, thereby comparing geometric means and their ratios. Statistical analyses were carried out using SPSS V.14.0 and Genstat (Release 8) software.
RESULTS
A total of 53 visits were made to 41 pubs in the 8-week period prior to the ban: 37 visits in Edinburgh and 16 in Aberdeen. In all, 18 of the visits were at quiet times and 35 at busy times. A subsample of Edinburgh pubs (n = 12) was sampled at both quiet and busy times. A small number of pubs selected for sampling were not monitored (n = 9) either for logistical reasons or because the researcher decided that, in accordance with the project risk assessment procedures, entry to that particular pub posed an unacceptable risk to their personal safety.
Post-ban re-visits were made to all 41 pubs at comparable times, giving 53 return visits. Table 1 provides further details on the location of the monitoring visits undertaken, the timing of visits and the levels of PM2.5 measured. The data were roughly lognormally distributed, with approximately constant variation on the log scale. We therefore prefer to summarise these as geometric means. Since the group sizes are small, we have estimated standard deviations within groups by pooling the within-group variation, giving 49 degrees of freedom. Table 1 also provides data on the average number of patrons per pub and the average number of people observed smoking.
Descriptive statistics of pre- and post-ban visits to pubs (n = 53; 41 pubs)
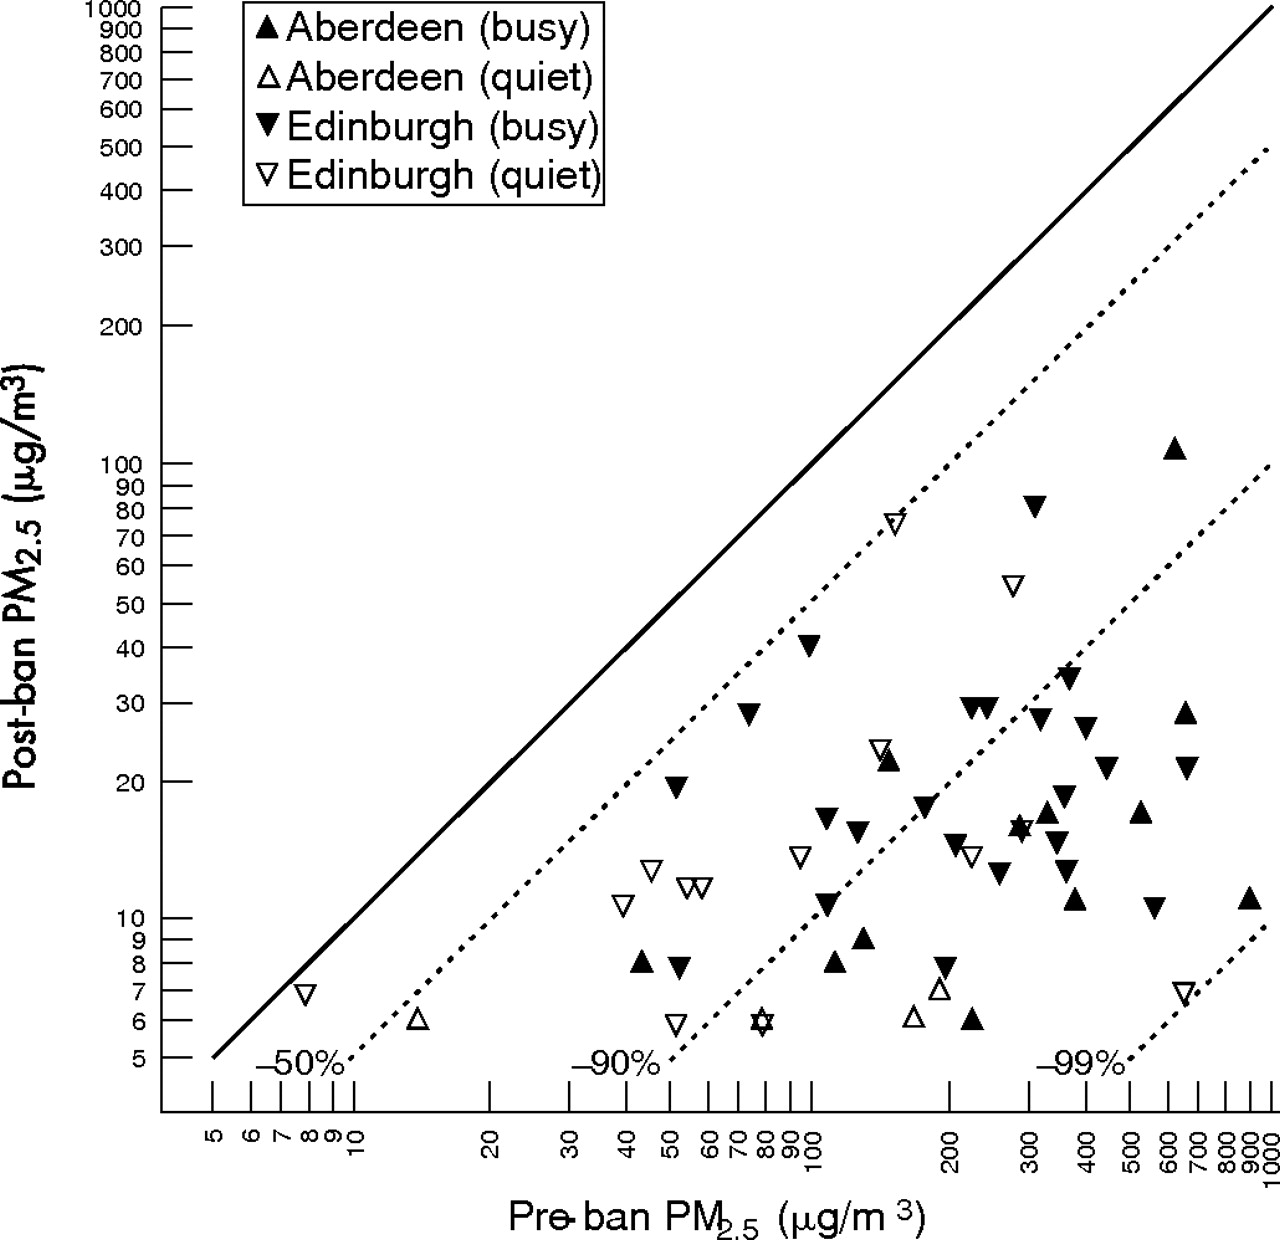
Figure 1 compares PM2.5 levels after the ban with those measured on the first visit. This scatter plot uses different symbols to distinguish the cities, with filled symbols indicating busy times and unfilled symbols indicating quiet times. The plot uses the same logarithmic scale for both axes, so the solid diagonal line represents no change. The dotted diagonal lines mark different levels of proportional reduction in PM2.5 concentration between pre-ban and post-ban visits.

Log-log scatter plot comparing particulate matter <2.5 μm in diameter PM2.5) concentrations at pre- and post-ban visits. Diagonal dotted lines indicate various ratios of reduction.
The PM2.5 levels recorded during the 53 pre-ban visits ranged from 8 to 902 μg/m3. PM2.5 levels pre-ban exceeded the US EPA unhealthy guidance limit of 65 μg/m3 in 81% (n = 43) of the visits, with 58% of visits (n = 31) recording levels above the US EPA “very unhealthy” index level of 150 μg/m3. Almost 40% (n = 21) of pub visits produced PM2.5 concentrations above the US EPA “hazardous” air pollution level of 250 μg/m3.
The PM2.5 concentrations measured during the 53 post-ban visits ranged from 6 to 104 μg/m3. A total of 94% (n = 50) of post-ban visits recorded PM2.5 concentrations less than the 65 μg/m3 US EPA “unhealthy” level, with the other three visits providing concentrations less than the 150 μg/m3 level.
One bar in Edinburgh had a very low pre-ban concentration, and post-ban concentration was slightly lower. All the other bars showed at least a 50% reduction, with more than half reducing by >90%. However, at all levels of pre-ban concentration, the percentage reduction showed considerable variation between 50% and 99%, rather than a single common figure.
An analysis of variance on the logarithms of the pre-ban concentrations at all 53 visits, fitting terms for city and activity (busy vs quiet), showed no significant difference between the city averages, and busy-time concentrations on average 2.5 times those at quiet times were highly significant at p<0.001. As this comparison was made largely between different bars, we also restrict the comparison to the 12 bars visited twice; the result was still highly significant, with a geometric mean ratio of concentrations of 2.6.
A similar analysis on concentrations after the ban showed reduced variation between bars. The mean ratio of busy-time to quiet-time concentrations was 1.6, or 1.7 when restricted to bars visited twice. Edinburgh bars had an average post-ban level 53% higher than Aberdeen, though much of this difference was probably due to higher average outdoor PM2.5 levels in Edinburgh (12 μg/m3) compared with Aberdeen (7 μg/m3).
Analysis of the logs of the ratios of post-ban to pre-ban concentrations (ie, analysing paired differences on the log scale) showed no statistically significant differences in the average degree of change between cities or between busy and quiet times. Overall, the geometric mean ratio was 0.09, which is interpretable as an average 91% reduction in concentration.
Studies in other countries have usually summarised change in airborne dust levels after the introduction of smoking bans as the average of percentage reductions (sometimes on measures other than PM2.5). Although we prefer the geometric mean approach, for the purposes of comparison with other international studies, we have also calculated the mean of the percentage reductions here, at 86%. Table 2 shows that this value is comparable with what has been achieved elsewhere.
Secondhand smoke reductions observed as a result of smoke-free legislation in other countries
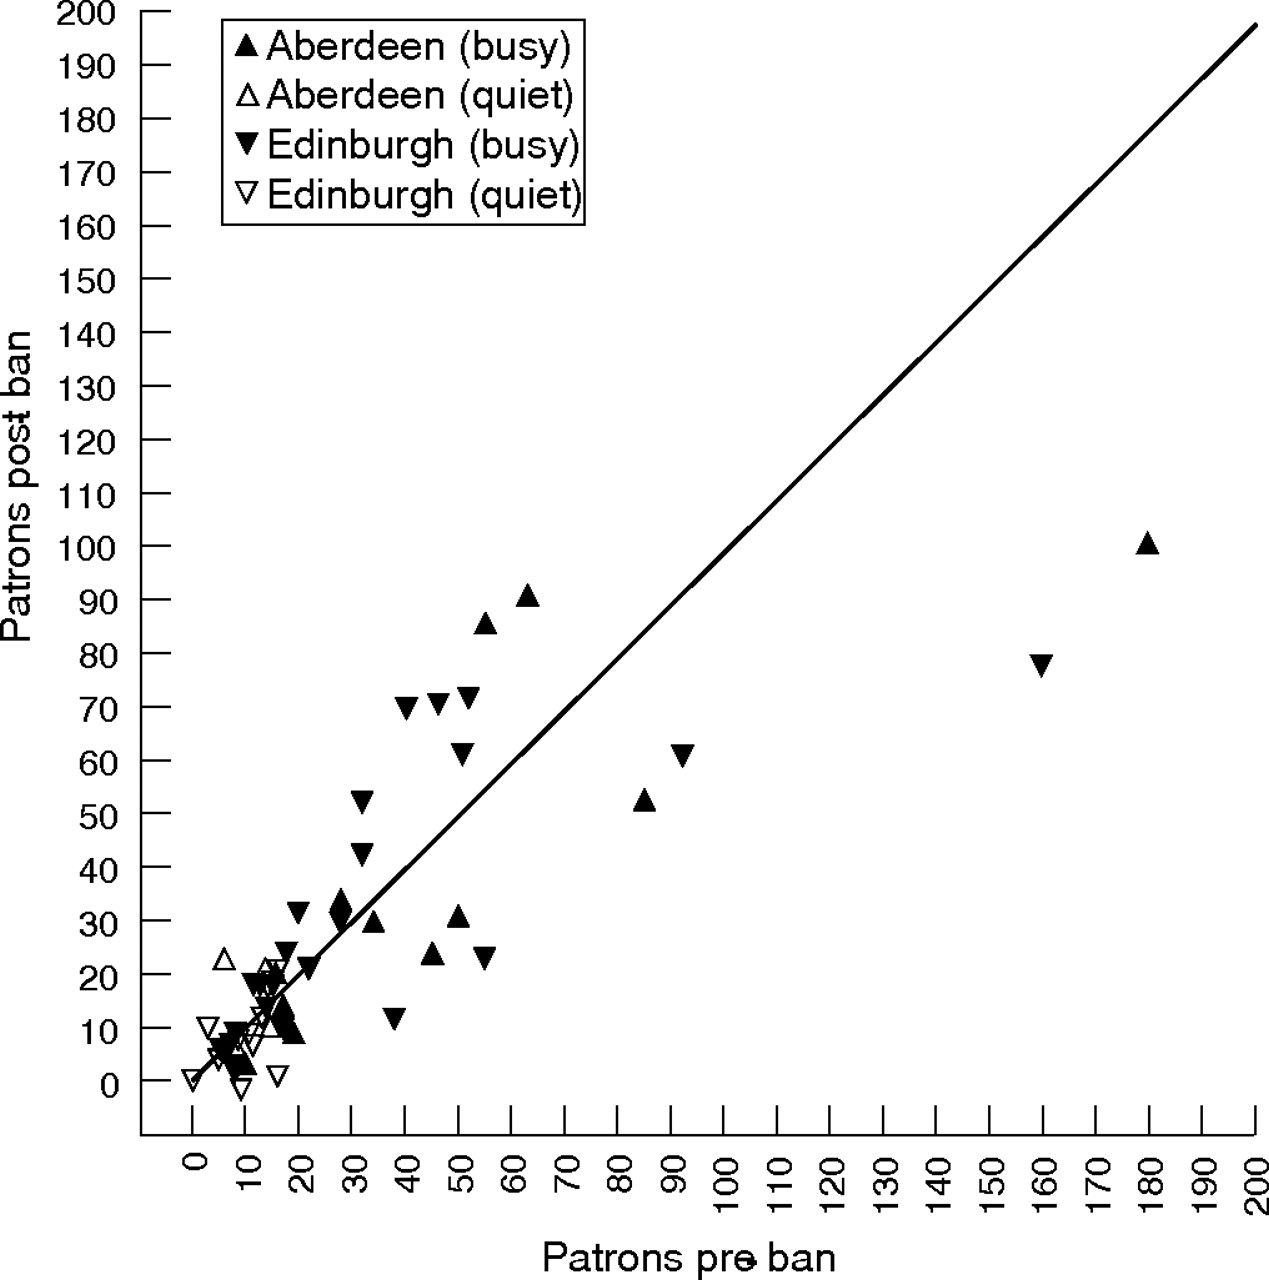
Figure 2 compares the numbers of customers present at comparable times in each of the bars, with the same symbols as fig 1. The quiet-time samples show a cluster of low numbers, as would be expected. Two bars showed quite large reductions in numbers after the ban, but the pre-ban count in both the bars was boosted by drinks promotions. Omitting these two, there was no evidence of a systematic shift up or down in the number of customers.

Scatter plot comparing numbers of patrons at pre- and post-ban visits.
The average number of smokers observed pre-ban was 3, or approximately 10% of pub customers at any one time. As one-third of smokers can be expected to be smoking at any given observational time point, Repace9 suggests correcting the point prevalence by a factor of 3 to provide the prevalence of smokers within a given pub population. For our dataset this would give a 30% smoker prevalence, broadly in line with the Scottish population prevalence of 29%.19
In all, 40 of the 41 pubs visited displayed appropriate no-smoking signs at the post-ban visits. In only 1 of the 53 post-ban visits was there evidence of smoking occurring within the premises, and in none of the pubs was there any evidence that smoking was being permitted or assisted by the presence of ashtrays or cigarette ends/spent matches.
DISCUSSION
These findings show a marked reduction in indoor particle levels (as PM2.5) after the ban on smoking in a sample of pubs in Scotland. Although this work forms part of a wider project looking at the effect of changes in SHS exposure on the health of bar workers, analysis of the health data will be undertaken after a 1 year follow-up to allow for seasonal factors.14 The SHS concentrations described here will help to inform our personal exposure estimates for our study participants to determine whether there is an exposure–response relationship for certain health parameters.
There was considerable debate in the media before 26 March 2006, suggesting that the ban on smoking in substantially enclosed public places would be difficult or impossible to enforce, particularly in pubs and bars.20 Our results indicate that there has been a high level of compliance with the ban, resulting in significantly reduced SHS levels in the cohort of pubs we have sampled.
Previous evaluation studies have used a range of methods to measure markers representative of SHS levels. Markers used include total inhalable dust,8 respirable dust,9 nicotine11 and PM2.5.10 All these measurement methods have individual advantages and disadvantages in terms of ease of use, cost, specificity and ability to provide real-time data as opposed to time-weighted average levels. Increasingly, PM2.5 is considered a relatively specific marker of SHS concentrations and has the added advantage of being amenable to measurement using portable direct-reading instrumentation to give real-time data without the need for costly chemical analyses.
Our study used a real-time aerosol monitor to measure PM2.5 levels in pubs. Our exposure metric is comparable to respirable suspended particulate (RSP) reported in several other studies. The pre-ban levels we measured (mean PM2.5 246 μg/m3) are broadly comparable with those reported by studies in pubs in north west England15 (mean PM2.5 286 μg/m3), New York10 (mean PM2.5 412 μg/m3), Norway8 (mean total inhalable dust 262 μg/m3), Australia21 (mean PM10 255 μg/m3) and in restaurants in France (mean RSP 188 μg/m3) and the UK (mean RSP 195 μg/m3).22
The US EPA and WHO air quality guidance levels for PM2.5 are designed to protect the general population from respiratory and cardiovascular ill-health effects associated with exposure to fine particulate matter above these levels. It should be noted that the chemical composition of outdoor pollutants will be different from that of the indoor air measured in this study, and that air quality guidance typically refers to 24 h or annual average levels and not the 30 min concentrations that we have measured. Outdoor levels are influenced strongly by emissions from traffic and industrial processes, whereas indoor sources of particulate matter are more likely to be from cigarette smoke and other combustion sources such as cooking and open fires. The UK Committee on the Medical Effects of Air Pollutants suggests that it is not currently feasible to define a satisfactory guideline for indoor concentrations of particles owing to the lack of data linking indoor air pollution and health effects.23 In the absence of guidelines for indoor air quality particulate matter, comparisons with the health-based US EPA and WHO outdoor guidelines have been used to provide perspectives on the indoor air quality measured in environments where smoking takes place.9,15
Our study measured levels exceeding the US EPA unhealthy level of 65 μg/m3 in over 80% of pre-ban visits. This reduced to only 6% (n = 3) of post-ban visits. Smoking was observed on only one post-ban visit. This occurred in an area of the pub reserved for a private function and generated the highest PM2.5 concentration (104 μg/m3) of all 53 post-ban visits. There was some indication in the other two examples where the post-ban concentration exceeded the US EPA 65 μg/m3 unhealthy level that the source of PM2.5 may have been from patrons smoking at the entrance to the pub, with the smoke from their cigarettes drifting into the main area.
Other studies looking at changes in airborne concentrations of SHS markers in the hospitality sector after the introduction of smoke-free ordinance have shown reductions in the order of 80–95%.9–11,17,18 Table 2 provides an overview of the results of several pre/post smoke-free legislation evaluations carried out around the world. Our work has shown an average reduction in PM2.5 levels of 86% and so demonstrates that the Scottish legislation has achieved reductions in SHS within pubs comparable to those observed in other countries and cities that have implemented similar smoke-free ordinances.
It is interesting to contrast the results presented in table 2 with those reported from an evaluation of the Finnish partial smoking restrictions requiring improved ventilation and restriction of the serving area available for smoking customers.24 A study of 20 Finnish bars and restaurants measured geometric mean airborne nicotine levels of 7.1 μg/m3 before the introduction of legislation and 7.3 μg/m3 after the measures were put into place. The authors state that the legislative measures introduced in Finland have had little effect in reducing SHS levels in pubs and restaurants.
Our study was restricted by the short time period between inception and the implementation of the legislation and so it was not possible to measure the levels in all pubs at both quiet and busy time periods. However, we believe that the selection of pubs was representative and the fall in levels so large that these data can be extrapolated to all premises adhering to the ban.
It is difficult to determine how representative our sample is of the whole Scottish pub cohort. The pubs visited were selected at random from a database of all central Edinburgh and Aberdeen pubs, together with pubs from small communities in Aberdeenshire and the Borders areas. We did exclude a small number of pubs for logistical reasons and to ensure the safety of the researchers. Most of these excluded pubs were from more out-lying areas or in postcodes with high deprivation category scores. Edwards et al15 have examined SHS levels in affluent compared with deprived pubs in north-west England and found that pubs in deprived areas had mean PM2.5 levels that were almost double those in affluent areas (384 vs 187 μg/m3). Although our selection bias may have led us to measure slightly lower mean SHS levels in the pre-ban visits, it seems likely that our post-ban measurements are reasonably representative. Figures from the enforcing authorities suggest that compliance with the legislation is high throughout the community, with over 99.4% of premises found to be free of smoking activity during more than 3900 inspections across Scotland between March and May 2006.25 Hence, we think that the 86% reduction in PM2.5 levels found in our cohort may be a conservative estimate of the reductions achieved across the whole population of Scottish licensed premises.
Our pre-ban visits were conducted in February and March and our post-ban visits were completed in May and June. It is possible that there was some seasonal influence on the reductions of PM2.5 we observed. Windows and doors were more likely to be open during the post-ban visits and so the number of air changes per hour in pubs was likely to have been higher and this would tend to reduce PM2.5 or SHS concentrations.
We noted substantial numbers of customers smoking outside the entrance to pubs during the post-ban visits. It will be interesting to note whether this practice continues when the weather conditions become less favourable in the winter months. This potential seasonal effect will be considered when we complete the 1-year follow-up.
The average PM2.5 concentration outdoors on the days we performed the visits was 7 μg/m3 (range 3–9 μg/m3) in Aberdeen and 12 μg/m3 (range 5–23 μg/m3) in Edinburgh. There was little difference in outdoor air pollution levels between the pre and post-ban visits so the contribution to indoor levels from outdoor particles will have been consistent. Previous work suggests that SHS contributes between 90% and 95% of RSP air pollution in pubs when smoking is permitted and hence we are confident that SHS is likely to have been the dominant PM2.5 source within pubs during pre-ban visits.9
Although we report a slight reduction in the average number of customers per bar between the pre- and post-ban visits, we note that this reduction was mainly driven by the results from two pubs where the pre-ban visit coincided with a drinks promotion. We also consider that this apparent reduction may be a result of a methodological problem in that we did not count customers who sat at outdoor tables owing to difficulties in observing these areas in most premises. By the post-ban visits in May and June, the weather conditions were more favourable and there was an increase in patrons sitting outside many pubs.
Our measurements were carried out discreetly to try to ensure that the behaviour of bar workers or customers was not influenced by our presence. We postulated that knowledge of our activity could have induced bar managers or workers to switch extraction systems on (or off) depending on their attitude to the legislation, and that customers could also change their smoking behaviour depending on how they perceived our presence. We are reasonably confident that our measurement activity went undetected and that our entry did not influence smoking or other activities that could have changed the PM2.5 levels in these pubs.
What this paper adds
-
This is the first evaluation of the changes in secondhand smoke (SHS) levels in pubs as a result of the introduction of the Smoking, Health and Social Care (Scotland) Act 2005 restricting smoking in enclosed public spaces.
-
This is the largest data set of pre- and post-ban measurements made in pubs where smoke-free legislation has come into force. The study characterises the SHS concentrations that bar workers and customers were exposed to before the introduction of the smoke-free legislation and describes the improvements in indoor air quality that have been achieved.
-
This work shows that the Scottish measures have led to reductions in fine particulate matter of about 86%, similar to the SHS marker reductions observed in other countries and cities that have implemented similar ordinances.
CONCLUSIONS
This study presents a large dataset of 53 pre- and post-ban visits to over 40 pubs and, as such, is one of the largest direct evaluations of the effect of smoke-free legislation on SHS levels in the hospitality sector. The average reduction of PM2.5 of 86% indicates a substantial improvement in air quality in pubs, with many now having PM2.5 levels similar to those found in the ambient outside air.
Acknowledgments
This study is part of the Bar-workers Health and Environmental Tobacco Smoke Exposure (BHETSE) project funded by NHS Health Scotland. We thank the the project Advisory Committee Group members (Sally Haw, Martie van Tongeren, David Hole, Colin Fischbacher) for their help. We also thank George Henderson and Mike Beveridge for technical assistance with the instrumentation and our colleagues John Cherrie, Graeme Hughson, Sue Gordon and Anne Sleeuwenhoek for their helpful comments on the draft manuscript.
REFERENCES
Footnotes
-
Funding: This work was funded by a grant from NHS Health Scotland.
-
Competing interests: None.