Article Text

Abstract
Objectives: To calculate cigarette affordability for a number of countries using different techniques and data, to investigate trends since 1990 and to assess the appropriateness of different measures of affordability.
Design: Two existing measures were specified. Relative income price (RIP) uses per capita gross domestic product (GDP) as the measure of income, while “minutes of labour” is based on a Union Bank of Switzerland (UBS) survey of earnings.
Subjects: RIP (1990–2006) is calculated for 32 high-income and 45 low-income and middle-income countries. The “minutes of labour” measure is calculated for 29 high-income and 23 low-income and middle-income countries.
Results: In high-income countries cigarettes are significantly more affordable than in low-income and middle-income countries, but have become less affordable since 1990. Among low-income and middle-income countries, cigarettes have become more affordable since 1990 and at an increasingly rapid rate since 2000. In 33 of 34 countries where cigarette affordability decreased since 1990, the real price increased. In 20 of 37 countries where cigarettes became more affordable, real price decreased.
When measuring affordability in low-income and middle-income countries, a broad income measure, such as per capita GDP, is most appropriate. For high-income countries, the choice of income measure is not important.
Conclusions: In international comparisons, cigarette prices should not only be viewed in monetary terms but also in terms of their affordability. Fast-growing countries face greater tobacco control challenges since rising incomes increase the affordability of cigarettes. The fact that cigarettes have become increasingly affordable in a majority of low-income and middle-income countries is a major tobacco control failure.
Statistics from Altmetric.com
Economists have consistently promoted excise tax increases as an appropriate and effective tobacco control strategy.1 2 Higher taxes increase the retail price and decrease the demand for cigarettes. Numerous studies over the past decades have shown that the demand for cigarettes is heavily influenced by changes in the price of cigarettes.3 4 By raising the excise tax, policy makers are able to increase the retail price of cigarettes, making the product less affordable.
In recent decades some countries, mainly in Asia, have achieved unprecedented economic growth rates. In China, India, Indonesia, Vietnam and Bangladesh real per capita gross domestic product (GDP) has grown at annual rates of 6% or more. Rapid economic growth increases people’s purchasing power. Cigarette demand generally increases with income, especially in low-income and middle-income countries.4 As their income increases, people find that many things, including cigarettes, become more affordable.
Affordability considers the simultaneous effect of income and price on a person’s buying decision. One can investigate the level of affordability at a point in time, or changes in affordability over time. Both are analysed in this paper. A number of definitions have been developed recently, but essentially affordability refers to the quantity of resources (in terms of time or money) required to buy a pack of cigarettes.
We have two aims with this paper. First, we wish to present the latest statistics and trends in cigarette affordability for as many countries as possible. Second, we wish to address certain methodological issues, especially regarding the measurement of income, when calculating affordability measures.
METHODS
Existing information on cigarette affordability
A limited number of published studies have explicitly investigated cigarette affordability. Scollo5 and Lal and Scollo6 compared the price of cigarettes to that of a McDonald’s “Big Mac” hamburger. Between 1995 and 2002, cigarettes became relatively more expensive than Big Mac hamburgers in 15 of the 16 (high-income) countries included in the 2 surveys. Since these studies used the price of the Big Mac hamburger rather than income as the reference point, they did not investigate affordability per se but rather the price of cigarettes relative to an internationally standardised product.
Guindon et al7 used earnings of 12 occupations, monitored via a survey of earnings by the Union Bank of Switzerland (UBS), to calculate the average number of working minutes required to purchase a pack of local brand or Marlboro (or equivalent) cigarettes. Between 1990 and 2000 cigarettes became more affordable in 6 of the 25 (24%) developed countries and in 4 of the 11 (36%) low-income and middle-income countries in the sample. For a majority of countries cigarettes became less affordable.
Additionally, using the UBS earnings data, but considering 7 (of 14) occupations with the lowest earnings, Kan8 investigated cigarette affordability in 60 cities in 2006 and found that cigarettes remained highly affordable in most cities surveyed. Kan warned that cigarettes would become increasingly affordable in fast-growing emerging economies if cigarette prices do not keep pace with economic growth.
Blecher and Van Walbeek9 considered a sample of 28 high-income and 42 low-income and middle-income countries, and defined affordability in terms of per capita GDP. Despite being more expensive, cigarettes were generally more affordable in high-income countries. During the 1990s cigarettes became more affordable in 39% of the high-income countries considered and less affordable in the remaining 61%. Among low-income and middle-income countries cigarettes became more affordable in 57% and less affordable in 43% of countries.
Deriving affordability measures
Price data
Price data were drawn from the Economist Intelligence Unit (EIU) World Cost-of-Living Survey (which documents prices of a range of goods and services) for the period 1990–2006.10 Prices are collected in the first week of September each year. The survey included 103 cities in 69 countries in 1990 and 120 cities in 77 countries in 2006. For most countries a single city is monitored. Where multiple cities were surveyed, an average price is calculated for the country. (In 2006 these were Australia (5), Brazil (2), Canada (4), China (5), France (2), Germany (5), India (2), Italy (2), Japan (2), New Zealand (2), Russia (2), Saudi Arabia (3), Spain (2), the United Arab Emirates (2), the UK (2), the US (16) and Vietnam (2). The number of cities is shown in parenthesis. Between 1990 and 2006 the EIU expanded the Survey to include cities in countries that were already represented in 1990. For the five affected countries (China, Russia, the UK, the US and Vietnam), the affordability measures for 2006 (presented in figs 1–3 and table 2) are based on the expanded sample of cities while the measures investigating the changes in affordability over time (presented in fig 4 and tables 1 and 4) use only the cities included in the Survey in 1990. The differences in the trend in affordability in these five countries is so small that it had no material impact on the summary tables.)

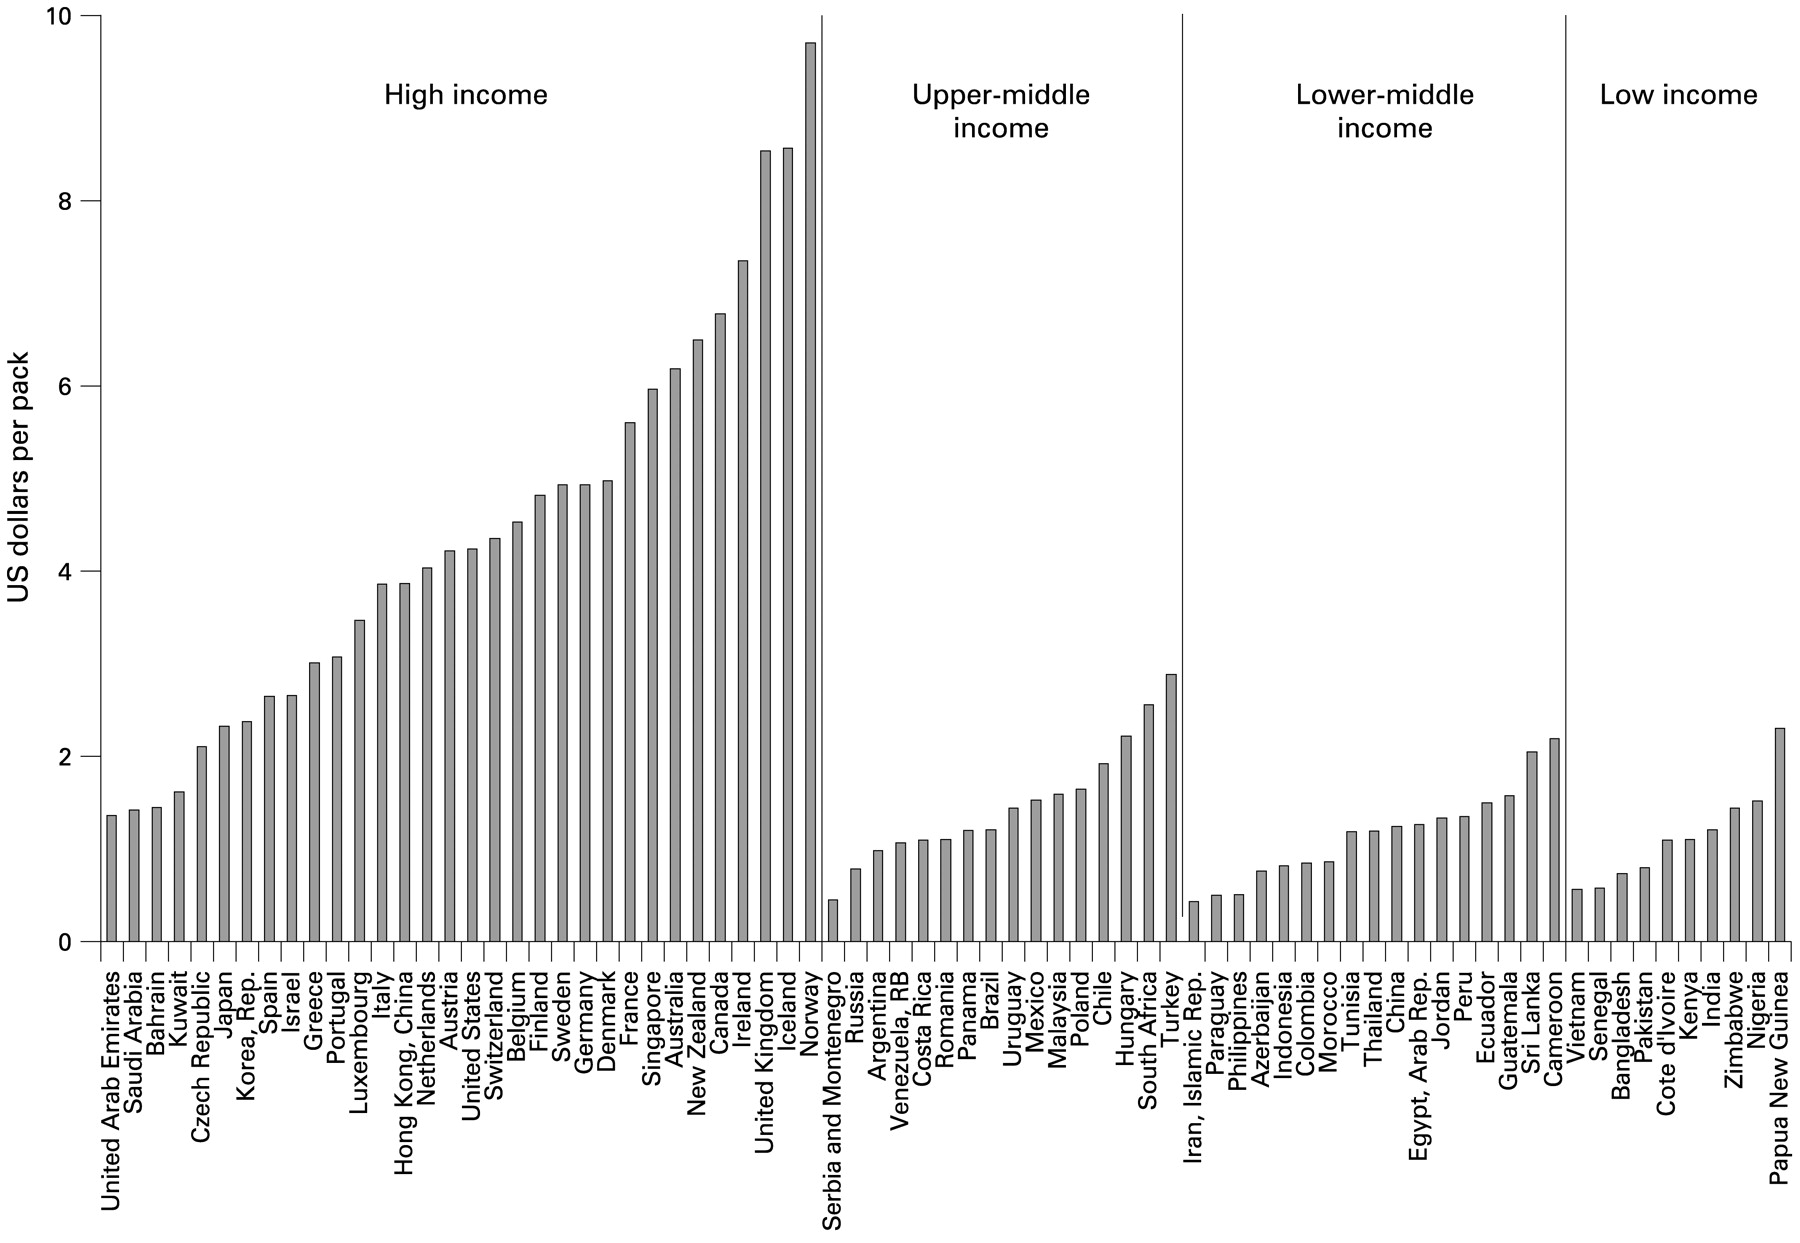
Price per pack of cigarettes expressed in US dollars, 2006. Source: Economist Intelligence Unit (EIU)10.


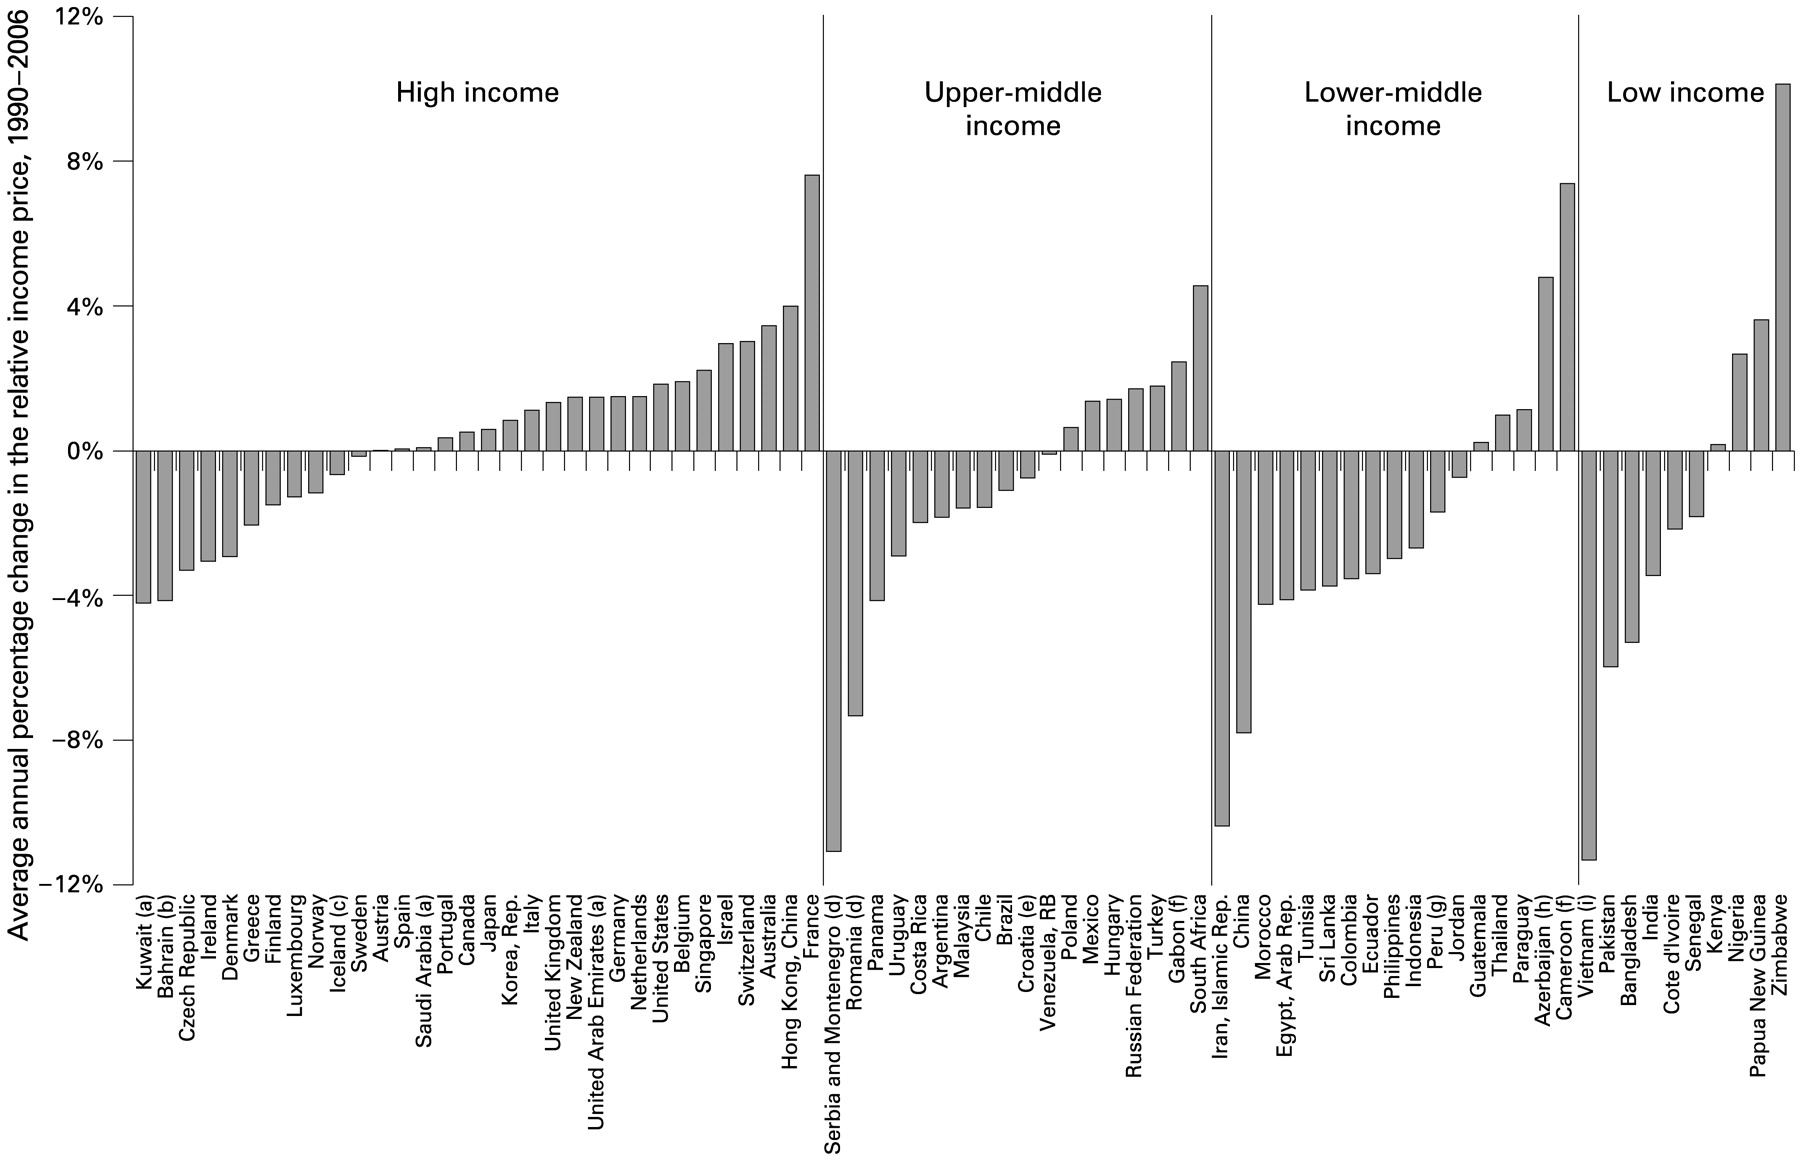
Average annual percentage change in relative income price (RIP), 1990–2006. Growth rates based on different time periods than 1990–2006: (a) 1995–2005, (b) 1990–2005, (c) 1999–2006, (d) 1994–2006, (e) 1998–2002, (f) 1991–2002, (g) 1991–2006, (h) 1998–2006, (i) 1993–2005. Source: Economist Intelligence Unit (EIU)10 and World Bank.11
The Survey considers the prices of Marlboro (or nearest international equivalent) and a popular local brand, sold at high-volume supermarkets and mid-price retail outlets. Since the emphasis is on affordability, the lowest of the four prices was selected for each year, which was usually the local brand, sold at the supermarket. (In 2006 the local brand was cheapest in 52 countries; Marlboro was cheapest in 13 countries, and the local brand and Marlboro were equally priced in 7 countries. Five countries did not have data for 2006.)
The EIU collects price data in local currency. Calculating affordability measures do not require that the price data be converted to a common currency, because income is also collected in local currency. To compare cigarette prices between countries, all prices were converted to US dollar using two exchange rates: (1) market exchange rates on the day of the survey from the EIU and (2) purchasing power parity (PPP) conversion factors from the World Bank’s World Development Indicators online database.11
Income data
While price is conceptually quite easy to comprehend, income is more complex. How does one define income? Should one use a broad definition (eg, per capita GDP) or a narrow definition (eg, after-tax income)? While a broad definition is less sensitive to differences in tax regimes and government’s role in providing goods, services and grants, a narrow definition is typically better understood by the public. Most people can comprehend “a London teacher’s net hourly wage in 2006 was £8.65” better than “per capita GDP in the UK in 2006 was £21 084”.
This paper uses two income measures. Per capita GDP is a broad measure, calculated using a consistent methodology. Although it does not consider income distribution, it is generally regarded as a good indicator of average living standards. It also incorporates free or subsidised public goods and services. GDP data were taken from the World Bank’s World Development Indicators online database.11 Aggregate GDP was converted into per capita GDP using population from the same database.
The UBS Survey of Earnings12 provides net hourly earnings for a number of occupations in important commercial cities, and is conducted every 3 years. The Surveys considered 12 occupations in 1997 and 2000, 13 in 2003 and 14 in 2006. (The occupations were primary school teachers, bus drivers, automobile mechanics, building labourers, skilled industrial workers, cooks, department managers, engineers, bank credit clerks, secretaries, saleswomen and female industrial workers. The additional occupation in 2003 was a product manager and in 2006 a call centre agent.)
Measures of affordability
Relative income price (RIP; see Appendix), developed by Blecher and Van Walbeek,9 is defined as the percentage of per capita GDP needed to purchase 100 packs of cigarettes. The higher the RIP, the less affordable cigarettes are and vice versa. The RIP was calculated for each country for each year in the period 1990–2006. Where hyperinflation or currency changes yielded unrealistic affordability measures, these were adjusted or removed.
The “minutes of labour” affordability measure (see Appendix), first proposed by the World Health Organization (WHO),13 and subsequently used by Guindon et al,7 is defined as the minutes of labour required to purchase the cheapest pack of cigarettes, based on net earnings (Although Guindon et al calculate the measure using the international and local brand of cigarette, we use the cheapest pack of cigarettes for all measures). We used median income in the calculations since it is not affected by outliers. However, the mean is affected by outliers. For correlations, we use Spearman rank correlations, because, in contrast to simple (Pearson) correlations, they do not assume a linear relationship between variables and are not affected by outliers. Although we have taken all reasonable measures to ensure data correctness, a variety of factors (eg, changes in currencies, hyperinflation, temporary spikes in cigarette prices, errors in collection and volatile exchange rates) could result in incorrect and possibly outlier values. This predicates our decision to use descriptive statistics that are unaffected by outliers.
Kan8 defined affordability in terms of the net wage of the seven least-paid occupations surveyed by UBS. This approach has merit since it focuses the attention on poorer employed people, but space constraints prevented us from presenting results. However, these can be accessed in a working paper.14
The sample consists of 77 countries for RIP affordability and of 52 countries for “minutes of labour” affordability. Countries were divided into four income categories using the World Bank’s most recent classification (July 2007)15 (the first number refers to RIP, the second to “minutes of labour”): high-income (32, 29), upper-middle-income (18, 13), lower-middle-income (17, 6) and low-income countries (10, 4). (Note: Taiwan is not recognised and thus not classified by the World Bank. It is not included in the RIP since no GDP data is recorded by the World Bank but it is included in the “minutes of labour” measures since price and wage data are available. In this paper, we classify Taiwan as a high-income country.)
RESULTS
Global cigarette affordability
Cigarette affordability, 2006
According to conventional wisdom cigarette prices are much higher in high-income countries than in low-income and middle-income countries.1 2 An understanding of cigarette price differences is useful in some situations, but prices by themselves are not necessarily a good indicator of affordability. Nevertheless, we consider cigarette prices in some detail, since it is the standard against which affordability measures are compared.
In fig 1 countries are ranked according to their income status (high, upper-middle, lower-middle and low) and then according to US dollar price per pack of cigarettes in 2006, using current exchange rates. Cigarettes are, on average, between three and four times more expensive in high-income countries than in poorer countries. However, average US dollar prices in upper middle-income, lower middle-income and low-income countries are similar.
Figure 1 indicates large variability in US dollar prices among countries with a similar level of development. For high-income countries the coefficient of variation is 0.50 (mean $4.42, SD $2.19) while among low-income and middle-income countries this coefficient is 0.46 (mean $1.27, SD $0.58). Countries with high costs of living (eg, Norway and Iceland) and those that have taken strong tobacco control action (eg, Australia, Canada, Ireland, New Zealand and the UK) have the most expensive cigarettes. Among high-income countries, Middle Eastern countries tend to have the cheapest cigarettes
PPP conversion rates quantify price differences (based on a large basket of goods and services) between countries. PPP-adjusted cigarette prices account for the fact that average price levels differ between countries, and as such it is an alternative price measures. Summary statistics for all price and affordability measures are presented in table 2. The average PPP-adjusted price among high-income countries is about 60% higher than among middle-income and low-income countries. Average US dollar prices, calculated using PPP conversion rates, in upper middle-income, lower middle-income and low-income countries are similar. Differences in average cigarette prices between high-income and other countries are compressed when one uses PPP-adjusted prices vis-à-vis prices calculated with current exchange rates.
Do excise tax rate differences adequately explain the differences in retail prices? Based on data published in a recent WHO report,16 we calculated a Spearman correlation coefficient of 0.40 (n = 120, p<0.001) between US dollar-denominated retail prices (calculated using the current exchange rate) and the national excise tax burden (ie, excise tax as percentage of the retail price, but excluding provincial/state, local and general sales taxes). (The US and Canada levy cigarette excise taxes primarily at the state/provincial level. Since national excise tax burdens severely understate the true tax burden, these two countries are excluded from the calculation.) While the correlation is significantly positive, much of the variation in retail prices is explained by other factors.
Figure 1 is useful in some situations. For example, to know that cigarettes are very expensive in Norway is useful information for a smoker travelling to that country. Similarly, multinational cigarette companies want to know before-tax prices, expressed in a common currency. (The prices shown in fig 1 are the tax-inclusive prices). However, one cannot infer anything about the affordability of cigarettes from fig 1, because it does not incorporate income.
RIP, the percentage of per capita GDP required to buy 100 packs of cigarettes, is shown in fig 2. The lower this percentage, the more affordable the cigarettes are. The countries are again sorted, first by income status and then by RIP. Cigarettes are significantly more affordable in high-income countries, compared to middle-income and especially low-income countries, even though they are typically more expensive in high-income countries.
Figure 3 indicates how many minutes the median employed person needs to work to buy a pack of cigarettes in 2006. The greater the number of min required, the less affordable the product is. The countries are sorted, first according to income status and then according to minutes of labour required. The small number of observations for middle-income countries, and especially low-income countries, prevent us from making strong conclusions. Nevertheless, fig 3 suggests that the level of cigarette affordability, using the “minutes of labour” method, does not vary significantly between high-income and middle-income countries. While there is a suggestion that cigarettes are somewhat less affordable in low-income countries, the small number of such countries in the sample prevents us from saying anything more definitive. There is much variation in cigarette affordability within groups of countries with a similar level of income, but limited variation between different groups.
Spearman rank correlations between the two affordability measures are shown in table 1. For all countries the correlations are positive and significantly different from zero, but comparatively modest in magnitude. The implication is that the choice of income measure in calculating affordability is important.
Columns 3 and 4 in table 1 show Spearman correlations for high-income and low-income and middle-income countries separately. The correlations are much higher for high-income countries than for low-income and middle-income countries, suggesting that the affordability measures in low-income and middle-income-countries are more sensitive to the choice of income measure than in high-income countries.
Table 2 provides a statistical overview of cigarette affordability and prices in 2006, by country group. Two features stand out. First, price, by itself, is a misleading indicator of affordability, since it is uncorrelated or even negatively correlated with the two affordability measures. (Spearman correlation between the US dollar price and RIP in 2006 is −0.50 (n = 66, p<0.01) and between the US dollar price and Guindon affordability measure is 0.09 (n = 47, p>0.10).) This does not mean that price is unimportant. Equally important is the income level in determining affordability.
Second, the RIP strongly supports the hypothesis that cigarettes are significantly less affordable in middle-income and especially low-income countries than in high-income countries. The median RIP increases more than 10-fold as one moves from high-income to low-income countries. However, the Guindon “minutes of labour” approach does not suggest that cigarette affordability varies significantly between groups of countries.
Trends in cigarette affordability, 1990 to 2006
We first consider growth rates in cigarette prices and the two affordability measures for the period 1997 to 2006. We are limited to this period because the “minutes of labour” measure is available only for the years 1997, 2000, 2003 and 2006. Subsequently, we consider changes in RIP for a longer period (1990–2006).
Median values of the average annual growth rate in real cigarette prices and two affordability measures are shown in table 3 for two groups of countries. (The following procedure was used: for each country and subperiod a geometric growth rate was calculated. The figure presented in the table is the median growth rate for that group of countries and subperiod.) Considered as a whole, cigarettes in high-income countries have become less affordable at an annual rate of about 2% between 1997 and 2006. However, this is not true of all high-income countries, since in about a third of high-income countries cigarettes have become more affordable since 1997.
Whereas cigarettes in low-income and middle-income countries became somewhat less affordable between 1997 and 2000, they have generally become more affordable since 2000. Both affordability measures indicate that between 1997 and 2006 cigarettes have become more affordable in about 60% of low-income and middle-income countries. Between 2003 and 2006 cigarette affordability (based on RIP, n = 43) increased at a median rate of 7% per year in low-income and middle-income countries. Cigarettes became less affordable in only 14% of these countries during this period. Although qualitatively similar, the decrease in the “minutes of labour” affordability measure in the 2003–2006 period is less dramatic than the decrease in RIP, primarily because of different sample sizes (19 vs 43 countries), and because the of methodological differences (see Discussion).
Table 4 considers trends in cigarette affordability over a longer period (1990–2006) using the RIP as the measure of affordability. (The numbers presented here differ somewhat from those presented in the working paper, primarily because the growth rates here are based on the standard growth formula [100 (Yt/Yt−1−1)], whereas the working paper’s growth rates are based on a regression growth rate.) Among high-income countries RIP decreased slightly in the 1990s, but increased in the early 2000s, and thus remained largely unchanged over the period as a whole. In middle-income countries cigarettes became somewhat less affordable between 1990 and 2000 (although only marginally so between 1995 and 2000), but they have become more affordable since 2000, and at an accelerating rate since 2003. Among low-income countries cigarettes have become more affordable throughout the 1990–2006 period, other than between 2000 and 2003.
Figure 4 presents the growth rates in cigarette affordability in individual countries. The countries are sorted by income status and then by growth in affordability. Positive RIP growth means that cigarettes have become less affordable. Cigarettes became more affordable in 40 (52%) and less affordable in 37 (48%) of the 77 countries in the sample. Among high-income countries cigarette became less affordable in 64% (21/32) and more affordable in 36% (11/32) of cases. Among low-income and middle-income countries, cigarettes became more affordable among 64% of countries (29/45), while they became less affordable in the remaining 36% (16/45).
For 71 of the 77 countries it was possibly to attribute the change in affordability into a real price and a real income change. For 31 of the 34 countries that have experienced decreases in cigarette affordability between 1990 and 2006, larger increases in the real cigarette retail price offset increases in per capita GDP (this includes 4 countries (Cameroon, Gabon, Germany and Saudi Arabia) for which data was available for a subperiod within the 1990–2006 period). In Paraguay and Zimbabwe decreases in per capita GDP reinforced increases in the real retail price. In Kenya cigarette affordability decreased marginally due to a fall in per capita GDP despite a decrease in the real price of cigarettes.
Of the 37 countries that experienced an increase in cigarette affordability, 20 experienced a decrease in the real retail price and an increase in per capita GDP. Of the remaining 17 countries, the increase in real GDP exceeded the increase in the real price. The only exception is Cote d’Ivoire where real price and real GDP fell (real prices fell faster than real GDP).
Of the 19 countries where cigarette affordability has increased at an annual rate of more than 3%, the real price has decreased in 14 countries. Only in China, the Czech Republic, India, Ireland and Kuwait have modest increases in the real cigarette price partially offset the very rapid growth in per capita GDP. This analysis clearly indicates that countries that have experienced rapid increases in cigarette affordability cannot attribute this to rapid economic growth only. In most cases a decrease in the real retail price has exacerbated the impact of the rapid increases in GDP growth.
DISCUSSION
This paper introduced two affordability measures, based on the same price data, but on different income data. The choice of income variable has a large impact on the affordability measure. This requires explanation. The paper has other limitations. Price data represent cigarettes prices in major cities and may not properly reflect average prices throughout the country. Additionally, since the price data focuses on a single, albeit popular, brand, this may not represent average cigarette prices, even in the city surveyed. Both income measures suffer from shortcomings. Although GDP is a broad measure of income, it does not take the distribution of income into account. The UBS earnings data focuses on a narrow group of occupations. Furthermore, because of data constraints the sample is somewhat biased towards high-income countries and under-represents low-income and middle-income countries.
What this paper adds
In recent years a number of papers have explicitly investigated cigarette affordability, more than simply cigarette prices. This paper updates the literature by considering the period up to 2006. It finds that the choice of income variable has a large impact on the affordability measures for low-income and middle-income, but not for high-income countries.
Broad measures of income such as GDP are appropriate in all countries while earnings surveys are not appropriate in low-income and middle-income countries since they only survey relatively high-paying occupations. Although cigarettes in high-income countries are more affordable than in low-income and middle-income countries, they have become somewhat less affordable between 1990 and 2006.
Cigarettes in low-income and middle-income countries have become much more affordable over this period, but in particular after 2003, mainly because the growth in prices has not kept up with the rapid growth in incomes.
The explanation for the differences in the affordability measures rests on the representativeness of the income data. GDP measures total output (and thus income) of a country. While there are criticisms against GDP as a measure of income,17 it is designed to be the most encompassing and broadest measure of economic activity in a country.
The UBS Survey of earnings is not designed to be representative of earnings in the country as a whole. Within a particular country, it focuses only on a small number of cities, usually the commercial centres. Earnings in commercial centres are typically higher than in other cities, and urban earnings are typically higher than rural earnings, especially in low-income and middle-income countries. Even though the UBS aims to survey earnings among a representative cross-section of occupations, most occupations surveyed require training; unskilled occupations are not included in the Survey. The UBS surveys only formal sector employers. Wages in the informal sector are typically much lower than in the formal sector. Additionally, the UBS considers only employed persons. Unemployed persons do not feature in the UBS survey at all. Lastly, the UBS does not take into consideration the average size of the family that depends on the wage of the breadwinner(s).
In terms of these five issues, low-income and middle-income countries differ notably from high-income countries. In low-income and middle-income countries the urban/rural wage differential is larger, the unemployment rate is higher, the labour participation rate (especially among women) is lower,18 the average number of dependents is higher, and the proportion of people working in low-wage menial jobs and the informal sector is higher than in high-income countries.19 All these factors suggest that the UBS survey incorporates only a small portion of the labour market in low-income and middle-income countries.
The high correlation between the affordability measures for high-income countries, as presented in table 1, suggests that the choice of income (at least between per capita GDP and the UBS earnings survey) does not matter much for these countries. This is not the case for low-income and middle-income countries, where the correlation coefficients are much lower.
For low-income and middle-income countries, cigarettes are more affordable if one uses UBS earnings and less affordable if one uses per capita GDP as income proxies. The UBS’s choice of occupations is representative of the occupational distribution in high-income countries, but represents only the top-end of occupations in low-income and middle-income countries. In contrast, per capita GDP accounts for the whole income distribution, including unskilled, poorly remunerated and subsistence workers. Given that the UBS survey covers a small (typically unrepresentative) portion of the labour market in low-income and middle-income countries, we recommend caution in the interpretation of affordability measures based on UBS survey data for low-income and middle-income countries.
Considering changes in cigarette affordability since 1990, there is a wide divergence between high-income countries and low-income and middle-income countries. Cigarettes have generally become somewhat less affordable in most high-income countries since 1990 suggesting that, at least at an aggregated level, these countries are actively trying to discourage smoking through fiscal and possible other means—for example, by imposing an “implicit tax” in the form of the Masters Settlement Agreement in the US. It is also possible that tobacco companies have increased the retail price by increasing the real net-of-tax price, as has happened, among others, in Jamaica,20 South Africa,4 and the US.21
Cigarettes have become more affordable in many low-income and middle-income countries since 1990, and this increase in affordability has accelerated since 2003. In many large, populous Asian countries, particularly China, Pakistan, Bangladesh, Iran and Vietnam, cigarettes have become more affordable at a rate of 5% or more each year.
Tobacco control victories are reported on a daily basis, for example, countries ratifying the Framework Convention on Tobacco Control (FCTC), legislation successfully passed or implemented and research indicating popular support for tobacco control interventions. While this is positive, the paper suggests that the single most important tool (ie, decreasing the affordability of cigarettes by raising the excise tax, has been neglected).
Many countries have experienced unprecedented economic growth in the past decade or two. While this creates great opportunities (eg, reducing poverty and increasing people’s standard of living), it creates tobacco control challenges as well. The Spearman correlation between the average growth rate for the period 1990 to 2006 and the average growth in the RIP over the same period is −0.27 (n = 77, p<0.02), indicating that countries which experience rapid economic growth tend to find that cigarettes become more affordable. However, many countries that have experienced rapid economic growth have also experienced decreases in the real price of cigarettes, exacerbating the increased affordability of cigarettes.
This paper argues that rapidly growing countries face tobacco control challenges that slower-growing countries do not face. To the extent that tobacco control is a priority area for government and policy makers, tobacco prices and taxes should be adjusted against some standard of affordability, not only against a standard of real price or tax.
For example, the comment “tax rates should be increased so that the prices of all tobacco products increase by at least 5% in real terms every year”, which has been ascribed to the WHO and the World Bank,22 focuses on price and not affordability. For most countries, and especially those where the real price of cigarettes has decreased over time, it is a useful target. However, for rapidly growing countries it may be inappropriate, since even though the real price may be increasing at a rate of 5%, cigarettes are still more affordable. Perhaps a more useful and more general comment would be “tax (or price) should be increased such that cigarettes become increasingly less affordable”. This recommendation implies that the nominal price of cigarettes should increase by at least the growth in nominal per capita GDP (ie, the sum of the inflation rate, the real per capita GDP growth rate and a small interaction effect).
Conclusions
This paper’s central message is that, despite methodological and data issues, policy makers should focus more on the affordability of cigarettes and less on the (real) price in isolation of income. A price-based policy prescription may not be sufficient to reduce the affordability of cigarettes in fast-growing countries. An affordability-based policy prescription is more general, and possibly more useful, as a tobacco control target, especially in rapidly growing countries.
Acknowledgments
We would like to thank Kelly Henning and Jan Schmidt-Whitley for their assistance, Emmanuel Guindon, Steven Birch, Susan Cleary, Stephan Rabimov, Emil Sunley and three anonymous referees for their comments and suggestions, Thembi Dladla for research assistance and Angela McClean of the Economist Intelligence Unit for providing some of the data. All other errors and omissions remain ours entirely.
Supplementary materials
Web only appendix for 18;3:167
Files in this Data Supplement:
Footnotes
Funding: We gratefully acknowledge the financial support of the Bloomberg Initiative to Reduce Tobacco Use.
Competing interests: None.