Article Text

Abstract
Background: In Australia, smoking prevalence has declined in men since the 1950s and in women since the 1980s. Future smoking prevalence in Australia is predicted from estimates of previous and current age-specific and sex-specific cessation rates and smoking uptake in young people derived from national survey data on the prevalence of smoking between 1980 and 2007.
Methods: A dynamic forecasting model was used to estimate future smoking prevalence in the Australian population based on a continuation of these current trends in smoking uptake and cessation.
Results: The results suggest that Australia’s smoking prevalence will continue to fall while current rates of initiation and cessation are maintained. But a continuation of current smoking cessation and initiation patterns will see around 14% of adults still smoking in 2020.
Conclusions: Smoking cessation rates will need to double for Australian smoking prevalence to reach a policy target of 10% by 2020.
Statistics from Altmetric.com
Australia, Canada, USA and Sweden are nations that have achieved substantial declines in smoking prevalence over the past 50 years by implementing tobacco control polices. In Australia, smoking prevalence has declined in men since the 1950s and in women since the 1980s.1 In the early to mid 1990s this decline slowed, with smoking prevalence stalling at around 27%, thereby failing to meet the nation’s 2000 public health target of only 20% of adults smoking.2–4
After an increase in mass media campaigning as part of the National Tobacco Campaign in 1997, increases in the real cost of cigarettes and bans on smoking in restaurants, Australian smoking prevalence resumed its downward trend.5–7 Between 1998 and 2004, the average annual decline in smoking prevalence increased to 0.66 percentage points, nearly double the annual decline between 1991 and 1995 (0.34%).8 As a result of these declines continuing, only 17.9% of the Australian population aged 14 and over were daily or weekly smokers in 2007.9
The Australian government is currently considering possible public health goals for the year 2020 in a number of key areas as part of a national preventive health strategy.10 11 Because tobacco smoking is still Australia’s leading preventable cause of disease burden,12 setting a target for smoking prevalence will be an important component of this strategy. It is not clear what would comprise a reasonable policy target for population smoking prevalence. One suggestion is that we should aim in the long term to achieve a population smoking prevalence that is the same as that among the segment of the population that is the best-educated and most informed about the risks of smoking, such as medical practitioners.13 In the absence of recent data on smoking prevalence among Australian medical practitioners, we have used the figure of 10%, the level suggested as a policy goal for the USA in a recent US Institute of Medicine report on the future of tobacco control.14
We used modelling to answer the following questions: (1) how much lower is the Australian smoking prevalence likely to go with a continuation of current rates of smoking cessation and initiation? (2) If the best estimate for this prevalence is greater than 10%, then what smoking cessation and initiation rates will we need to achieve to reduce smoking prevalence to less than 10% of adults by 2020?
METHODS
Base model
We developed two models to answer these questions. A base model was fitted to observed data on smoking prevalence in Australia over recent decades. A forecasting model was derived that used the results of the base model to make predictions about future smoking prevalence under various assumptions about future rates of smoking initiation and cessation. In both models, smoking prevalence was determined by initiation rates at young ages, and by a combination of cessation rates and excess mortality at older ages. (Note: we use “initiation rate” for what is formally a proportion and “cessation rate” for what is formally a proportional change in smoking prevalence. The proportional change can be either positive or negative, with the former indicating a decline in prevalence and the latter an increase.)
The base model largely follows the model as published by Mendez et al.15 It was constructed in Microsoft Excel (Microsoft, Redmond, Washington, USA) using: (1) demographic data from the Australian Bureau of Statistics on the population size in 1-year age bands for men and women in the baseline year (1980);16 (2) year-specific probabilities of dying at each age for men and women;17 (3) national survey data on the prevalence of current, former and never smokers in the Australian population from the Cancer Council Victoria18–23 and the National Drug Strategy Household Surveys;24–27 and (4) age-specific and sex-specific relative risks of dying in current and former smokers compared to never smokers from the American Cancer Society’s Cancer Prevention Study II (CPSII) (M Thun, personal communication).
The baseline year in the base model was 1980 and continued to 2007. The base model was constructed to estimate the age-specific, sex-specific and year-specific smoking cessation rates that could be used in the forecasting model to predict future smoking prevalence in the Australian population. Changes in the population due to immigration were not included in the model because of lack of good data on the prevalence of smoking in migrants. Some migrant groups have high rates of male smoking while rates among females in many migrant groups including those from Africa and Asia are much lower than the Australian average. Rates of smoking among well educated migrants recruited for special skills may also be lower than the Australian average.28 The net effects of these differences are difficult to predict but the overall smoking prevalence in migrants would have to be very different to affect our estimates of the smoking prevalence in the Australian population (since fewer than 300 000 people migrate to Australia in any year).29
Observed current and former smoking prevalence
We obtained national survey data on the prevalence of current smoking (smoking at least once a week)30 and former smoking in men and women in 3-yearly intervals from 1980 to 2007 in the age groups 16–19, 20–24, …55–59, 60–69 and 70+ (see tables 1 and 2). The small number of “irregular” smokers (smoking less than once a week) were added into the former smoker category. Data for the years 1980–1995 were obtained from the Cancer Council Victoria surveys18–23 and data for 1998–2007 were obtained from the National Drug Strategy Household Survey confidential unit record files (through the Australian Social Sciences Data Archive).24–27 We initially included the survey data for 1998 in the model but the results for this year were much higher than the preceding or following years. We accordingly excluded these data from the model on the grounds that there was evidence that the prevalence of smoking was overestimated for this year because of a difference in the way that respondents were asked about their tobacco use in that survey.
The model set prevalence at age 20 as the proportion of smoking initiation because the survey data, when interpreted from a cohort perspective, indicated that smoking prevalence peaked in the age group 20–24. The observed prevalence of current smoking in 20–24 year olds was used to determine the prevalence of current smoking in 20 year olds. The prevalence of current smoking in all age groups for years without survey data available was estimated by interpolation between the survey data points using a cubic spline interpolation.31
Probability of dying in never, former and current smokers
The sex-specific, age-specific and year-specific mortality rates for never, current and former smokers were determined from the mortality rate in the total population, the prevalence of current and former smoking in the population and the relative risk of dying in current and former smokers (see Appendix). The age-specific, sex-specific and year-specific probability of dying for never, current and former smokers were determined from the mortality rates (see Appendix).
Number of never, current and former smokers
For the baseline year (1980), the number of men and women in the Australian population alive at each age from 0 to 100+ was obtained from Australian Bureau of Statistics data.16 The population was divided into current, former and never smokers, for all age and sex combinations. The prevalence in each was estimated from the prevalence of current and former smoking at each age in national survey data. After the baseline year, each of these subpopulations was followed according to a Markov process (see fig 1). The number of never, current and former smokers at each age and in the years following the baseline year was then estimated from (1) the number of each cohort in the preceding year, (2) the probability of death among never, current and former smokers; and (3) the proportional cessation among current smokers (see Appendix). Each year the number of infants that were born according to Australian Bureau of Statistics historical data was added to the model as the population aged 0.16
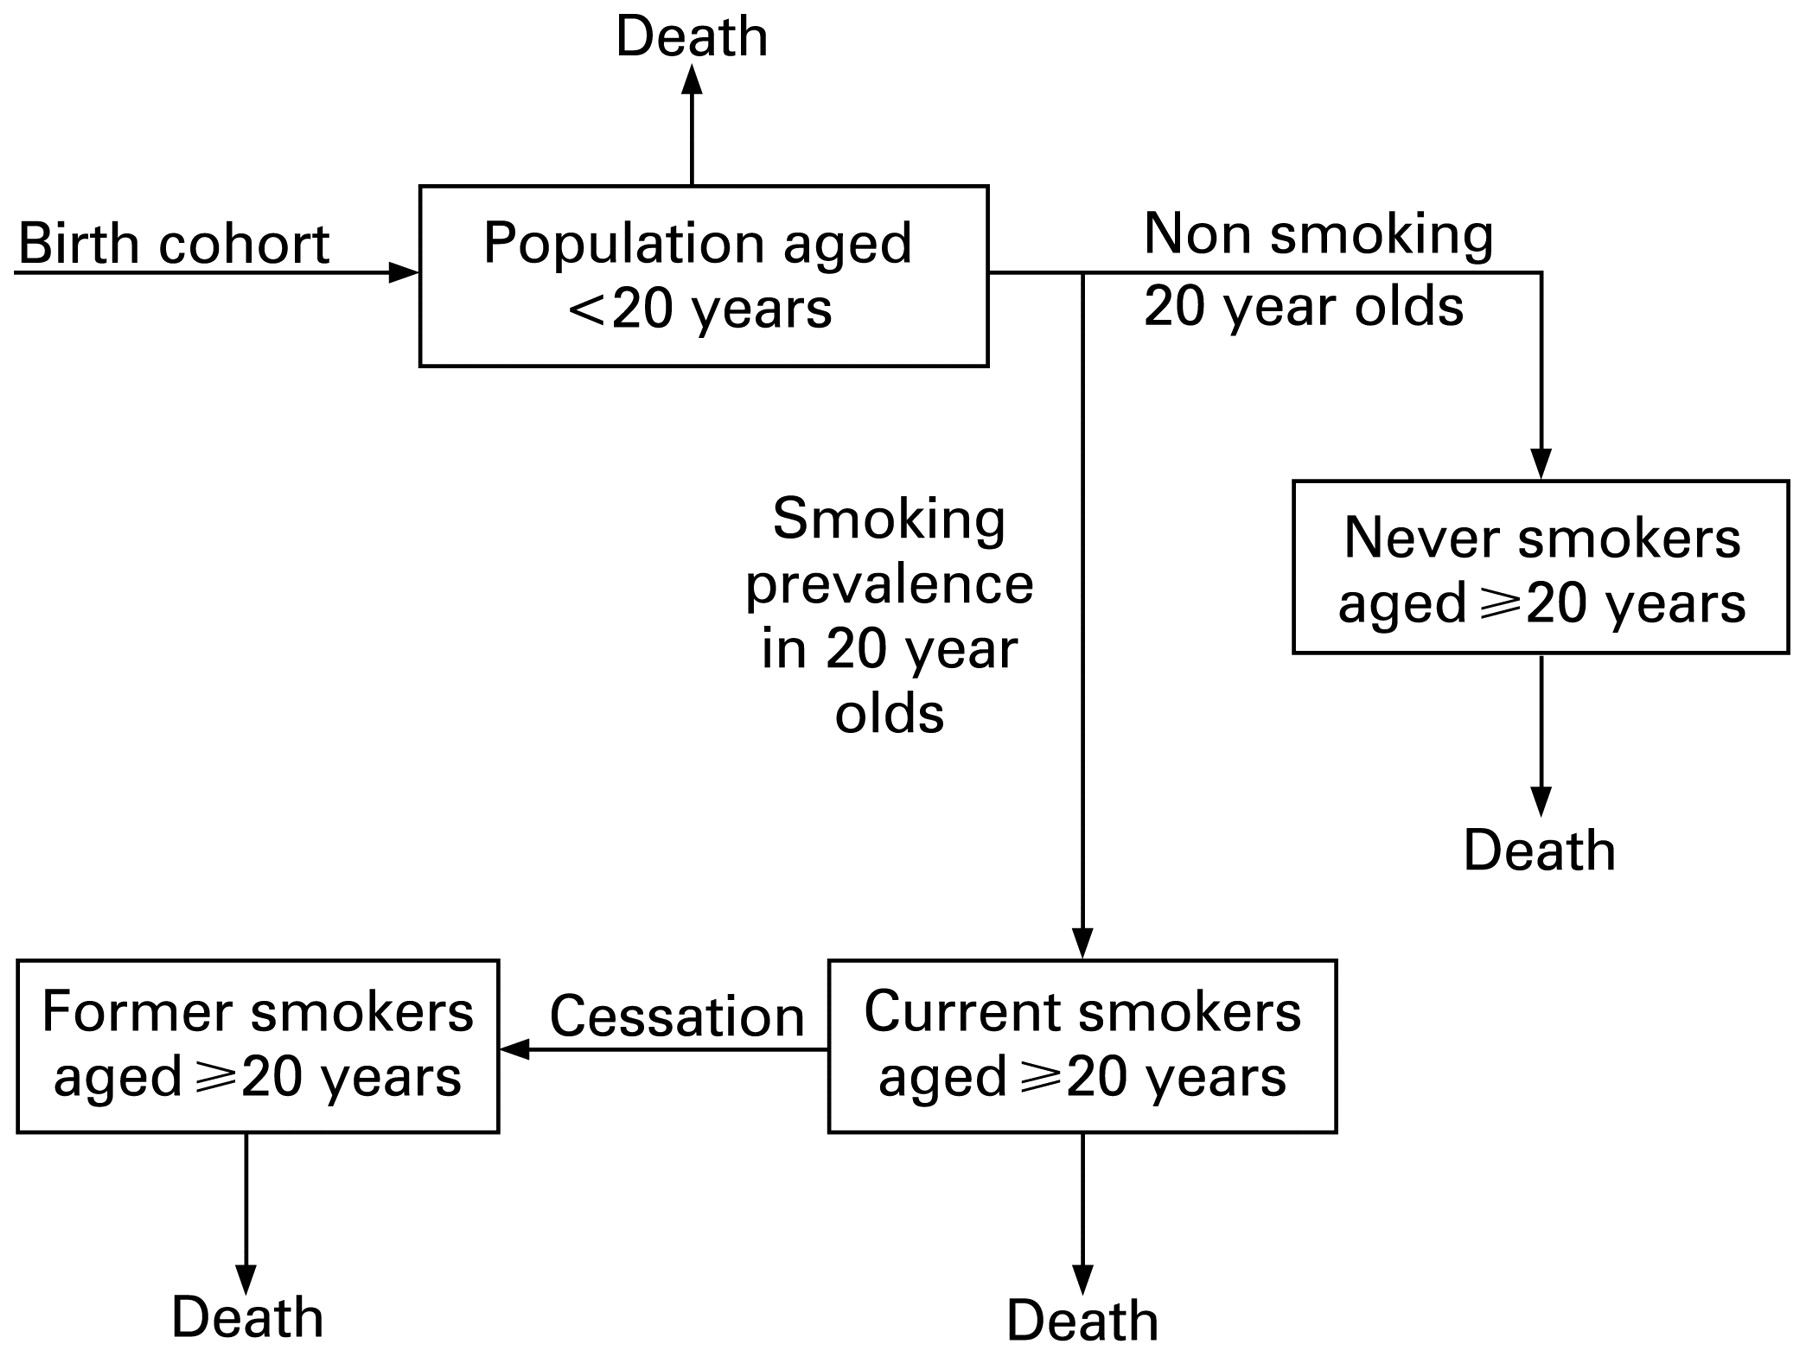
Overview of base model used to compute future prevalence of smoking in men and women.
Cessation rates
To estimate the age-specific, sex-specific and year-specific rates of quitting smoking, we used data on the past prevalence of daily or weekly smoking in men and women in 10 age groups (see tables 1 and 2). We estimated the 18 unknown cessation rates for 3 age groups (20–30, 31–50 and 50+), 3 time periods (1980–1989, 1990–2000 and 2001–2007) and by sex. The estimation selected the set of cessation values that reproduced as closely as possible the observed past estimates of the prevalence of smoking, using the method of weighted least squares. In order to account for the different sample sizes in each of the surveys we used the inverse of the variance of the observations to weight the observed smoking prevalence estimates in each year. We carried out the weighted least squares estimation procedure by feeding the calculated smoking prevalence of the baseline model and the observed data into a minimisation routine that adjusted the parameter values until the optimisation criterion was satisfied. The optimisation routine that we used was the generalised reduced gradient algorithm embedded in the “solver” add-in function in Microsoft Excel.32
Rate of decline in smoking initiation
The sex-specific average yearly decline in smoking initiation in 20 year olds between 2001 and 2007, was determined from the linear regression line through the observations in the national survey data from 2001 to 2007.
Modelling uncertainty in cessation and initiation rates
Table 3 summarises the assumptions made for each of the variables used to estimate the SD of the cessation rates. We assumed that the relative risks had a log normal distribution, and the prevalence of observed current, former and never smokers had a Dirichlet distribution with the observed numbers as parameters.33 We did a parametric bootstrap (2000 iterations) using Ersatz,34 an add-in software application for bootstrapping in Excel. At each iteration the interpolation of the smoking prevalence data was recalculated and the weighted least squares estimation redone. The resulting distributions of cessation rates were plotted as histograms that revealed the distributions to be normal, and used to estimate the mean and SD of the 18 cessation rates. Inspection of scatterplots showed no correlations between the cessation rates in each time period. The same procedure was used to estimate the SD of the average yearly rates of decline in smoking initiation in 20 year olds. These too were normally distributed.
Forecasting model
The forecasting model was a dynamic model similar to the base model. It was constructed using 2007 as the baseline year and was run until 2101 to allow the model to reach a steady state. The prevalence of male and female never, current and former smokers at each age in 2007 was obtained from the final year of the base model. The number of infants born in 2007 was obtained from Australian Bureau of Statistics historical demographic data series. The estimated number of infants born from 2008–2101 was obtained from the Australian Bureau of Statistics projected population figures under the “middle” assumption.35 The age-specific and sex-specific probability of dying among never smokers was assumed to remain constant from 2007–2101 at 2005 probabilities, the latest year for which these data were available. The number of male and female never, current and former smokers for each age for the years 2007–2101 was calculated using the same method as described for the base model under each of the following scenarios (table 4).
Uncertainty in prevalence estimates
The assumptions for each of the variables that were used to calculate the forecasted prevalence of current and former smoking are summarised in table 3. As in the base model, a parametric bootstrap was performed with 2000 iterations. The resulting distribution of current smoking prevalence in each age and sex grouping was used to estimate overall smoking prevalence (mean value) for each year and the SD of these estimates. To make sure that the proportional changes in smoking prevalence would never stray outside the −1 to 1 range, they were modelled as Beta distributions, rescaled to that range.
RESULTS
Cessation rates and decline in smoking initiation
The estimated average yearly rates of decline in rate of smoking initiation among 20 year olds and cessation rates are shown in table 5 (with lower and upper limits of the 95% CIs). In men and women, the decline in smoking initiation was greatest in the most recent period (2001–2007), due to a large decrease in the prevalence of smoking in young people between 2004 and 2007. In men and women, the cessation rate was highest in the oldest age group in all time periods.
Model fit
The base model produced a good fit for the survey data (when the data for 1998 were excluded) as indicated by an R2 of 0.987 for overall smoking prevalence (see fig 2).
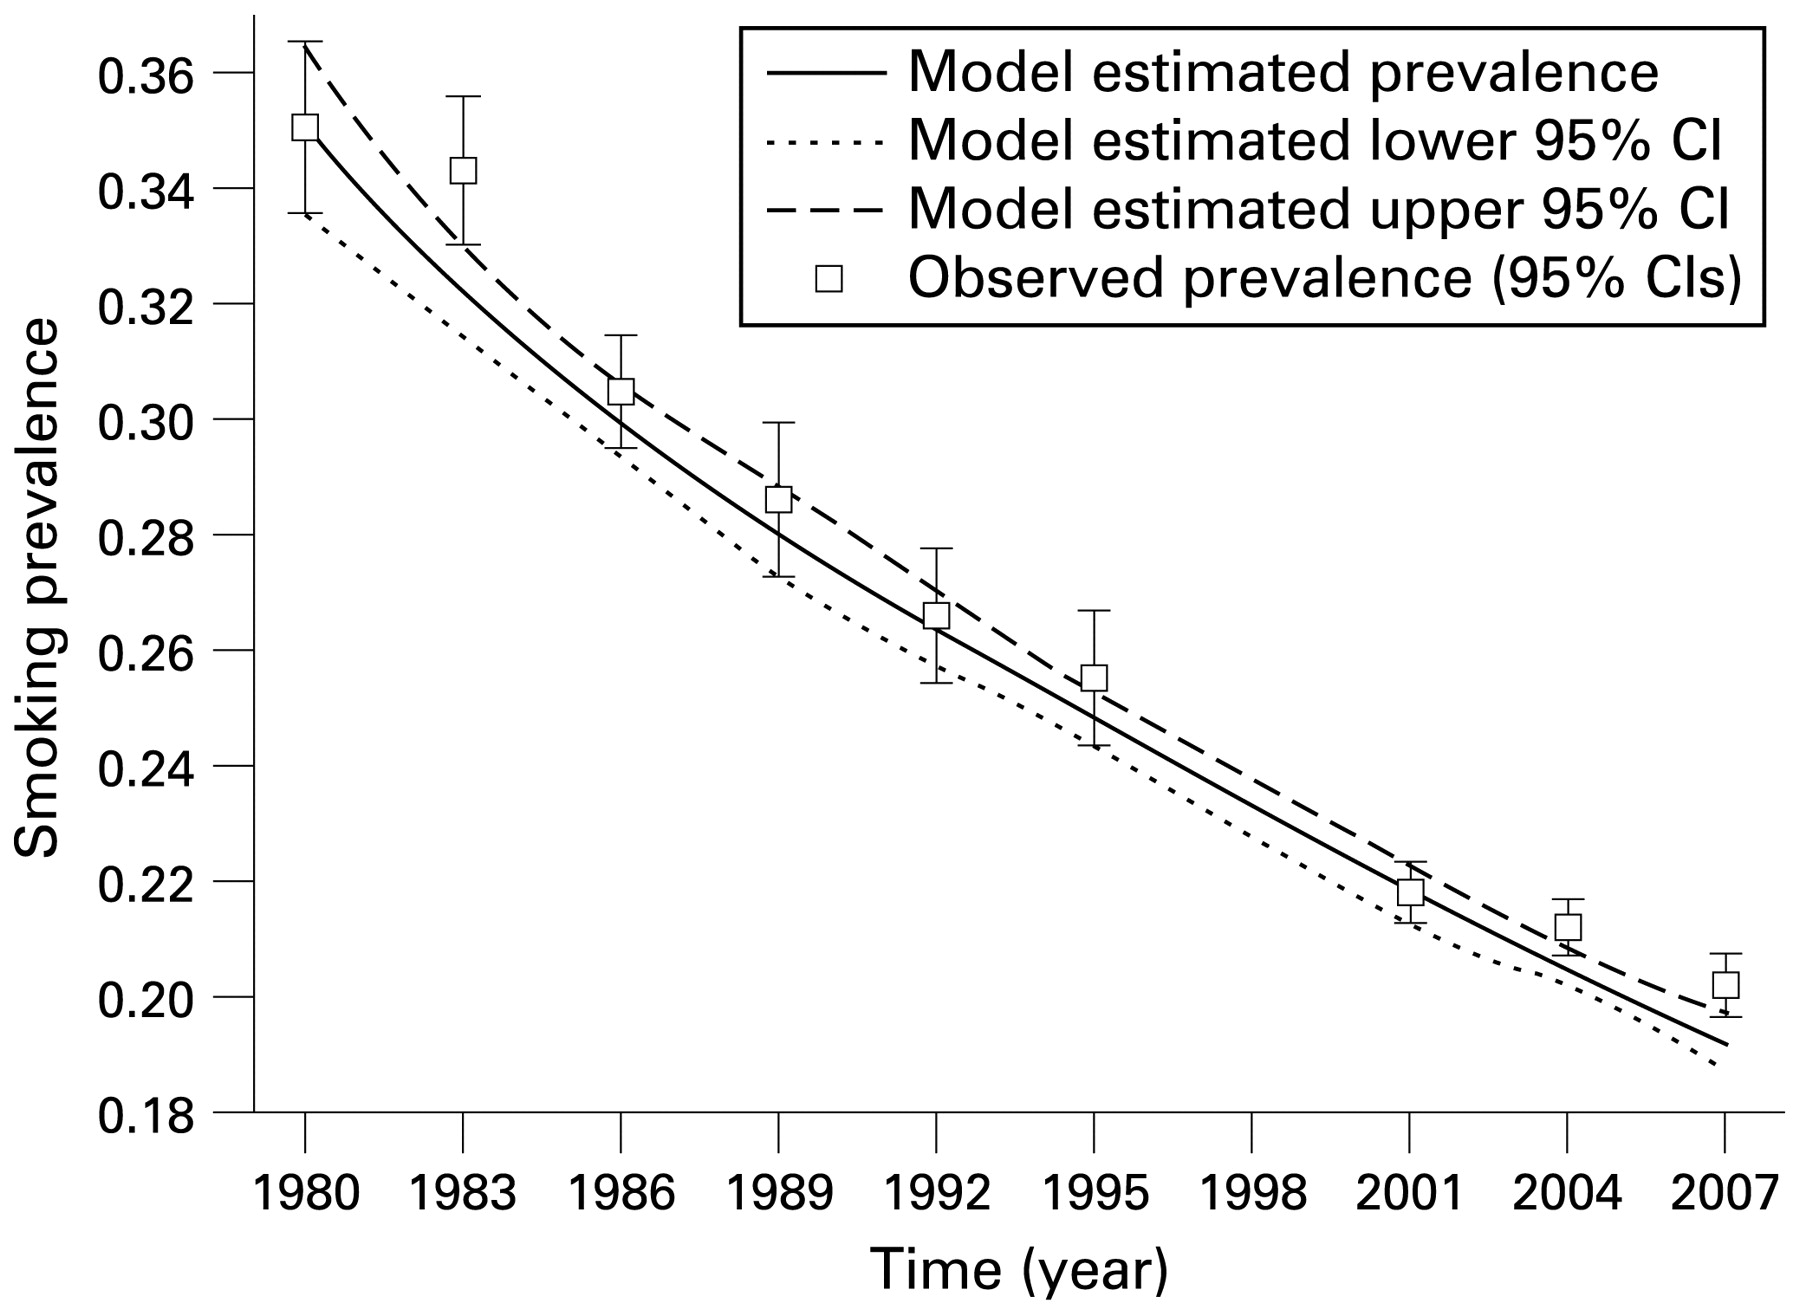
Smoking prevalence in the Australian population aged 20+ observed in national surveys and estimated with the base model.

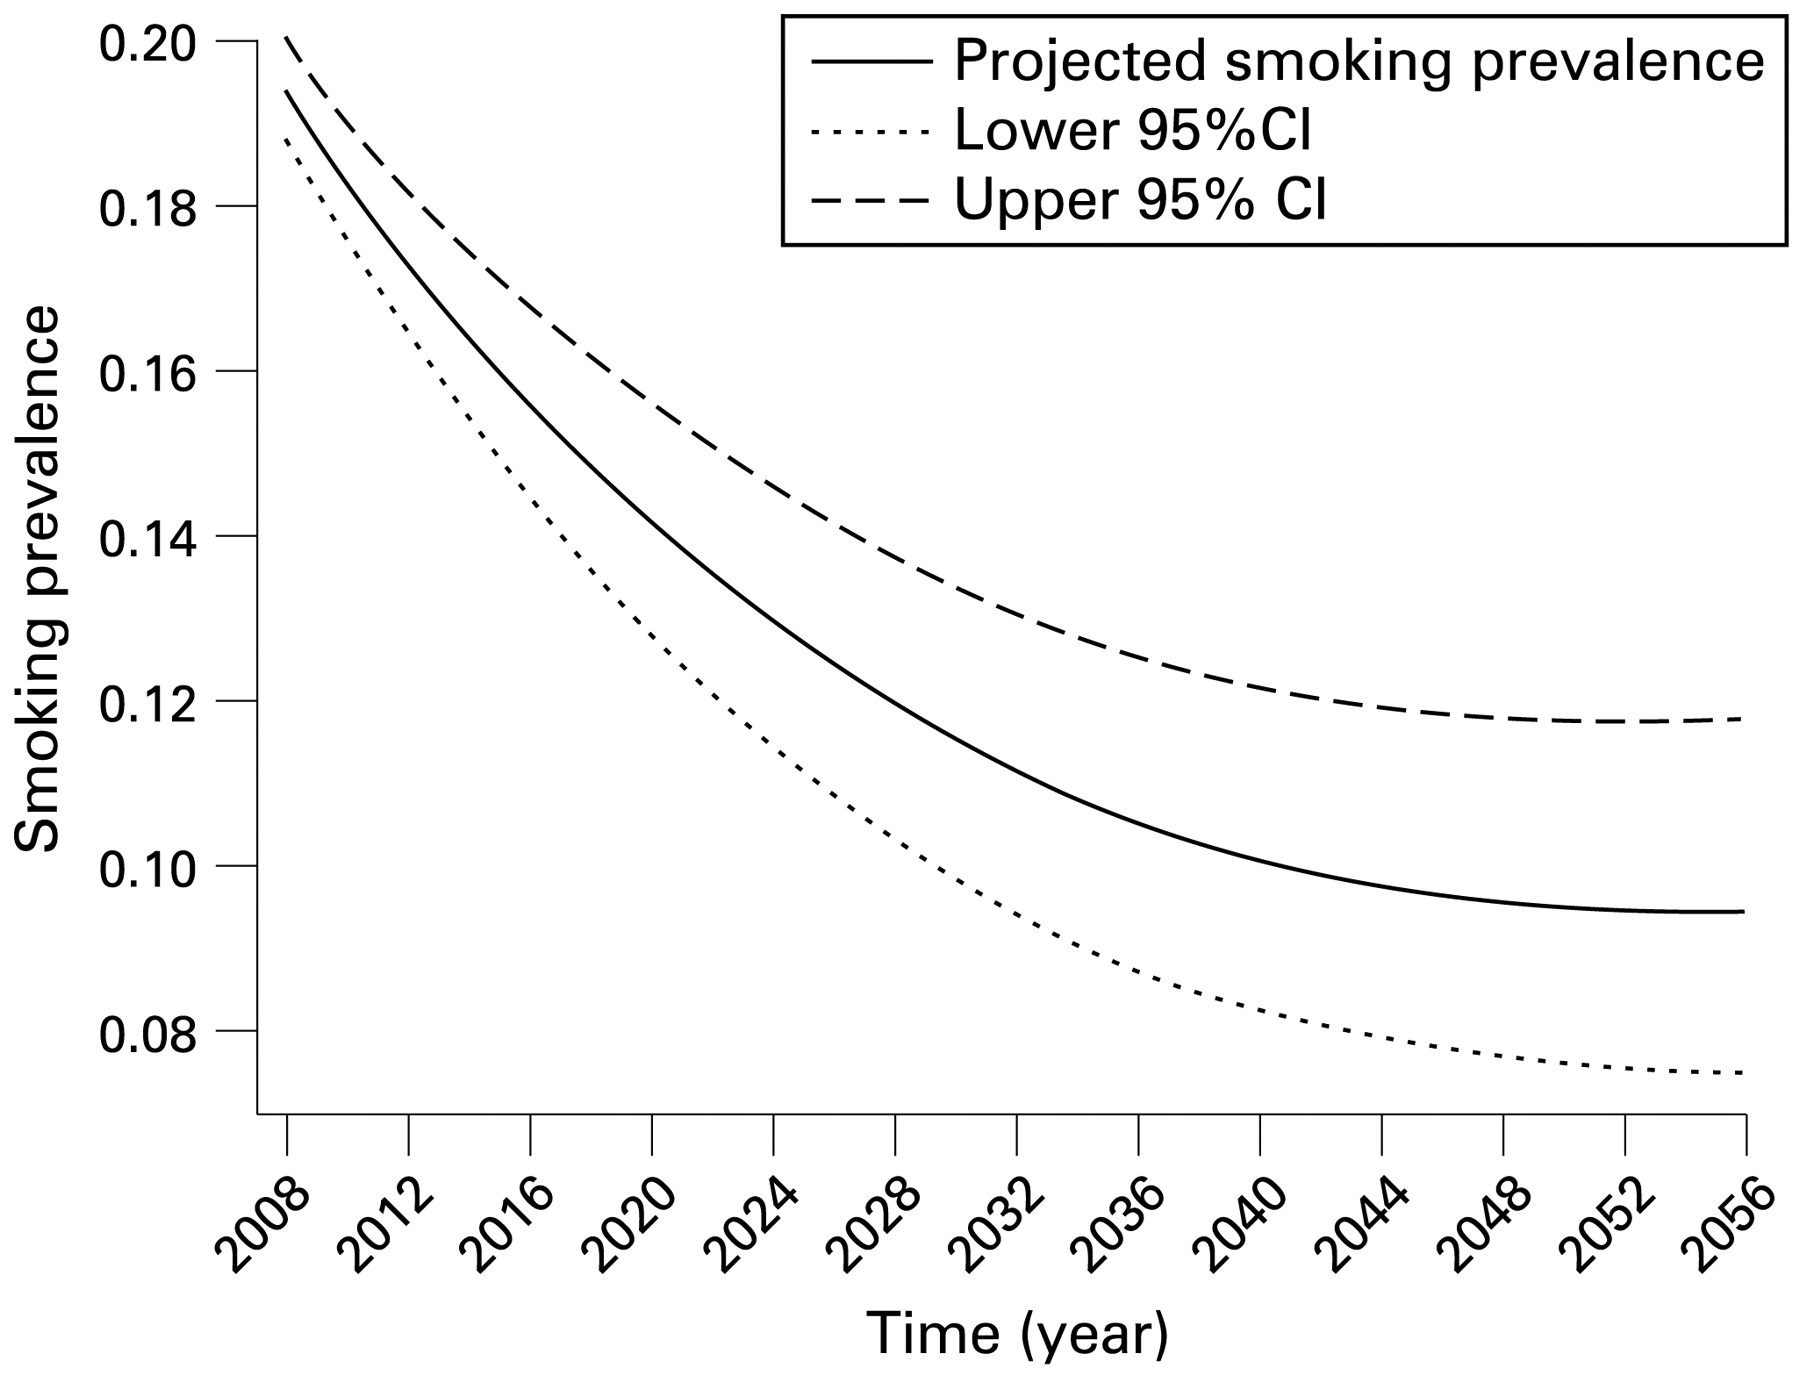
Projected future Australian smoking prevalence in population aged 20+ under status quo conditions.
Forecasting results
Scenario 1
Under this scenario (in which we assumed that the 2007 cessation and smoking initiation rates continued unchanged) the prevalence of smoking in the population aged 20+ declined to 18.3% (95% CI 17.6 to 19.0) in 2010 and 14.1% (95% CI 12.8 to 15.5) in 2020, before reaching a plateau just under 10% (95% CI 8% to 12%) around the year 2045 (see fig 3).
Scenarios 2–6
The projected annual smoking prevalence under each of the six scenarios is shown in fig 4. Under the second scenario (where the 2001–2007 cessation rates continued and smoking initiation rate continued to decline at the same rate as between 2001 and 2007) the prevalence of smoking declined to 18.2% (95% CI 17.5 to 18.9) in 2010, 13.1% (95% CI 11.9 to 14.5) in 2020 and reached 10.0% in 2028 and 5.0% in 2047.

Projected future Australian smoking prevalence in the population aged 20+ under six scenario conditions.
Increasing the rate of cessation produced a larger short-term decline in smoking prevalence while reducing the rate of initiation produced larger long-term declines. This can be seen by comparing the prevalence of smoking under scenario 3 (with the same cessation rates as 2001–2007 and double the decline in initiation rates) with scenario 4 conditions (initiation rate remained constant at 2007 level and the 2001–2007 cessation rates doubled). Scenario 4 produces a much lower prevalence sooner while under scenario 3 it takes nearly 30 years (until year 2034) to catch up and produce a lower prevalence. If future cessation rates do not improve from those of 2001–2007 levels and uptake rates remain unchanged, then a smoking prevalence of 10% will not be reached in Australian adults until the year 2040. If initiation rates continue to decline at the same rate as between 2001 and 2007, this target will be reached by 2028 or year 2026 if the decline in initiation is double the 2001–2007 decline. Only scenarios 4, 5 and 6, which include doubling of current cessation rates (table 4) predict a smoking prevalence of 10% by 2020.
DISCUSSION
Our estimates suggest that the decline in Australia’s smoking prevalence observed since the 1950s will continue while current rates of smoking cessation and initiation continue. However, if smoking initiation and cessation rates do not change from those of 2001–2007, the population smoking prevalence will stabilise at around 10% around the year 2045. Similar results have been reported in a study modelling the projected smoking prevalence in the USA. That study estimated that if the 1981–1993 cessation rates and smoking initiation rate of 25% continued, the US smoking prevalence would stabilise at 15% to 16% by 2050.15 Hence, our findings have implications for other countries at a similar stage of the cigarette epidemic, as described by Lopez et al.36
What this paper adds
Despite a substantial decline in the Australian smoking prevalence over the past 50 years, smoking remains the country’s leading preventable cause of disease burden. The Australian government is currently setting future targets for population smoking prevalence, but it is not clear what would comprise a reasonable policy target.
This paper uses a dynamic forecasting model to estimate future smoking prevalence in the Australian population based on a continuation of current trends in smoking uptake and cessation. A continuation of current smoking cessation and initiation patterns will see around 14% of adults still smoking in 2020. Smoking cessation rates will need to double for Australian smoking prevalence to reach a policy target of 10% by 2020.
The status quo scenario in which smoking initiation rates remain at 2007 levels may be overly pessimistic. In contrast to the USA, smoking initiation in Australia has declined steadily since the early 1980s. In 2007, only 8.6% of 14–19 year olds reported that they were current daily or weekly smokers compared to 12.3% in 2004.8 37 This decline in smoking initiation was also seen in the Australian Secondary Students Alcohol and Drug Surveys which reported a substantial decrease in smoking prevalence among secondary school students between 2002 and 2005.38 However, even if initiation continues to decline, smoking prevalence in the adult population will not drop below 10% until 2029 unless rates of cessation increase. A policy goal of 10% smoking prevalence in the Australian adult population by 2020 requires a doubling of the cessation rate observed between 2001 and 2007. Similar modelling of smoking prevalence in the UK showed that to reach a target goal of 12% smoking prevalence by 2020 would require a sustained combination of doubling the cessation rate and halving the initiation rates from the year 2000 onward.39
Our model also suggests that it will take nearly 30 years for a doubling of the current decline in initiation rate to reach the same smoking prevalence achieved by a doubling of the current cessation rate. Therefore, in addition to lowering rates of initiation, strategies are needed to increase cessation in current smokers. This situation is also likely to apply to other countries in later stages of the cigarette epidemic, such as the USA, Canada and UK.36 Examples of such strategies include: increased taxation, mass media campaigns, promotion of quitlines, reducing opportunities to smoke through public smoking bans and reducing the attractiveness, promotion and availability of cigarettes (eg, by removing them from supermarkets and convenience stores and restricting their sale to specially licensed outlets). A more controversial option that could be considered is to make less harmful forms of nicotine and smokeless tobacco products more readily available and taxing them at a lower rate than smoked tobacco.6 This option may reduce tobacco smoking and tobacco-related harm in Australia without eliminating all forms of tobacco use.40
Limitations
Our model did not attempt to include the effects of smokers moving in and out of the population via migration because of the lack of good data on the smoking prevalence among migrants. While smoking prevalence among immigrants will differ from that in the resident population, it is unlikely that the difference would significantly influence our results, given that the resident population is very large relative to the number of immigrants.
Our modelling also looked only at net cessation, and therefore did not explicitly model people who take up smoking after the age of 20, or people who repeatedly quit and relapse. The former group will be small and will therefore not affect results much. The latter group is larger but will on balance probably be captured either in the former or current smoker group.
The excess risk of dying is modelled simply as a relative risk for current and former smokers. In reality, smoking-related mortality depends on a large number of variables such as smoking years, smoking intensity, time since quitting, etc. However, the simple approach we took is sufficiently precise for the purpose of projecting future smoking prevalence, the main determinants of which are the initiation rate and the cessation rates.
We estimated the prevalence of current daily or weekly smoking in the adult population aged 20+ years. Different definitions of a “current smoker” or inclusion of younger smokers may have produced slightly different results. However, comparison of the differences between the prevalence of daily smoking in the population aged 14+ and the prevalence of daily or weekly smoking in the population aged 20+ in the last three National Drug Strategy Household Surveys were small. Applying the former definition and age range reduced the prevalence of smoking by approximately 10% relative to the prevalence observed under the latter definition and age range. If this difference remained constant, then use of the former definition and age range would produce a smoking prevalence of 12.7% rather than 14.1% in 2020 given a continuation of current smoking cessation and uptake patterns.
Conclusions
Australia’s smoking prevalence will continue to fall while current rates of initiation and cessation are maintained. But a continuation of current smoking cessation and initiation patterns will still see around 14% of Australian adults smoking in 2020. Smoking cessation rates will need to double if Australian health policy makers are to reduce smoking prevalence to 10% by 2020. Achieving this ambitious goal will require an intensification of current restrictions on smoked tobacco sales and increased assistance to smokers who wish to quit.
APPENDIX
Calculation of probability of dying in never, current and former smokers
The age-specific, sex-specific and year-specific probabilities of dying (q) in the total Australian population were converted to a mortality rate using the following formula:

Where,

is the mortality rate in the total population aged a at time t

is the probability of dying in the total population aged a at time t (obtained from Australian Bureau of Statistics (ABS)).
The sex-specific, age-specific and year-specific mortality rates for never, current and former smokers were then determined by:


Where:

is the mortality rate in never smokers at age a, at time t.

is the relative risk of dying in current smokers compared to never smokers from Cancer Prevention Study II (CPSII) at age a

is the prevalence of current smokers in the population at age a, at time t.

is the relative risk of dying in former smokers compared to never smokers from CPSII at age a

is the prevalence of former smokers in the total population at age a, at time t
The mortality rates were then converted to the probability of dying at age a and time t according to:

Calculation number of never, current and former smokers at each age in model
The number of never, current and former smokers at each age and in the years following the baseline year is determined according to:


Except for age 20, which was determined according to:


Where:

is the number of current smokers in the population at age a at time t

is the number of former smokers in the population at age a at time t

is the number of never smokers in the population at age a at time t

is the proportional change in current smoking prevalence at time t and age a
Acknowledgments
We would like to thank Dr Vicki White from the Centre for Behavioural Research in Cancer at the Cancer Council Victoria for providing the data on Australian smoking prevalence between 1980 and 1995 and Ms Michelle Scollo of the VicHealth Centre for Tobacco Control, Professor Simon Chapman from University of Sydney and Dr Mark Clements from Australian National University and two anonymous reviewers for helpful comments on an earlier draft of this manuscript. The confidential unit record files for the National Drug Strategy Household Survey datasets were provided by the Australian Institute of Health and Welfare, the Department of Health and Ageing and the Australian Social Science Data Archive; however they bear no responsibility for the analyses presented within this publication or the interpretation of them.
REFERENCES
Footnotes
Funding: This research was funded by the Australian National Health and Medical Research Council (NHMRC) grant 396402, Future of Tobacco Control. CEG was supported by a NHMRC Postdoctoral Research Fellowship.
Competing interests: None.