Article Text

Abstract
Objective: To examine the relation between rates of sales of tobacco to minors and youth smoking prevalence.
Design: Repeated annual cross sectional surveys.
Setting: Seventy five communities in Oregon.
Participants: A random sample of students in grades 8 and 11 (ages 13 and 17 years) and retail outlets in each participating community.
Main outcome measures: Thirty day and daily smoking prevalence.
Results: The rate of illegal merchant sales in the communities was related to the smoking rate for 11th graders in those communities, but not for 8th graders. For every 10% increase in illegal sales rates there was an estimated 0.8% increase in 11th grade 30 day smoking prevalence and a 0.4% increase in daily smoking. Communities with lower illegal merchant sales rates had expanded use of social sources and reduced use of commercial sources by 11th graders, with the opposite pattern seen in 8th graders.
Conclusions: There appears to be a relatively small positive linear relation between the community rate of sales to minors and 11th grade youth smoking prevalence in those communities. Youth adjust their tobacco sources depending on the level of commercial availability.
- adolescent smoking
- prevalence
- sales to minors
Statistics from Altmetric.com
Efforts to reduce adolescent access to tobacco constitute a major strategy for the prevention of adolescent tobacco use.1 Until recently, young people in most states could readily purchase tobacco products.2 Because of this, efforts have increased to reduce the supply of cigarettes and other tobacco products in the hopes that it would reduce the number of young people who become addicted.3–7 The most extensive of these efforts has been the Federal Synar Amendment,8,9,10 which threatens states with loss of drug treatment block grant funds if they do not lower their rates of illegal sales of tobacco.
Although a number of studies have found that reducing illegal sales contributes to a reduction in smoking prevalence11–14 others have not found such a relation.15–18 A review by Stead and Lancaster19 and a recent meta-analysis by Fichtenberg and Glantz20 did not find conclusive evidence of a relation between reductions in access and reductions in adolescent smoking prevalence. However, these conclusions are somewhat limited by the small number of available studies (eight) and communities (27) investigated.
Given the resources that go into access reduction,21 it is important to investigate further the relationship between access to tobacco products and adolescent tobacco use across a large sample of communities. The present paper examines these relations in a population based sample of 8th and 11th grade students and retail outlets in 75 communities in the state of Oregon assessed annually over a three year period. Our primary question concerns the relation between rates of illegal sales of tobacco to minors in the community and the prevalence of youth smoking use among students in that community.
It is clear, however, that commercial sales are not the only source of tobacco for young people. Many young people indicate that they obtain tobacco from friends and family members,2,22 and it is possible that these sources of tobacco have expanded where illegal sales have been curtailed. For this reason the present study also examines the extent of these other sources and their relation to access restrictions and tobacco use.
METHOD
Design and participants
Oregon Healthy Teens (OHT) is a systematic study of influences on adolescent tobacco use designed to clarify the relative value of different prevention activities. The primary dependent variable is the prevalence of tobacco use among student in grades 8 and 11. We identified and recruited a population based sample of the communities in Oregon, geographically defined as the catchment area of each public high school in the state. We randomly selected, proportional to student enrolment size, 115 such communities and successfully recruited schools and conducted store purchase surveys in 75 (65%) of them. The 75 communities contained a total of 75 schools with 11th grade students and 93 schools with 8th grade students. The median enrolment in the communities was 156 11th grade students (range 25–585) and 158 8th grade students (range 25–494). Schools in the participating communities did not different systematically in enrolment size from those that chose not to participate.
We attempted to survey all of the 8th and 11th grade students in these 75 communities annually over the three year period of 2001 to 2003. The same schools, but different birth cohorts, were assessed each year. Approximately four weeks before survey administration, parent notification letters were mailed to the student’s home, with instructions to notify the school if they wished their child not to participate. Research staff administered anonymous student questionnaires in classrooms during regular school periods, and students were instructed that their participation was voluntary. Parents of 5% of the students wished their child not participate, and an additional 2% of the students chose not to participate. In addition, another 14% of the students listed on the class rosters were not present on the day of the survey, bringing the student participation rate to 79%. The student participation rate did not vary systematically across communities.
For the present analysis there are 10 171 student participants with data on the measures of interest. Of these, 5697 were in grade 8 and 4474 were in grade 11. Students were distributed approximately evenly across the three years. Three per cent were Native American, 2% were Asian, 1% were Hawaiian or Pacific Islanders, 2% were African American, 10% were Hispanic, 77% were white, non-Hispanic, and 5% were of mixed ethnicity. Fifty per cent of the sample was female.
Assessments were also made of illegal sales of tobacco to young people through annual minor purchase attempt surveys. The Oregon Department of Revenue provided a list of cigarette vendors, which allowed us to identify all of the retail outlets selling tobacco in each community. We selected a random sample of 15 outlets in each community for assessment. If a community had fewer than 15 outlets, we conducted surveys in all outlets. The same outlets were assessed each year. Our staff conducted at total of 1869 tobacco purchase surveys in 623 unique outlets in the 75 communities. Small markets made up 32% of the outlet sample, 38% were convenience store/gas (petrol) stations, 22% were large grocery stores, and 8% were drug or variety stores.
Measures
The OHT student survey
The questionnaire consists of a set of six content area modules compiled into alternate forms so that any given student completes a randomly chosen set of three modules. Approximately 20% of the students in a given classroom received any given pair of content modules, with the other 80% receiving different content pairings.
The primary dependent variable is smoking in the last 30 days. Estimates of smoking status and smoking prevalence were derived from students’ answers to the question on the drug use module, “During the PAST 30 days, on how many days did you smoke cigarettes?” with choices: 0 days, 1 or 2 days, 3–5 days, 6–9 days, 10–19 days, 20–29 days, and all 30 days. The item wording and response scale comes from the Youth Risk Behavior Survey.23 Those who indicated that they had smoked on one or more days were classed classified as 30 day smokers (yes/no). As a secondary outcome, we also classified a student as a daily smoker (yes/no) if they indicated on this item that they had smoked all 30 days.
On a separate module, students reported where they obtained tobacco products: “During the past 30 days, how many times did you get tobacco from each of the following sources…” followed by a list of 12 possible sources. Students indicated their use on an eight point scale (none, 1, 2, 3, 4, 5–9, 10–14, 15 or more). A preliminary factor analysis indicated that the 12 items formed four factors. The first was a “commercial source” factor composed of grocery stores, convenience stores, drug stores, and gas stations; and the second was a “social source” factor consisting of friends over 18, friends under 18, and parents and siblings. The other two factors were a “grey market” factor consisting of vending machines, the internet, and people selling on the street; and a “stolen” factor, with the item “took from home without permission”.
Because the frequency of responses to source usage was highly skewed toward zero, for the purposes of analysis here the source factors were binary coded as Yes (used the source at least once = 1) and No (did not use the source = 0).
Purchase survey of tobacco outlets
We estimated the rate of illegal sales of tobacco to young people in the communities through annual purchase surveys conducted by young people age 15–17 years. The protocol required that an adult supervisor accompany two youths to each outlet. Both teens entered the outlet and alternated in making the purchase attempt. They first selected a food item, such as a candy bar, and then asked for a pack of Marlboros or Camels. If the clerk was willing to sell, the teen said that he or she did not have enough money and bought only the food item. If the clerk asked about their age, the teens answered honestly. If the clerk asked for their ID, the teens indicated they did not have any with them. Immediately following the purchase attempt, both teens left the outlet and completed a brief assessment form indicating the outcome. We calculated the illegal merchant sales rate (MSR) as the percentage of outlets in each community that were willing to sell tobacco to the minors as a community level measure.
Analysis
We used a multilevel modelling approach to examine the relation of both individual level and community level access measures to youthful smoking.24 Individual level smoking was predicted from individuals’ reports of use of the four source factors; the communities’ estimated illegal merchant sales rate; and the cross level interaction between the two. The model intercepts and source factor coefficients were considered as random factors. Year of measurement was included as a fixed effect covariate.
We centred the source predictor variables around their group (community and year) means. We did not centre illegal sales rates so that the coefficient for that variable represents estimated changes in community smoking rates for going from a 0% to 100% illegal merchant sales rate. Sampling weights that account for non-response and county post-stratification were used in all calculations, and we use a two tailed significance level cut off of p < 0.05. Separate models were estimated for each grade.
RESULTS
Eighth grade
Table 1 presents results for 8th grade 30 day smoking. At the community level, all variance components for means and source usage rates were significant, indicting that the smoking rates (means) and relative use of sources varied beyond chance over communities. The average effects parameters for the individual level indicate that overall, commercial sources, social sources, and stealing from home were each significantly and independently related to the probability of smoking for eighth graders, while grey market sources did not contribute significantly, given their use of the other three sources. Social sources were by far the largest contributing source. At the community level, the merchant sales rate (MSR; 2.0%, t = 1.11) and secular trend for time (−0.5%, t = −1.14) were not significantly related to the rate of smoking in the community. The coefficient for the population smoking rate, estimated at zero MSR, is 12.7% (SE 0.8%); down only slightly from an observed rate of 13.2%.
Smoking prevalence predicted from tobacco source and access measures, multi-level modelling for 8th grade
Two of the cross level effects were significant. The positive coefficient for MSR → social sources indicates that communities that had higher sales rates also had social sources making a greater contribution to 8th grade smoking. The negative coefficient for MSR → commercial source indicates that in communities with higher sales rates 8th graders made less use of commercial sources. Use of grey market and stealing sources by 8th graders appeared to be unaffected by community level merchant sales rates.
An analysis using the same models with daily smoking as the outcome produced a nearly identical pattern of coefficients (not shown) and the same statistical conclusions regarding the source usage patterns and the lack of impact of merchant sales rates on smoking for 8th graders.
Eleventh grade
Table 2 presents results for 11th grade 30 day smoking. At the community level, all variance components for means and source usage rates were significant, indicting that the smoking rates (means) and relative use of sources (slopes) varied beyond chance over communities. At the individual level, commercial sources and social sources were each significantly and independently related to the probability of smoking, with social sources again making, by far, the biggest contribution. Use of grey market and stealing sources by 11th graders do not appear to contribute, given their level of use of the other sources.
Smoking prevalence predicted from tobacco source and access measures, multi-level modelling for 11th grade
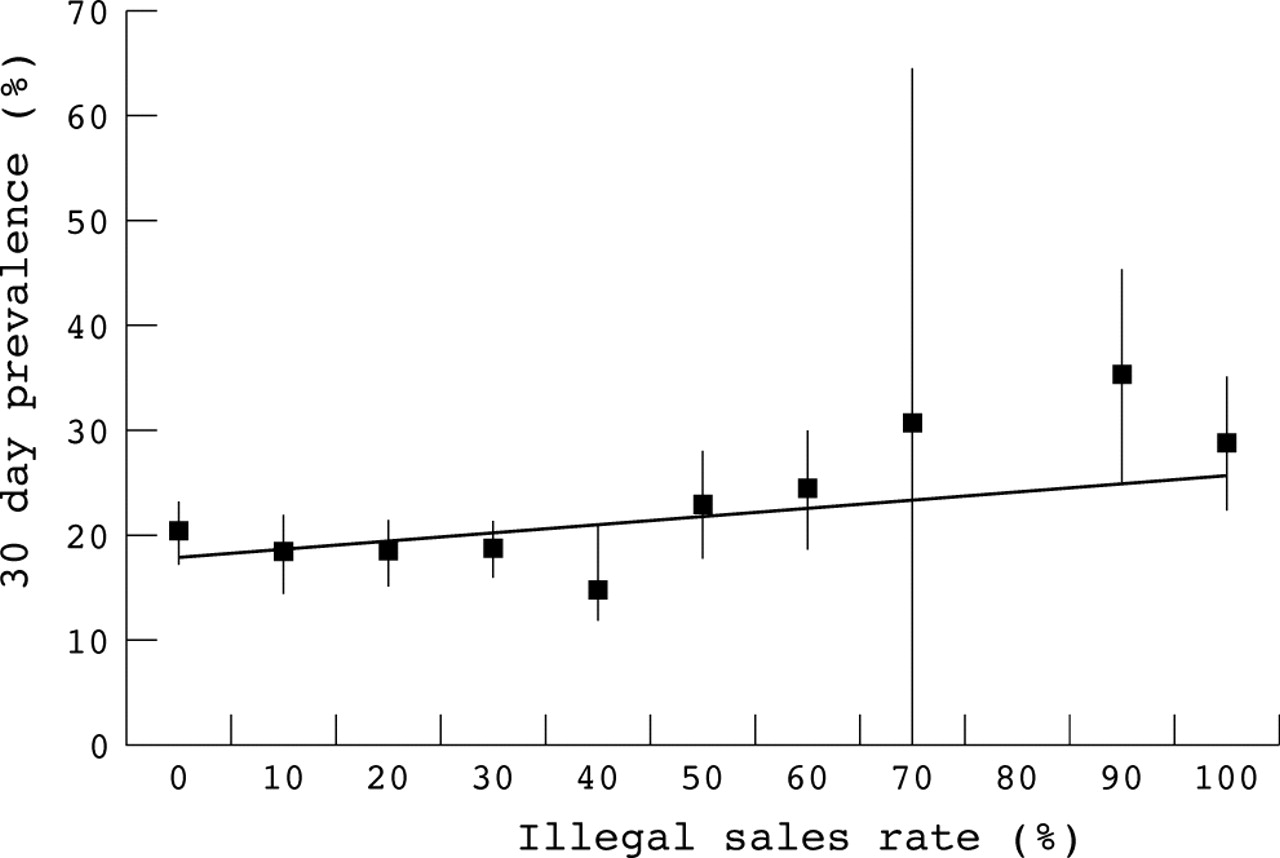
The community level results indicate that the smoking rate was stable over the three year period, dropping only an average of 0.3% per year, which was not significant (t = −0.54). Merchant sales rate was significantly related to the prevalence of smoking in the community, with the estimated rate of smoking being 7.9% (SE = 2.4%, t = 3.16) higher in a community if it had 100% of outlets willing to sell than if there were zero sales. The population smoking rate estimate with a zero sales rate is 17.9% (SE = 1.2%); down 2.6 percentage points from the 20.5% observed rate.
There were two significant cross level effects for commercial sales. In communities with higher merchant sales rates, commercial sources made a significantly greater contribution to smoking prevalence than was true in communities with lower merchant sales rates. In communities with more restrictive access, social sources made a compensatory greater contribution. Use of grey market and stealing sources by 11th graders appears to be unaffected by community level merchant sales rates.
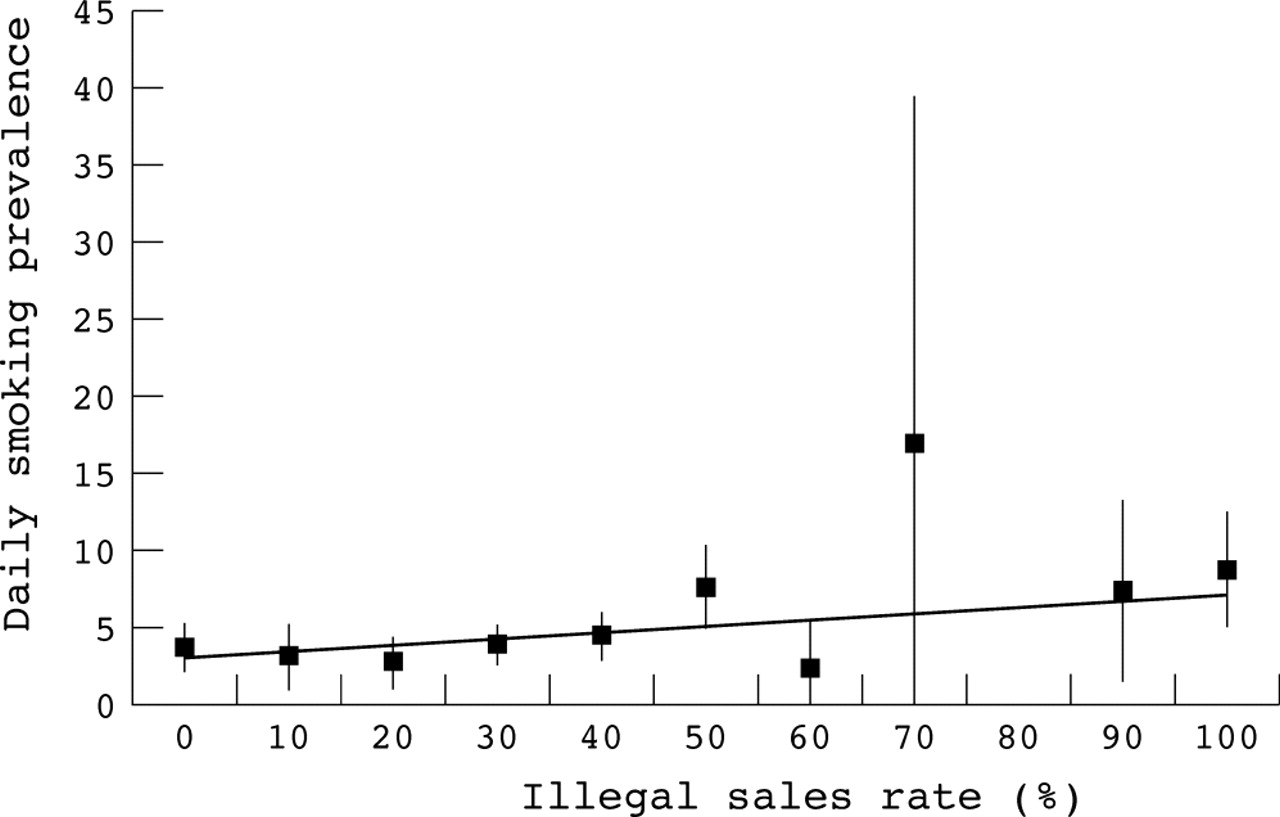
An analysis using the same models with daily smoking as the outcome produced a nearly identical pattern of coefficients (not shown) and the same statistically supported conclusions regarding the source usage patterns and the impact of merchant sales rates. The estimated effect for going from a 0% to 100% community level merchant sales rates was a significant increase of 4.1% (SE = 1.4, t = 2.86) on 11th graders daily smoking rate.
Linearity of effect
It has been argued that the relation of tobacco sales rates and youth smoking prevalence may be a non-linear function, specifically that it is necessary to get sales rates below 10% of outlets willing to sell before smoking rates are impacted.18,25 To examine this possibility, and as a check on the above models assumption of linearity, we added a non-linear term (that is, MSR squared and piecewise linear functions across a threshold) to the multilevel models. In each case linearity could not be rejected, as the improvement in model fits were always non-significant. Figures 1 and 2 present plots of the fitted linear function and the observed smoking rates and 95% confidence intervals at each 10% category grouping of illegal sales rate for 11th grade 30 day and daily smoking. The observed smoking rate patterns in each figure do suggest that the relation may be flat or slightly negative between 0% and 40% and more positive between 40% and 100%, especially in 30 day smoking (fig 1). However, the scarcity and/or variability of communities with sales rates over 60% leads to a lack of rejection of simple linearity across the full range of observed values. Plots for 8th grade exhibit a similar pattern (not shown), although the overall slope of the fitted lines do not differ from zero.

Relation between sales and 30 day smoking rates (grade 11).
Relation between sales and daily smoking (grade 11).
DISCUSSION
The present study is among the largest to examine the relation between rates of merchant sales to minors in a community and youth smoking rates in those communities. It is also among the first to examine directly the impact of those sales on social and grey market sources. The findings provide limited support for the value of reducing young people’s access to commercial sources of tobacco, and indicate that social sources of tobacco are a significant factor in adolescent smoking.
The results on tobacco source usage rates are consistent with other studies suggesting that the sources of tobacco for adolescents are largely social.6,22,25 Still, commercial sources appeared to be used significantly over and above social sources for both age groups.
The rate of illegal merchant sales in the community was directly related to smoking rate for 11th grade but not for 8th grade. For every 10% increase in illegal sales rates there was an estimated 0.8% increase in 11th grade 30 day smoking prevalence and a 0.4% increase in daily smoking, and this effect was statistically consistent (linear) across the range of 0% to 100% sales. Although these results at first appear more optimistic than prior summaries,19,20 we note that the present results are actually very consistent with the meta-analysis findings if one considers the range of sales rates examined in those studies. If the range of sales rates were restricted to the lower end of the scale, no overall evidence of association between youth sales and smoking rates would be observed in our data.
It could be argued that the lack of association for the younger students (8th graders), and to some extent even the relatively small association for 11th graders, may be due to measurement problems inherent in artificial purchase attempts. Students do not choose stores at random, but rather may know which stores will sell to them or not. Similarly, although we used a standard Synar protocol,9,10 other protocols, such as lying about age or producing a valid ID when asked, may produce higher buy rates.26 The artificial protocol certainly has a high false negative rate, making the true access rates higher than those observed here. However, if we assume these downward biases are relatively constant across communities, the co-variation between sales and smoking rates should remain fairly unbiased, other than as influenced by possible range restrictions mentioned above.
Evidence from significant cross level interactions in the multi-level model indicated that youth adjust their tobacco sources depending on the level of commercial availability. Communities with lower illegal merchant sales rates had expanded use of social sources and reduced use of commercial sources by individual 11th graders relative to those with higher sales rates. Interestingly, the opposite pattern seen in 8th graders—lower community sales rates (to 15–17 years olds) was associated with reduced social source use and increased commercial use by individual 8th graders (13 year olds). This could be due to the decreased availability of tobacco from slightly older friends, who could not easily buy from commercial sources. These results are consistent with the findings of Forester and colleagues27 that obtaining cigarettes from social and commercial sources are inextricably linked for adolescents.
To the extent that these results are not caused by weaknesses in the measures, they suggest that restricting sales will have a small effect on smoking. There are several reasons why this may be so. First, tobacco is readily available from social sources. Thus, even complete elimination of commercial sales to those under 18 would not eliminate their access to tobacco products. It is true that two of the social sources of cigarettes could be affected by complete elimination of sales to those under 18—that is, friends under 18 and siblings under 18 would presumably be less likely to have tobacco products under those circumstances. However, even in that case, a significant proportion of young people would be able to obtain tobacco from the remaining social sources.
Second, it has been argued that in order for sales restrictions to affect smoking prevalence it may be necessary to get sales rates below 10% of outlets willing to sell.18,25 Inspection of our data revealed that in fact that while reductions are predicted to take place throughout the range of sales, there is relatively little observed change at the lower end of the sales rate range. Given that in 2003 national levels of illegal sales are in the 5–30% range (median 11%), further efforts to reduce sales will not result in substantial gains in prevalence reduction. This calls into question the claim that access reduction will curtail prevalence, if only we can lower it sufficiently.
Study limitations
This study has several limitations. First, this is an observational study in which the natural variation across communities in sales to minors and youth smoking were examined for co-variation. The results cannot be used to imply causality or direction of effects of one of these variables on the other. We simply document that the co-variation exists in a large sample of communities.
What this paper adds
Evidence from studies of the impact of sales restrictions to minors and smoking prevalence has given conflicting results. In previous studies, the number of communities in which both merchant sales rates and youth smoking are available has been small. This study provides information about the relation observed in a relatively large number of communities.
Second, the communities in this sample were limited to the state of Oregon over a particular period in history and the results may not be representative of other states or future time periods. In particular, Oregon has had high tobacco surtax since 1998 and had a mature and ongoing statewide tobacco control programme during the period studied. That programme has since been dramatically reduced due to a state budget crisis, as have others in other states nationally.