Article Text

Abstract
Objective: To assess effects of the Master Settlement Agreement (MSA) and the four individual state settlements on tobacco company decisions and performance.
Design: 10-K reports filed with the US Securities and Exchange Commission, firm and daily data from the Center for Research in Security Prices, stock price indices, market share and advertising data, cigarette export and domestic consumption data, and newspaper articles were used to assess changes before (1990–98) and after (1999–2002) the MSA was implemented.
Subjects: Five major tobacco manufacturers in the USA.
Main outcome measures: Stockholder returns, operating performance of defendant companies, exports, market share of the original participants in the MSA, and advertising/promotion expenditures.
Results: Returns to investments in the tobacco industry exceeded returns from investments in securities of other companies, using each of four indexes as comparators. Domestic tobacco revenues increased during 1999–2002 from pre-MSA levels. Profits from domestic sales rose from levels prevailing immediately before the MSA. There is no indication that the MSA caused an increase in tobacco exports. Total market share of the original participating manufacturers in the MSA decreased. Total advertising expenditures by the tobacco companies increased at a higher rate than the 1990–98 trend during 1999–2002, but total advertising expenditures net of spending on coupons and promotions decreased.
Conclusion: The experience during the post-MSA period demonstrates that the MSA did no major harm to the companies. Some features of the MSA appear to have increased company value and profitability.
- CPI, Consumer Price Index, CRSP, Center for Research in Security Prices
- MSA, Master Settlement Agreement
- NPMs, non-participating manufacturers
- OPMs, original participating manufacturers
- SEC, Securities and Exchange Commission
- SIC, Standard Industrial Classification
- SPM, subsequent participating manufacturer
- litigation
- Master Settlement Agreement
- tobacco manufacturers
Statistics from Altmetric.com
- CPI, Consumer Price Index, CRSP, Center for Research in Security Prices
- MSA, Master Settlement Agreement
- NPMs, non-participating manufacturers
- OPMs, original participating manufacturers
- SEC, Securities and Exchange Commission
- SIC, Standard Industrial Classification
- SPM, subsequent participating manufacturer
On 23 November 1998, Philip Morris, RJ Reynolds, Lorillard (unit of Loews), and Brown & Williamson (US subsidiary of British American Tobacco), and 46 state attorneys general signed a $206 billion agreement, known as the Master Settlement Agreement (MSA).1 Four states were not part of the MSA and settled separately with the tobacco companies before the agreement. A fifth company, Liggett (unit of Vector Group), eventually signed onto the MSA.
The MSA and the individual settlements imposed financial penalties in the form of annual payments to states and restrictions on behaviour. State, and some local, governments received compensation for past losses stemming from treatment of tobacco related diseases through their Medicaid programs. However, neither the federal government nor persons with tobacco related diseases were compensated by the MSA. Like most litigation, the states settled with the tobacco companies. Recipients of MSA funds were not required to spend the money in particular ways.2–4
To the extent that actions of tobacco companies harmed the states, ultimate responsibility for past behaviour should fall on shareholders and on boards to which they delegated decision making responsibility. However, since the settlement payments were based on tobacco company sales rather than as a lump sum obligation, which would have been borne by shareholders, the payment schedule was structured like a per unit excise tax imposed on a commodity. Conceptually, such a tax is shifted to consumers of the product, and when the market structure is oligopolistic, as is the tobacco industry, there may be an overshifting of the tax.5–7 Imposition of an excise tax-like payment may facilitate collusion in price among competing companies.8 Thus, profitability may increase after the tax is imposed. In the month following passage of the MSA alone, tobacco retail prices rose by 18.8% per pack.9
Shifts into areas not covered by the litigation also represent unintended, adverse side effects. By applying only to US sales, and by excluding coverage of production for export sales, thus lowering the cost to the companies of exported cigarettes relative to cigarettes produced for domestic consumption, the MSA may have provided an incentive for participating firms to increase their exports, using excess existing capacity for production of exports in the face of declining domestic demand. The only stated requirement in the MSA for exports was the use of a distinguishing package from cigarettes sold in the USA.1
Those firms that chose not to join the MSA (non-participating manufacturers or NPMs) were required to place funds in state escrow accounts in reserve for future lawsuits,1,3 a provision designed to protect the participating firms and to provide an incentive for manufacturers to join the agreement. Provisions were included to discourage advertising and promotions aimed at youths. Other penalties included bad publicity from agreeing to settlement with the state attorneys general, both initially, and on an ongoing basis, and anti-tobacco advertisements sponsored by the American Legacy Foundation from MSA funds.
Our study assessed effects of the MSA and the four individual settlements on stockholder returns, operating performance of the defendant companies, growth of exports, impact on market share of the original manufacturers, and advertising expenditures.
METHODS
Financial data used to compute stock returns and investment value for each company were accessed from the Center for Research in Security Prices (CRSP) “Monthly Stocks” and “Daily Stocks” databases.10 CRSP stock return data include dividends, splits, and other distributions. We used all of the stock tickers assigned to tobacco manufacturers from 1990–2002: Philip Morris (MO), Loews (LTR, CG), Vector Group (VGR, BGL, LIG), RJ Reynolds (RJR, RN), and British American Tobacco (BTI). When tobacco manufacturers split from parent companies (RJR from RJR Nabisco and CG from Loews), we used the stock ticker for tobacco manufacturing.
We calculated aggregate market returns for tobacco companies and various indices from January 1990 to December 2002, based on an initial investment of $100, and alternatively, in 1999–2002. We created a comparative index based on returns from each other industry that the cigarette companies were involved in, a market capitalization weighted industry return, using all companies listed under the Standard Industrial Classification (SIC) code for that industry. The other industries most similar to tobacco were: food (SIC 2020, 2022, 2033, 2052, 2099, and 2651), beer (2082), spirits (2085), oil (1381 and 1389), financial (6331), hotel (7011 and 7832), watches (3873), and real estate (6211). The overall return for all other industries was calculated as a weighted average using the revenue shares of the industry to the cigarette industry as weights. Comparisons were also performed with other indices: S&P 500; a total index that encompasses the NASDAQ, AMEX, and NYSE; and the Russell 2000 (small cap index).
The tobacco industry investment value was weighted by each company’s percentage of total tobacco industry market value in 1990. When calculating the aggregate market return for RJ Reynolds, we started with a $100 investment in March 1991 due to the earlier leveraged buy out of the company by Kohlberg Kravis Roberts, which resulted in RJ Reynolds not being publicly traded in 1990 and early 1991.
Other data sources were newspaper articles, company 10-K reports submitted to the Securities and Exchange Commission (SEC), market share data from The Maxwell Report (Tobacco Reporter), policy reports from the US Department of Agriculture (exports) and the Federal Trade Commission (advertising), and review of journal articles. Using 10-K report data, we assessed profit and revenues in 2002 dollars for the domestic tobacco segment of Philip Morris and RJ Reynolds. Since Lorillard and Liggett did not have substantial foreign operations, we used the total tobacco segment financial data. We could not analyse revenue and profit for Brown & Williamson because the parent company, British American Tobacco, did not submit 10-K reports.
To calculate domestic unit sales using US Department of Agriculture data, we used values for US consumption, decreased by imports and adjustments (inventory change and unaccounted for). For market share, we examined the market share of original participating manufacturers (OPMs), which were Philip Morris, R.J. Reynolds, Lorillard, and Brown & Williamson. Liggett was excluded from this analysis since it was not an OPM, but was a subsequent participating manufacturer (SPM) in the MSA. Companies in the FTC advertising data were Philip Morris, RJ Reynolds, Lorillard, Liggett, Brown & Williamson, and Commonwealth Brands (discount manufacturer). Using data through 1998, trend lines (shown in figs 2–5) were estimated from an equation with an intercept and an explanatory variable for time in years; predicted values were generated for each year, 1999–2002, based on the results. To determine whether the differences pre- versus post-MSA were significant, we conducted t tests for the difference between actual and predicted values and post- versus pre-MSA values.
RESULTS
Financial viability: investments and operating results
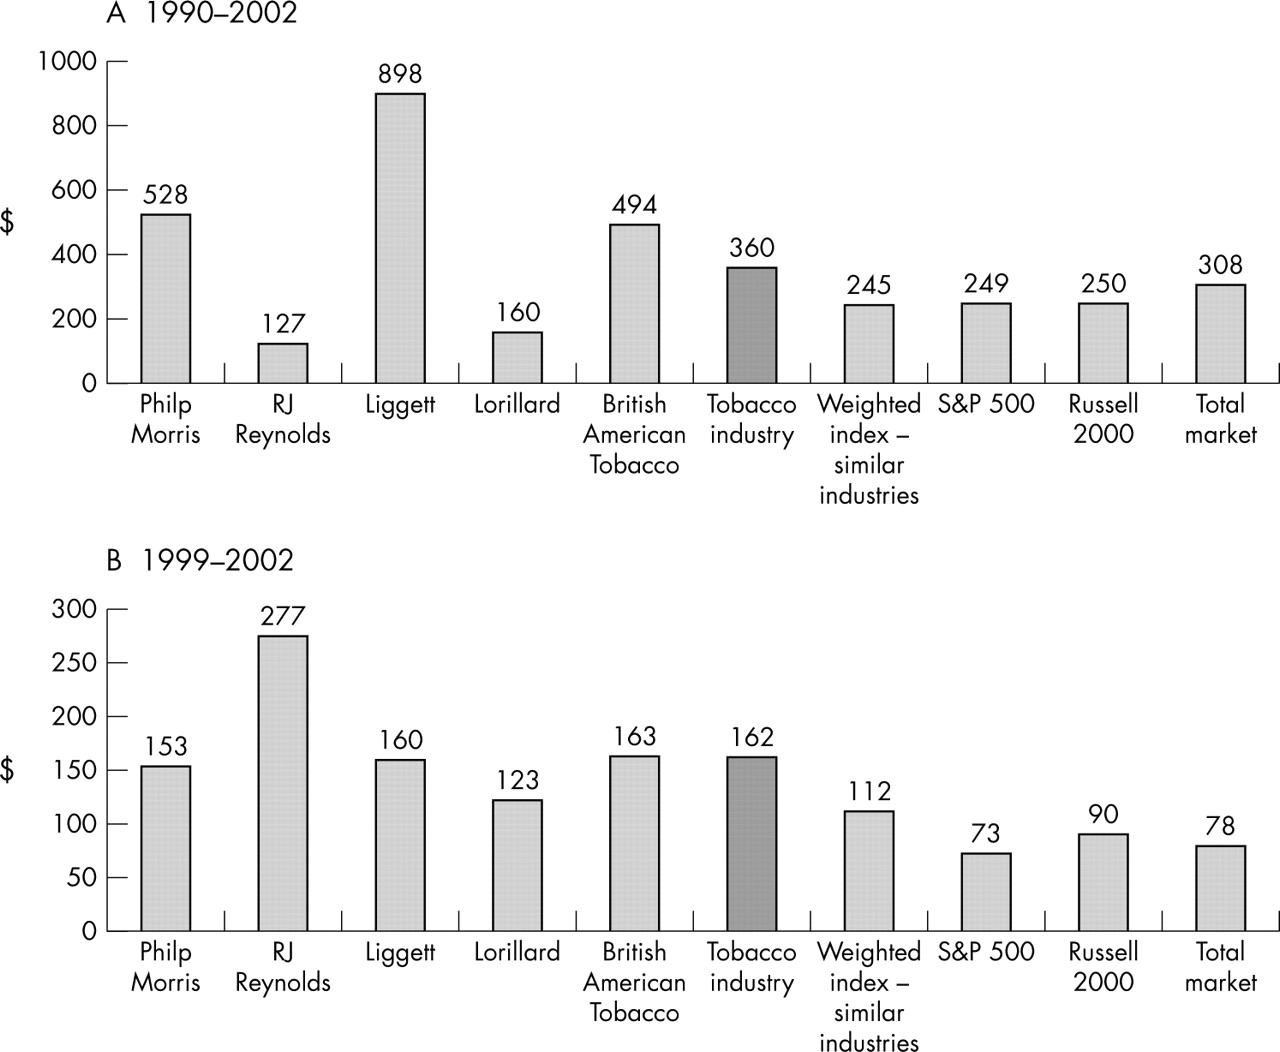
Relative to all four indices, investments in tobacco companies yielded higher returns to stockholders during 1990–2002 (fig 1, panel A). The value of a $100 investment in the tobacco industry by year end 2002 was $360, over $115 (47%) higher than an index of industries most similar to the tobacco companies. An equivalent investment in the S&P index would have yielded $249. The value of a $100 investment in 2002 was $308 for the total market (NASDAQ, AMEX, and NYSE) and $250 for the small-cap index Russell 2000. The value of a $100 investment in three tobacco companies exceeded S&P returns: Philip Morris ($528), Liggett ($898), and British American Tobacco ($494). For RJ Reynolds, the value of the investment ($127) was less than the S&P value during 1991–2002 ($240). Using a four year return for 1999–2002, an investment in tobacco at the beginning of 1999 yielded $162 by the end of 2002 (from $198 to $360). By contrast, the same investment in similar industries rose to $112 by the end of 2002 (from $223 to $245). By contrast, pre-MSA the increases were higher for the comparison companies ($100 to $223) than for the tobacco companies ($100 to $198). Returns for all of the other indexes were negative over this period.

Investment of $100. In panel A, the data point for RJ Reynolds is from March 1991–2002. Sources for both panels: Center for Research in Security Prices (CRSP), University of Chicago Graduate School of Business, NYSE daily and monthly master/returns file, 1990–2002. Sloan FA, Trogdon JG, Mathews CA. Litigation and the value of tobacco companies. Duke University Working Paper 2004. Yahoo Finance Research for Russell 2000. http://finance.yahoo.com [Accessed 14 November 2003].
Domestic tobacco revenues increased in 1999 and remained at a higher level during 1999–2002 than during the pre-MSA years (1990–1998) (2002 dollars, fig 2). There was a decline in 2002, which still was above revenue in 1998. Profits from domestic sales were flat from 1990–98; immediately after the MSA was reached, such profits rose to levels prevailing before 1997. During the post-MSA years, domestic tobacco revenues were above the trend line for 1990–98 projected through 2002. Profit post-MSA was above the trend line projected from the pre-MSA period.
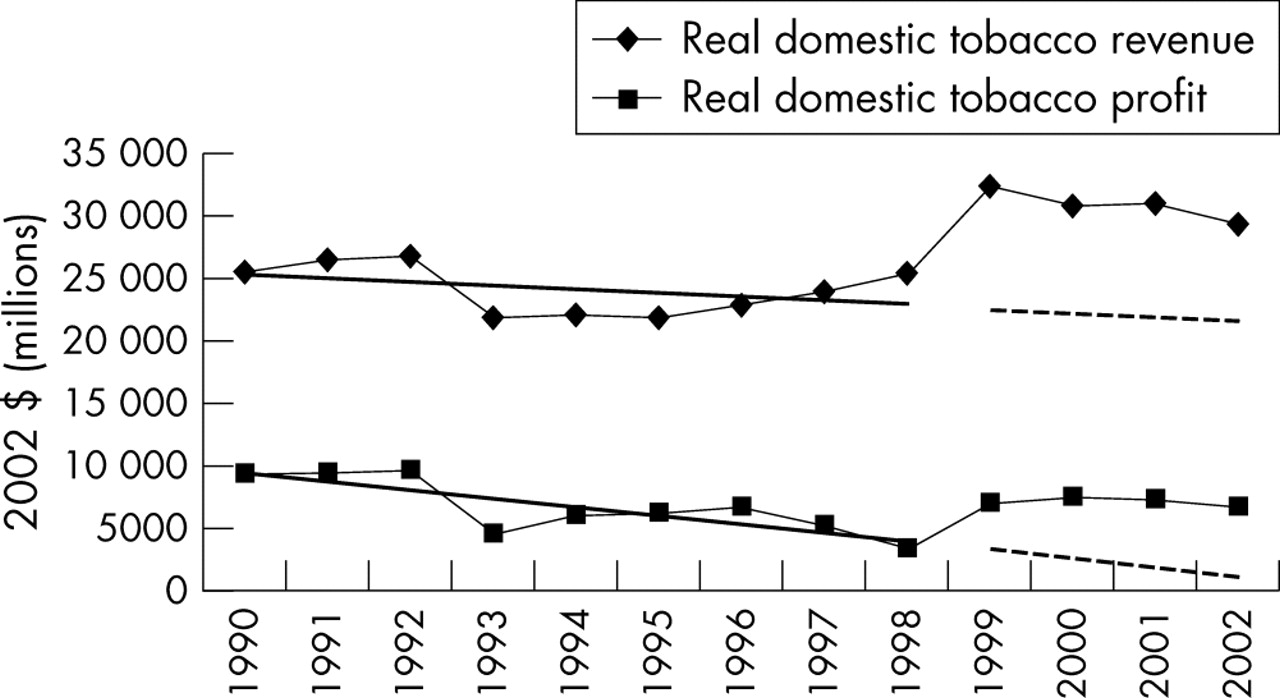
Revenue and profit from domestic tobacco sales (1990–2002). A t test for significance was conducted for revenue and profit for the following: (1) actual versus predicted for 1999–2002 and (2) actual pre- versus post-MSA. Revenue: p < 0.001 for both (1) and (2). Profit: p < 0.001 for (1) and p = 0.68 for (2). Source: Tobacco segment financial data from 10-K submitted to the US Securities and Exchange Commission: Philip Morris, RJ Reynolds, Lorillard and Liggett, 1990-2002. Domestic data were available for Philip Morris and RJ Reynolds. Due to the predominance of revenues in the domestic market for Lorillard and Liggett as cited in their respective 10-K reports, the total domestic revenues and profit data were used.
Declining domestic unit sales and exports
Post-MSA, domestic cigarette unit sales and exports declined (fig 3). Domestic consumption had been decreasing in the pre-MSA time period; a larger decline occurred in 1999, from 452 billion to 408 billion units. As would be expected, given the massive price increases after the MSA was implemented, in 2002, domestic volume had declined to 390 billion units and was below the trend projected from 1990–98. Unit exports decreased during the post-MSA period at a substantially greater rate than predicted from the 1990–98 trend line. The post-MSA export decline was from 1998–2002. Observed changes in exports in the post-MSA period reflected the MSA’s incentives as well as other factors affecting exports.

Sales in units: domestic and exports (1990–2002). A t test for significance was conducted for revenue and profit for the following: (1) actual versus predicted for 1999-2002 and (2) actual pre- versus post-MSA. Domestic: p = 0.004 for (1) and p < 0.001 for (2). Exports p < 0.001 for both (1) and (2). Sources: Capehart, T. Tobacco outlook. Washington DC: United States Department of Agriculture, Economic Research Service, TBS-254; 23 April 2003. Capehart T. Tobacco outlook. Washington DC: United States Department of Agriculture, Economic Research Service, TBS-255; 6 October 2003.
Market share of OPMs
Participating companies lost share in the total market to SPMs and NPMs after the MSA was reached (fig 4). The OPM market share was below the 1995–98 projected trend line post-MSA. We excluded data before 1995 because of a substantial increase in OPM share due to the acquisition of American Brands by British American Tobacco in 1994.

Share of total market: original participating manufacturers (1995–2002). A t test for significance was conducted for revenue and profit for the following: (1) actual versus predicted for 1999–2002 and (2) actual pre- versus post-MSA. Market share: p = 0.04 for (1) and p = 0.03 for (2). Sources: Maxwell Jr JC. Maxwell Report. Tobacco Reporter January 1991:28; March 1992:18–19; March 1993:12–13; March 1994:14–15; March 1995:12–13; March 1996:16–17; April 1997:22–28; May 1998:22–26; May 1999:22–32; October 2000:18–24; May 2001:22–28; September 2002:38–44; September 2003:28–36.
Shifting advertising dollars
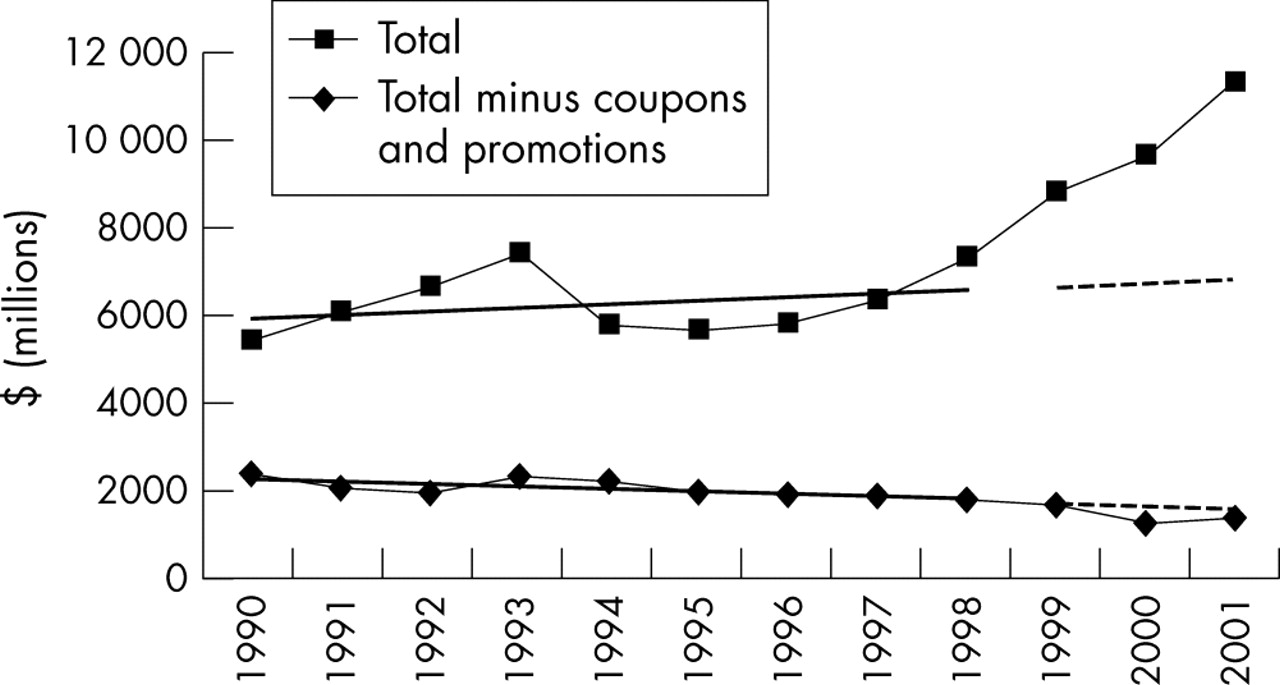
Total advertising spending has steadily increased since before the MSA (2002 dollars) (fig 5). Total advertising expenditures (2002 dollars) increased from $7.4 billion in 1998 to $11.4 billion in 2001 (54%). Excluding coupons and promotions from total advertising spending, which represented types of price decreases, real advertising expenditures decreased post-MSA. However, expenditures less coupons and promotions were very near the negative projected trend from 1990–98 data.
Advertising expenditures with and without coupons and promotions (1990–2001). A t test for significance was conducted for revenue and profit for the following: (1) actual versus predicted for 1999–2002 and (2) actual pre- versus post-MSA. Total: p = 0.05 for (1) and p = 0.03 for (2). Total minus coupons and promotions: p = 0.20 for (1) and p = 0.02 for (2). Retail value added is defined by the Federal Trade Commission as “all expenditures and costs associated with the value added to the purchase of cigarettes, including buy one get one free and buy one get x (promotional item) free”. This category is combined with coupons in the data with coupons being defined as “all costs associated with coupons for the reduction of the retail cost of cigarettes, whether redeemed at the point of sale or by mail”. Promotional allowances are defined as “allowances paid to retailers and any other persons (other than full time employees of the cigarette manufacturers) in order to facilitate the sale of any cigarette”. Source: US Federal Trade Commission. Federal Trade Commission Cigarette Report for 2001. Washington DC: Federal Trade Commission, 2003.
DISCUSSION
Overall, from 1999 through 2002, participating manufacturers maintained or improved performance in terms of investor stock returns and profit from domestic tobacco sales. However, these companies lost market share to SPMs and NPMs. Also, the decline in exports was not anticipated based on incentives of the MSA.
Prices of equity in a firm reflect investors’ expectations about the discounted value of future profits and the degree of uncertainty associated with these future cash flows. In settling the state litigation against the companies, the MSA increased the certainty of future profits, which risk adverse investors would value.
Several features of the MSA also potentially contributed to the companies’ future profitability. First, the MSA may have facilitated collusion in price. Experiencing a common “cost shock” from the MSA payment obligation, the companies could raise their selling prices of cigarettes with less fear of price cutting from their major competitors or from anti-trust scrutiny. Forward shifting is likely to be stronger in response to a federal (like the MSA) than to a state excise tax increase since there is a potential for cross border shopping for the latter.11
Second, given the addictive nature of cigarettes, Becker and Murphy explained that demand for cigarettes by persons who remained smokers after the price increase would plausibly be less price responsive.12 Becker and Murphy argued that in response to a cigarette tax increase, tobacco companies raise price by more than the tax increase to obtain maximum profit from smokers who are already addicted. Given the industry’s oligopolistic structure, national settlements involving the entire industry like the MSA can lead to an increase in profits in the industry.8,13 The MSA makes payments from tobacco companies a function of number of cigarette packs sold by the tobacco companies. In this sense, the MSA payment structure resembles an excise tax. With this market structure, firms optimally shift excise taxes forward to consumers. Price increases by more than the amount of the tax.14–17 Although higher excise taxes may cause higher tobacco company profits in the short run, in the longer run, profits may be expected to decline as the higher prices discourage young persons from initiating the habit.18 or premium producers lose market share.
If the MSA payments were imposed as an unanticipated lump sum penalty rather than as a payment per unit of domestic sales, the payments would have been borne by company owners. As structured, the MSA allowed for overshifting of payment in the form of substantial price increases. Although structuring the penalty as a lump sum obligation would have placed the burden on the owners of the companies, if the state attorneys general had not accepted a payment per unit formula, settlement negotiations may have stalled, with added litigation cost for both sides of the dispute, and with the added possibility that the states would have lost at trial.
The penalty for 1999 amounted to $0.40 per pack,19 including the cost of the four individual state settlements that were no part of the MSA. But price per pack rose by $0.73 between 1998 and 1999, a 29.7% increase for the year, most of which occurred in the month immediately following the MSA.9,20 The value of coupons and promotions also rose by $0.09 per pack, but net, there still was an increase of $0.64 in the per pack price of cigarettes in the USA.20,21 As a result, the companies remained profitable.
The fact that settlement discussions were widely known before the MSA implies that the MSA was not totally unanticipated by investors. To the extent that the payment was anticipated by investors in advance of November 1998, one would expect these anticipations to be reflected in bid prices for the equity in these companies. In fact, on the day the MSA was reached, stock prices of these companies surged, only to fall below the prices prevailing the day before the settlement on the next day.10
The counterfactuals in our calculations were performance of a diversified portfolio of equity in major companies (represented by a weighted index of similar companies, the S&P 500, the small-cap Russell 2000, and a total market index). Actual performance of individual stocks may have differed for many reasons, and we cannot eliminate the possibility that the value of these companies would have increased even more if the litigation leading to the MSA had not occurred.
But at least ex post, investors in the tobacco companies do not seem to have been harmed in a major way. Investments in tobacco companies were relatively profitable considering the periods 1990–2002 and 1999–2002. If tobacco company stock returns remain higher than those in other industries, then investors can be expected to continue providing capital to these firms.
Revenues from domestic sales of tobacco products increased after the MSA was reached, and profits from this source increased as well. Although overall domestic consumption of cigarettes decreased,22 the cigarette price increases more than offset such declines. These price increases reduced the market share of OPMs as price sensitive smokers moved to cheaper discount brands. Price increases reduced overall consumption, but also stimulated demand for these brands.23,24 The OPMs consequently lost market share to SPMs and NPMs, which primarily market discount brands. This shift is plausible in view of the substantial increase in cigarette prices. Elasticity of demand estimates in the literature25 are for the industry as a whole. Elasticities of demand for particular companies are likely to be substantially higher than the industry elasticity of demand. For this reason, the long run effect of the MSA over a decade or more may be less favourable to the companies than was the effect during the first four post-MSA years.
The reduction in the overall domestic consumption of cigarettes represents a success of the MSA.24 Domestic cigarette units had been decreasing, but a steeper decline occurred in 1999. Although the MSA may have helped to assure the financial viability of the major US tobacco manufacturers by increasing their profitability, in leading to lower cigarette consumption, higher cigarette prices have important public health benefits in their own right. Because the MSA did not regulate exports, manufacturers might have shifted their focus from domestic consumption to an increased presence in foreign markets through higher levels of exports.26 But exports declined post-MSA.
One reason is theoretical. Companies may be expected to profit maximise in both domestic and foreign markets. Any effect that the MSA has on profitability domestically should not generally affect decisions in foreign markets. However, in the short run, companies facing a decreased domestic demand may have had excess manufacturing capacity. Considering the short run marginal cost of cigarette manufacturing, there may have been a temporary incentive to boost sales to other countries. But this assumes that (1) the short run marginal cost curve for cigarette manufacturing is positively sloped, reflecting capacity constraints and (2) other countries were not also implementing tobacco control strategies. Given that there was no surge in demand before the date the MSA was implemented, it seems unlikely that the companies faced meaningful capacity constraints at that time. There was a decrease in cigarette use in some worldwide markets, in part due to implementation of additional tobacco controls (particularly in Europe).27,28
But globally, cigarette consumption continues to increase, in terms of amount of smokers and numbers of cigarettes.29 Also, for reasons unrelated to the MSA, the offshore strategy of US manufacturers is shifting cigarette production to foreign countries, which has reduced demand for exports. Tobacco companies have moved production offshore to take advantage of cheaper labour.29,30
To deal with exports, international regulation is required, as is now being attempted by the Framework Convention on Tobacco Control treaty.2 While it seems very unlikely that the MSA led to an increase in cigarette consumption in other countries, the negotiations preceding the MSA might have provided a format for discussing export issues.
To remain competitive, participating manufacturers used promotional deals, which in turn resulted in an increase in advertising and promotional expenditures. Discounting methods used by participating companies included lower invoice prices, promotions to retailers participating in manufacturer programs (for example, “Retail Leaders for Marlboro”), price reductions for wholesalers (allowing retailers to offer rebates to smokers) and buy-one-get-one-free deals.31–33 Both RJ Reynolds and Philip Morris continued to spend heavily on promotions to compete with discount brands, and in some cases reduced workforce in response to the low prices of discount manufacturers.34,35 Such discounting practices are not reflected in the Consumer Price Index (CPI) for tobacco products which rose substantially immediately after the MSA was reached and has continued to rise relative to the overall CPI subsequently—partly reflecting state excise tax increases implemented since 1998.36
Some pre-MSA strategies, such as brand sponsorships, were severely restricted or eliminated by the agreement. Advertising dollars once targeted to billboards and sponsored special events were now allocated to point of purchase advertising and promotions at retail stores, practices not strictly regulated by the MSA.37–44 Even with MSA restrictions, youth exposure to cigarette advertising in magazines is still an issue.42
Overall, the participating companies have lost market share since 1998. Even with increased coupons and promotions, the OPMs’ price increased notably. A decreased OPM market share was not anticipated by those who envisioned that the MSA would make entry more difficult, for one, because of the new advertising restrictions.
What this paper adds
The Master Settlement Agreement (MSA) and individual settlements ended lawsuits filed by the state attorneys general. Until recently, it was not possible to evaluate the effects of the settlements on company decision making because an insufficient number of years had elapsed since the MSA was reached in November 1998. Using data from five US based tobacco manufacturers during the years 1990–2002, this study indicates that the value of the companies increased after 1998. Ironically, the settlements may have improved the financial health of tobacco companies, and states have become financially dependent on the companies’ continued financial success. Litigation may be used to improve the public’s health; but by maintaining the company’s financial viability, this type of policy also assures continued sales of a harmful product.
Other potential factors that may have contributed to changes in the tobacco industry in the post-MSA period included legal decisions and other announcements that reported favourable impacts to the tobacco companies. Holding other factors constant, including announcements unanticipated by investors through 2003, one study found that the cost of capital to the companies fell post-MSA.43 The decreased cost of capital reflected lower (non-diversiable) risk from investments in tobacco companies that may reflect decreased volatility of profit due to their increased pricing power at least over the short and intermediate term.
Conclusion
Increasingly, litigation is being used to improve the public’s health.44 Lessons learned from the MSA experience can also be used in the ongoing US Department of Justice lawsuit against tobacco companies for their alleged conspiracy to mislead the public about health risks.45,46 Fast food companies are increasingly feeling public pressure for causing obesity, and are becoming subject to lawsuits for such reasons as misleading advertisements and targeting marketing efforts to children, two areas of emphasis in the tobacco litigation.47 This suggests that the MSA experience may be of more than historical relevance. The MSA did not eliminate cigarette use of the companies that manufacture them. The MSA was never intended nor expected to destroy the tobacco industry. But neither was it intended to improve company finances nor create stakeholders newly dependent on their continued financial success.
Acknowledgments
This research was supported in part by a grant from the Robert Wood Johnson Foundation administered by the Foundation’s Substance Abuse Policy Research Program.