Article Text

Abstract
Background New Zealand has a goal of becoming a smokefree nation by the year 2025. Smoking prevalence in 2012 was 17%, but is over 40% for Māori (indigenous New Zealanders). We forecast the prevalence in 2025 under a business-as-usual (BAU) scenario, and determined what the initiation and cessation rates would have to be to achieve a <5% prevalence.
Methods A dynamic model was developed using Census and Health Survey data from 1981 to 2012 to calculate changes in initiation by age 20 years, and net annual cessation rates, by sex, age, ethnic group and time period. Similar parameters were also calculated from a panel study for sensitivity analyses. ‘Forecasts’ used these parameters, and other scenarios, applied to the 2011–2012 prevalence.
Findings Since 2002–2003, prevalence at age 20 years has decreased annually by 3.1% (95% uncertainty interval 0.8% to 5.7%) and 1.1% (−1.2% to 3.2%) for non-Māori males and females, and by 4.7% (2.2% to 7.1%) and 0.0% (−2.2% to 1.8%) for Māori, respectively. Annual net cessation rates from the dynamic model ranged from −3.0% to 6.1% across demographic groups, and from 3.0% to 6.0% in the panel study. Under BAU, smoking prevalence is forecast to be 11% and 9% for non-Māori males and females by 2025, and 30% and 37% for Māori, respectively. Achieving <5% by 2025 requires net cessation rates to increase to 10% for non-Māori and 20% for Māori, accompanied by halving or quartering of initiation rates.
Conclusions The smokefree goal of <5% prevalence is only feasible with large increases in cessation rates.
- Disparities
- End game
- Public policy
- Cessation
Statistics from Altmetric.com
Introduction
There is growing international interest in decisively ending the tobacco epidemic. In New Zealand, the government has a goal of becoming a ‘Smokefree Nation by 2025’,1 and there is strong political interest in addressing the tobacco epidemic.2 Nevertheless, there is still a marked lack of detail around definitions, plans and processes to achieve this goal3 ,4 even while the government has continued to advance tobacco control. For example, in 2011, it introduced smokefree prisons nationwide; in 2012, a ban on displaying tobacco in retail outlets came into force; and from 2013, a new series of annual tobacco tax increases commenced.2 A particular driver around tobacco control in New Zealand is the need to reduce the health and economic burden for the Māori population (indigenous New Zealanders).5 Indeed, it was Māori politicians in the New Zealand parliament who played key roles in starting an inquiry2 that precipitated the adoption of the smokefree nation goal.
To inform considerations around achieving a smokefree nation goal it is useful to consider forecasting models for smoking prevalence. A previous New Zealand-specific tobacco use forecasting model6 was published prior to the goal being formulated. It indicated a reduction in smoking prevalence to 14.8% in 2031 for the business-as-usual (BAU) model. Another New Zealand model has suggested that BAU will result in a prevalence of 16.6% by 2025.7 Similarly, an Australian model reported 12% by 2030 for BAU,8 and for a model from another country with a smokefree goal (Finland) estimates were 20.7% for males and 17.5% for females by 2030 for BAU.9 However, social inequalities in projected smoking prevalences also warrant attention for two reasons. First, most countries have goals of reducing health inequalities, as well as improving average health status. Second, given the phasing of the tobacco epidemic that now sees smoking rates so much higher among socially disadvantaged groups (eg, greater than 40% in New Zealand Māori10), failing to understand and specifically address inequalities will result in failure to achieve overall goals such as a smoking prevalence of <5%.
To inform international considerations around the feasibility of smokefree nation goals and also to update New Zealand-specific endgame planning, we performed additional modelling to answer the following questions: (1) what will the smoking prevalence likely be in New Zealand in 2025, by sex and ethnicity, under current trends? (2) What combinations of annual decreases in smoking among 20-year-olds (ie, decreases in initiation) and increases in net annual cessation rates will be required to achieve the desired <5% smoking prevalence by 2025, by sex and ethnicity?
Methods
Unless stated otherwise, the modelling approach we used is as described in a published Australian model by Gartner et al.8 Here, we briefly overview the key features of that model, and emphasise the adaptations for this modelling study and the New Zealand input data (eg, ethnic group specific modelling). The method involved first establishing recent trends (base model), then using outputs from this base model for the most recent time period 2002–2011 as inputs for future ‘BAU’ projections (forecasting model). We also compared base model outputs with initiation, cessation and relapse rates from a New Zealand panel study.
Base model
The two main outputs of the base model were: annual percentage decrease in smoking prevalence in 20–24-year-olds (to approximate trends in initiation); a net annual cessation by sex by age group, which is the net of successful quit attempts and relapse. These outputs were estimated using the Solver optimisation tool (GRG non-linear method selected) in Microsoft Excel, with the following inputs and data structure: (a) starting population of the 1981 census (which includes smoking status); (b) number of births by sex from 1981 to 2012; (c) annual ‘year of age’-specific probabilities of dying, from life-tables; (d) current, never and ex-smoker prevalence data (1981 census, then 1992–1993, 1996–1997, 2002–2003, 2006–2007 and 2011–2012 New Zealand Health Surveys); (e) NZ Census-Mortality Study (NZCMS) estimates of smoker relative risks for mortality. As such, this was largely a replication of the Australian model,8 and likewise did not allow for future migration patterns.
Regarding the smoking prevalence series, occasional New Zealand censuses (1981, 1996, 2006 and 2013) have collected information on smoking which has provided precise prevalence data for all demographic groups. At the time of the modelling, 2013 census data were not available. Thus, trends in the smoking prevalence in 20–24-year-olds, and adult net annual cessation rates, from 1996 onwards were driven solely by the difference between the 1996 and 2006 censuses. We decided that such reliance on just the 2006 census for the last 15 years of trends was inappropriate, particularly in light of 10% per annum tobacco tax increases since 2010 and other interventions (on-going mass media campaigns and prohibition of tobacco displays in retail outlets in 2012). Hence, we used the New Zealand Health Survey series for 1992–1993, 1996–1997, 2002–2003, 2006–2007 and 2011–2012. The prevalence of smoking between census and survey years was estimated with linear interpolation. For smoking-specific death probabilities, we mathematically combined life-table mortality rates, smoking prevalence and NZCMS relative risks to generate smoking-specific mortality rates and risks of death.
A Markov process was used to estimate the population counts by sex, single year of age and calendar year post-1981, parameterised in terms of annual (smoking-specific) mortality rates and annual cessation (ie, transition probabilities from current to ex-smoker). The model was then ‘solved’ by optimising the net annual cessation (by sex, by 20–34, 35–54 and 55+ year age groups, and three time periods 1981–1992, 1993–2001, 2002–2011) that minimised the squared difference in estimated population size compared to census population counts and census/survey smoking prevalence (with the survey estimates weighted by the inverse of their variance). Uncertainty in annual cessation rates (ie, 95% uncertainty intervals (UI)) were estimated with Monte Carlo simulation, as described by Gartner et al,8 using the Ersatz add-in (http://www.epigear.com).
There was one methodological adaptation for New Zealand, the inclusion of ethnic-specific mortality rate ratios for current versus never, and ex-smokers versus never-smokers. These were derived from NZCMS data as explained in the Appendix. Sensitivity analyses were conducted with Cancer Prevention Survey II (CPS II) rate ratios.
Smoking transition probabilities from a panel survey: validation study
The Survey of Family, Income and Employment (SoFIE)-Health is a panel survey of approximately 20 000 adults from 2002 to 2010. It includes questions on smoking at annual waves 3, 5 and 7, allowing a unique opportunity to directly observe initiation and cessation rates in addition to inferring them based on modelling above. Details about the SoFIE cohort study are published elsewhere.11 In this paper, we simply calculate the proportion over 4 years (and thence annual rates) of current smokers becoming ex-smokers (‘true’ cessation rate), and proportion of ex-smokers who become current smokers (relapse rate). We then calculated the ‘net annual cessation rate’ as per the model above for each sex, age (20–34, 35–54, 55+) and ethnic group as follows: where m is the sex by ethnic by age-group, and N comes from the 2006 census data (not SoFIE data which may differ in proportion distribution from the census). These were then compared to outputs from the base model, in particular, regarding patterns of differences in net annual cessation rates by demographics, and used in sensitivity analysis. Note, that with initial non-response and attrition that is inevitable in a panel study, about 50% of all eligible participants remained in SoFIE at the final waves. Furthermore, we expect these people to be ‘health selected’ (participants are healthier and more health conscious), meaning we expect their net annual cessation rates to be higher than the population of smokers at large.
Forecasting model
The forecasting model projected smoking prevalence from 2011 to 2061 using the above derived initiation rate changes (ie, annual percentage change in smoking prevalence in 20–24-year-olds) and annual cessation rate changes. All forecasting used the New Zealand smoking rate ratios (ie, current and ex-smokers versus never-smokers, by ethnicity) and mortality rate projections as explained above in the baseline model. Estimates of future births by sex, by ethnicity, by year, were derived from Statistics New Zealand projections, assuming median rates of fertility, migration and improvements in life expectancy.
For the BAU scenario, we assumed that the base model trends in initiation and cessation for 2002–2011 would continue. We then evaluated a range of scenarios to determine what changes in initiation and cessation would be required to reach the 2025 goal of <5% smoking prevalence. The scenarios included halving or quartering of the current initiation and annual increases in cessation of between 2.5% and 20%.
Results
Baseline model output
It is useful to first consider the smoking prevalences in 20–24-year-olds from the 1981 census and subsequent surveys as shown in figure 1. The survey data points have wide 95% CIs (error bars), especially for Māori, due to small numbers once restricting to this narrow age range and then stratifying by ethnicity. The target parameter for the model is the percentage change in this prevalence, by time period, approximated by the slope of the dotted lines in figure 1. Table 1 gives the model outputs. For 2002–2011 among non-Māori, the annual percentage decline in male prevalence is 3.1% (95% uncertainty interval 0.8–5.7%), greater than the 1.1% (−1.2% to 3.2%) for females, and consistent with the steeper slope for non-Māori males in figure 1. Comparatively, the decrease was slightly higher in Māori males at 4.7% (2.2–7.1%) but almost zero in females (−2.2% to 1.8%). However, uncertainty intervals overlap.
Outputs from baseline model for various demographic groups over time—net annual cessation rates and annual percentage changes in 20–24-year-old current smoker prevalence (reflecting initiation levels) for non-Māori and Māori

Smoking prevalence in 20–24-year-olds from 1981 census, and subsequent health surveys, by ethnic group and sex. Dotted lines represent linearly interpolated smoking prevalences by the three time periods.
The annual net cessation rates by time period, sex, ethnicity and age are also shown in table 1, and for 2002–2011 ranged from 3.2% to 6.1% for non-Māori with a suggestion of higher cessation rates for older females—but again there was considerable overlap in most uncertainty intervals. For Māori, the cessation rates were generally lower than those of non-Māori (range 0.6–5.8%), with the higher values among older females. Disregarding time periods, averages over time (final columns of table 1) clearly show higher net cessation rates with increasing age for both sexes, and (usually) lower cessation rates for Māori within each sex by age group consistent with higher smoking prevalences in the general population for Māori.
Sensitivity analyses using smoking relative risks from the US CPSII, and not altering time trends in smoking relative risks, made negligible differences to the estimated net cessation rates in the baseline model (see online supplementary table S1), except for older Māori males where the use of CPSII risks led to a negative result for the net cessation parameter (ie, relapse exceeds quitting).
Validation from the panel survey
Table 2 shows the cessation and relapse transition probabilities directly ascertained from individual-level transitions in the SoFIE-Health panel study. The SoFIE-Health-derived net annual cessation rates were higher than those from the dynamic model for Māori, particularly for younger and older Māori males (ratios in square brackets in table 2 usually greater than 1.0), although imprecision in estimates must be noted. Agreement between the cessation rates in SoFIE and those from the dynamic model was closer for non-Māori.
Transition percentages and net annual cessation rates (95% UI) from the panel survey (SoFIE-Health) used in the sensitivity analysis
Forecast models
Figure 2 shows the BAU forecast of future smoking prevalence, using the decrease in initiation and net cessation parameters from 2002 to 2011 in table 1. The <5% prevalence goal is not attained by any group, with prevalences in 2025 of 10.7% (UI 9.5–12.1%) and 8.8% (7.8–10.1%) for non-Māori males and females, respectively, and 30.0% (25.2–35.6%) and 37.3% (33.2–42.0%) for Māori. Put another way, the <5% goal would eventually be achieved by about 2050 for non-Māori, and sometime beyond 2060 for Māori. Using the initiation and cessation parameters from the SoFIE-Health panel study (table 2) slightly improved projections of tobacco prevalence by 2025: 8.8% (7.2–10.8%) and 9.2% (7.6–11.2%) for non-Māori males and females, and 20.6% (13.1–33.4%) and 33.2% (25.3–42.8%) for Māori (see online supplementary table S2).
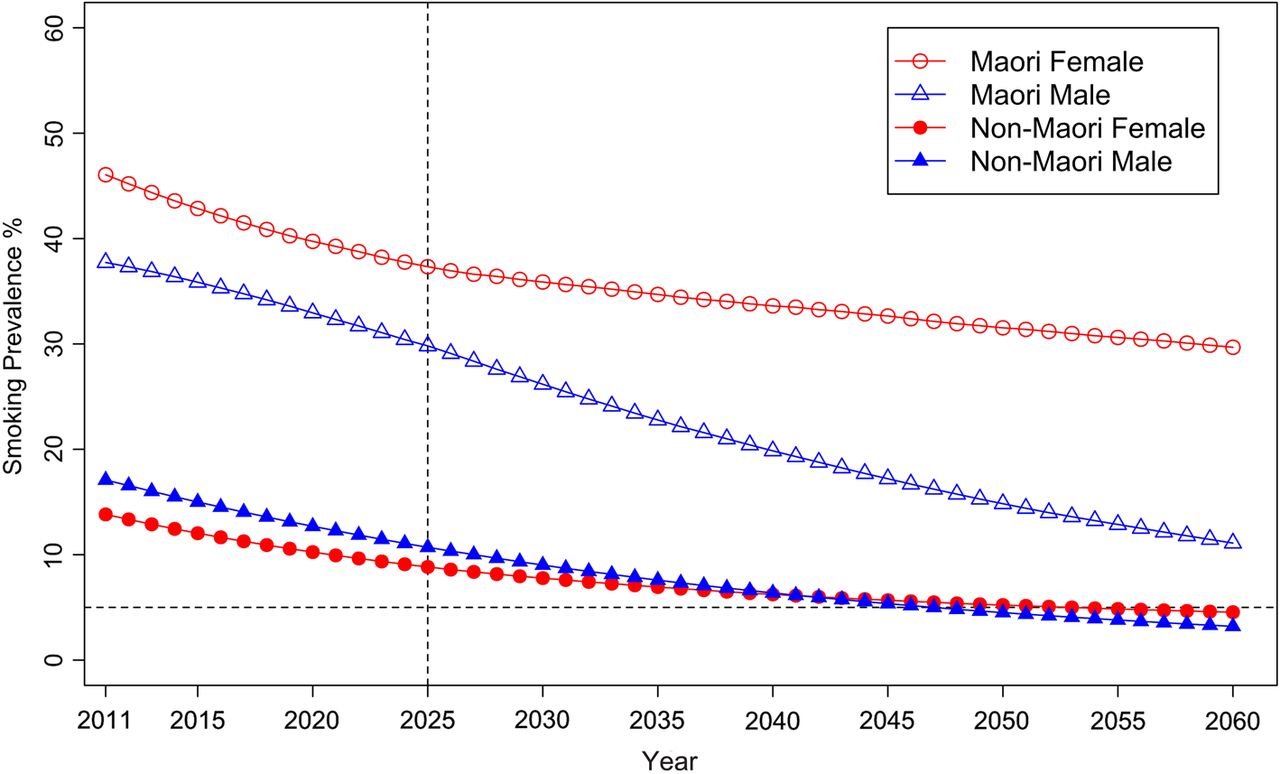
Business-as-usual forecast of smoking prevalence for Māori and non-Māori, by sex, using change in initiation and net cessation parameters for the 2002–2011 time period from the baseline model.
Figure 3 shows forecasts by ethnicity for sexes combined, for the BAU forecast plus a range of scenarios that involve combinations of decreases in smoking prevalence in 20-year-olds (equivalent to smoking uptake) and increases in net annual cessation at older ages. These changes included a halving or quartering of smoking prevalence in 20-year-olds every 10 years from 2011 (equivalent to 6.7% and 12.9% per annum reductions in smoking prevalence in 20-year-olds, respectively; ie, (1−0.067)10=50% and (1 − 0.129)10=25%); and net cessation rates of 2.5–15% (non-Māori) or 20% (Māori). Note that for these latter net cessation rates, we now ignore the BAU parameters (ie, those for 2002–2011 in table 1, and apply the same cessation rate (ie, 2.5%, 5%, …, 20%) per annum to sex by age by ethnic groupings.

Forecast of smoking prevalence (sexes combined) for business-as-usual and other scenarios
Achieving a smoking prevalence of <5% by 2025 for non-Māori would require increasing net annual cessation rates to about 10%, approximately doubling or tripling current net cessation. The marginal gains from reducing initiation rapidly (ie, halving every 10 years) to very rapidly (ie, quartering every 10 years) are small in comparison with the gains from increasing net cessation of adults.
For Māori, this modelling suggests that it will take 20% annual net cessation rates across all adult age groups to achieve a <5% prevalence by 2025. This requires a large shift from the −3.0–5.8% range of net cessation rates for Māori in the baseline model for 2002–2011 (table 1) or the 3.0–6.0% range observed in the SoFIE-Health panel (table 2). Relaxing the target year to 2030 for Māori, a 15% per annum net cessation rate would achieve the target if accompanied by a quartering of smoking prevalence in 20-year-olds every 10 years.
Discussion
Projecting to 2025 under a BAU scenario, we estimated an 11% and 9% smoking prevalence for non-Māori males and females, and 30% and 37% for Māori males and females. Achieving <5% smoking prevalence by 2025 appears feasible, but will require sizeable increases in cessation among non-Māori (approximately 10% per annum), and large increases for Māori (approximately 20% per annum), in both instances accompanied by strong reductions in initiation. This will require either substantially intensified existing approaches (eg, especially those to support Māori with quitting) and/or adopt major new endgame approaches (see below). The overall package would probably have to be substantially greater than the ‘MPOWER’ package of interventions modelled for Finland (SimSmoke model), another country with a national smokefree goal. In this model, smoking prevalence in males was forecast to decline from 25.2% to 14.5%, and for females from 18.6% to 12.5%, between the years 2010 and 203012). A setting with similar initial prevalence levels to New Zealand is Minnesota for which other SimSmoke modelling work has also been done. Modelling a package of tobacco control interventions produced forecasts of prevalence in males declining from 17.0% to 12.1%, and for females from 15.1% to 11.6% (from 2011 to 2031).12 Nevertheless, the intervention packages used in these SimSmoke models include elements that are already in place in New Zealand, suggesting intensified tobacco control is required in New Zealand to achieve the 2025 goal.
This study is one of the first to model future trends in smoking in a country that has adopted a government-level smokefree nation goal. The modelling also benefits from incorporating detailed sex-specific and ethnic-specific data from censuses and national health surveys, and a set of validation estimates from a large New Zealand panel study following the same individuals over time (ie, more detailed than previous New Zealand modelling6 ,7). However, the most recent 2013 census data was not available at the time of our modelling; repeated modelling once it is available is warranted, and BAU parameters may be sensitive to including this full population dataset, especially in light of recent impositions of the annual 10% excise tax hike. The model also does not capture smoking intensity or time since quitting, both of which are important factors in tobacco control, although the smokefree goal has been interpreted in terms of a target prevalence. The exact annual cessation rates and annual changes in smoking prevalence in 20-year-olds were measured with imprecision in our baseline dynamic modelling and the panel study, but the ‘sets’ of estimates gave roughly similar future BAU projections (figure 2, and see online supplementary table S2). For example, the higher cessation rates from the SoFIE panel study (which we believe are likely to be overestimates due to attrition, but nevertheless do provide individual-level repeated measures data for sensitivity analyses) do not markedly reduce the projected prevalences by 2025.
The BAU analysis and projections incorporates tobacco control activities that influenced recent trends in tobacco prevalence, and simple secular trends in smoking behaviour. Tobacco control policies of note in New Zealand in recent decades include increases in tobacco tax, smokefree environment laws, pictorial health warnings on packs, various social marketing campaigns and enhanced quitting services (especially the Quitline). A major assumption, therefore, of our BAU forecast is that the mix of future tobacco control policies and secular trends will continue with correspondingly similar initiation and cessation rates. But most importantly, modelling of what levels of reduction in 20-year-old smoking and increases in annual cessation rates would be required to achieve the 2025 goal unequivocally (figure 3) demonstrate that an order of magnitude changes in these parameters are needed—not tinkering at the margins. Thus, we may have uncertainty about our BAU forecast, but we are fairly confident that it falls short of what is needed to achieve 5% by 2025.
What tobacco control actions might achieve these ‘order of magnitude changes’ necessary to achieve such tobacco endgame goals? One approach is for countries with such goals to continue to intensify well-established evidence-based tobacco control interventions. These include further tobacco tax increases. New Zealand has recently implemented four annual 10% tax increases (above inflation adjustments) for 2010–2013, inclusive. In a parallel publication to this paper, we have found that annual 10% increases in tobacco tax out to 2025 may be a sufficiently strong policy to achieve the 2025 goal for non-Māori, but that perhaps 20% annual increases may be needed if the goal is to be reached for Māori.13 Enhanced mass media campaigns could also play an important role as these are often currently run at fairly minimal levels in most countries (as is the case in New Zealand14). To maximise the simultaneous reductions for population groups with the highest smoking rates (such as Māori in New Zealand) there could be supplementary interventions. For example: (1) intensive mass media campaigns (as per those designed for a Māori audience15 ,16); (2) expansion of smokefree area policies of particular relevance to deprived and ethnic communities and (3) enhancing intensive smoking cessation support that is targeted and culturally appropriate. For those countries with indigenous politicians, it will be important that they are also key leaders in tobacco control policy at the national and local level (a process which has certainly been critical in the New Zealand setting).
However, other than sustained sizeable annual tax increases, it seems unlikely the intensified BAU tobacco control will be sufficient to achieve the 2025 goal. If sustained tax hikes are either not politically feasible or appear to be going to fall short, then more novel endgame-specific interventions will need to be the major strategies being focused on. Examples include a sinking lid on tobacco supply,17 a phase-down of nicotine levels in tobacco products to subaddiction levels,18 smokeless tobacco,19 and a smoker's licensing system20 (see the May 2013 Supplement of Tobacco Control: http://tobaccocontrol.bmj.com/content/22/suppl_1.toc). These strategies could be assisted with other changes, such as plain packaging of tobacco products, removal of additives that may make smoking more attractive (menthol and sugars, etc), and also changes to the ‘nicotine market’. The latter includes the availability of alternative nicotine delivery devices, potentially available at relatively lower tax rates relative to current cigarettes. However, this involves a complex mix of potential benefits and harms and so might need more research and also a tight legal context to minimise any such harms (eg, limits on marketing, electronic nicotine delivery systems covered by existing smokefree laws, and even a sunset clause that makes their sale illegal 5–10 years after smoked tobacco sales become illegal).
Of more direct relevance to this paper, we need to know what combinations of current and ‘novel’ tobacco control interventions will actually achieve a 10–20% annual cessation rate, and a quartering to halving of initiation. This type of research is an emerging priority for informing the endgame. In particular, we need ‘early warning’ research as to whether sustained tax hikes as the main policy mechanism are likely to be sufficient to achieve the 2025 goal, and if not, then we need the political will and leadership to put in place more novel or radical policies. In the meantime, as a research community, we need to improve the theoretical and empirical evidence base about novel or radical strategies.
What this paper adds
-
Previous modelling has forecast future prevalence for various countries under business as usual. This paper models what it would take in the way of initiation rates and cessation rates to achieve a 5% prevalence by 2025—the New Zealand Government's tobacco-free goal.
-
Increased cessation rates are essential to achieving a <5% prevalence. For European/Other people, annual cessation rates need to be about 10%—double to quadruple what they currently are. For Māori, cessation rates need to increase hugely to 20% per annum of smokers stopping. Increasing the rate of fall in initiation helps, but is not as critical as increasing cessation.
-
Intensified business as usual tobacco control seems unlikely to be sufficient to achieve the 2025 goal. Hence supplementary interventions are needed, especially to increase cessation rates in targeted population groups with high smoking rates.
References
Supplementary materials
Supplementary Data
This web only file has been produced by the BMJ Publishing Group from an electronic file supplied by the author(s) and has not been edited for content.
Files in this Data Supplement:
- Data supplement 1 - Online appendix
- Data supplement 2 - Online tables
Footnotes
-
Contributors TI led the writing of the first draft of the paper, and led all analyses. LC, NW and TB contributed to study design, interpretation and drafting of the paper. KC undertook the panel study analyses, and contributed to drafting of the paper.
-
Funding Jan Barendregt provided advice on the dynamic model. The authors are supported by the Burden of Disease Epidemiology, Equity and Cost Effectiveness programme (BODE3) Programme which is studying the effectiveness and cost effectiveness of various tobacco control strategies and receives funding support from the Health Research Council of New Zealand (Project number 10/248). No ethics approval was required, as the study uses only secondary data.
-
Competing interests None.
-
Provenance and peer review Not commissioned; externally peer reviewed.
-
Statistics New Zealand Security Statement Access to the SoFIE-Health data used in this study was provided by Statistics New Zealand in a secure environment designed to give effect to the confidentiality provisions of the Statistics Act, 1975. The results in this study, and any errors contained herein, are those of the author, not Statistics New Zealand.