Article Text

Abstract
Objective To determine if a low-cost particle counter, the Dylos DC 1700, can be used in homes to quantify second-hand smoke (SHS) concentrations.
Methods Participants were recruited from a hospital-based study of attitudes on smoking. Two photometric devices (Dylos DC1700 and Sidepak AM510 Personal Aerosol Monitor) capable of measuring and logging concentrations of particulate matter were placed in smoking and non-smoking homes for approximately 24h. Acquired data were randomly allocated to one of two groups: one was used to generate a calibration equation using regression techniques; the second was used for validation of the generated model. The mean difference and limits of agreement between the two instruments were calculated using the validation dataset. Summary air-quality results were also compared across the entire dataset.
Results Over 500 001 minute concentration measurements were collected from 34 homes. 25 301 randomly selected paired-measurements were used to generate a calibration equation (R2 0.86) converting the particle number concentration from the Dylos to a mass concentration of PM2.5 as measured by the Sidepak. The mean difference (limits of agreement) between the remaining 25 102 paired measurements was −0.09 (−49.7 to 49.5) with 3.2% of values outside the limits of agreement. Differences in the air quality information generated by the two instruments were generally small and unlikely to impact on user interpretation.
Conclusions The Dylos appears to be a valid instrument for measuring PM2.5 in household settings. The Dylos may be useful in air quality-based interventions designed to change smokers’ behaviours with the possibility of encouraging cessation and/or smoke-free homes.
- Secondhand smoke
- Surveillance and monitoring
- Prevention
Statistics from Altmetric.com
Introduction
Second-hand tobacco smoke (SHS) is a mixture of particle phase and gaseous compounds that are associated with a wide range of ill-health outcomes in those exposed.1 ,2 Over the past two decades, measurement of fine particulate matter of diameter less than 2.5 microns (PM2.5) has been commonly used as a marker of SHS concentrations in air.3–5 PM2.5 is generated by the incomplete combustion of tobacco, and its use as a marker has enabled the public health community to communicate indoor SHS concentrations using a health-based metric that is also widely used for outdoor or ambient air pollution. Many studies have used the US Environmental Protection Agency (EPA) air quality index value for PM2.56 (>35 μg/m3 over a 24 h period is ‘unhealthy for sensitive groups’) to place indoor SHS levels in the context of air pollution.7 ,8 More recently, the WHO declared that their outdoor air quality guidance limit for PM2.5 (25 μg/m3 over a 24 h period) can also be applied to indoor environments9 and this further extends the possibility of communicating the health harms from PM generated from tobacco smoke.
Estimates suggest that between 80% and 90% of cigarette smoke is invisible to the human eye10 and often smokers are unaware of the concentrations of smoke generated by their activity with many considering that opening a window or lighting candles reduces the level of SHS in their home.11 Previous work from our group has explored the use of air quality information as an educational tool to help motivate smokers to change their smoking behaviour.12 Smoking mothers, involved in the REFRESH (Reducing Families’ Exposure to Second Hand Smoke and Health) study, reported ‘shock’ at the levels of PM2.5 measured in their home with some reducing their smoking and/or taking steps to reduce the SHS of their children within the home.11 The REFRESH study used the Sidepak AM510 Personal Aerosol Monitors (TSI, Minnesota, USA) to measure and log household PM2.5 concentrations.13 The Sidepak device is primarily designed to measure occupational exposures to fine dust and is costly (>£2500), noisy and requires some degree of training to operate: factors that make their use in home-based interventions difficult.
On completion of the REFRESH study, we identified a less costly (£300), quieter and much simpler to operate air quality monitor called the Dylos DC1700 (Dylos, California, USA). Initial pilot work to test the response of this lower-cost device within a controlled chamber environment produced evidence of a strong relationship between the particle number concentrations measured and the mass concentration of PM2.5 as recorded with a Sidepak device.14 We concluded that this instrument had the potential to be used in homes to quantify SHS concentrations, and that further investigation of the performance in real-life settings was required to take forward the use of the device as an educational tool to change smokers’ behaviours. This paper examines the results from the use of the Dylos DC1700 when used contemporaneously with a TSI Sidepak AM510 instrument in a selection of smoking and non-smoking homes in Aberdeen, Scotland. The data are used to compare both absolute values of PM2.5 and also the summary values that we propose to use in providing smokers with personalised air quality information.
Methods
Study design and recruitment
Participants were recruited from the ‘Smoking habits of parents of children attending Royal Aberdeen Children's Hospital (RACH)’ study. This was a questionnaire study of parents who attended the outpatients clinic at the main children's hospital for the northeast of Scotland during June and July 2012. Those who completed the questionnaire and who responded positively to the option to have the air quality measured within their home were eligible for recruitment to this part of the work. Ethical approval for the study was granted by the North of Scotland Medical Ethics Committee. Written consent was obtained from all those who participated.
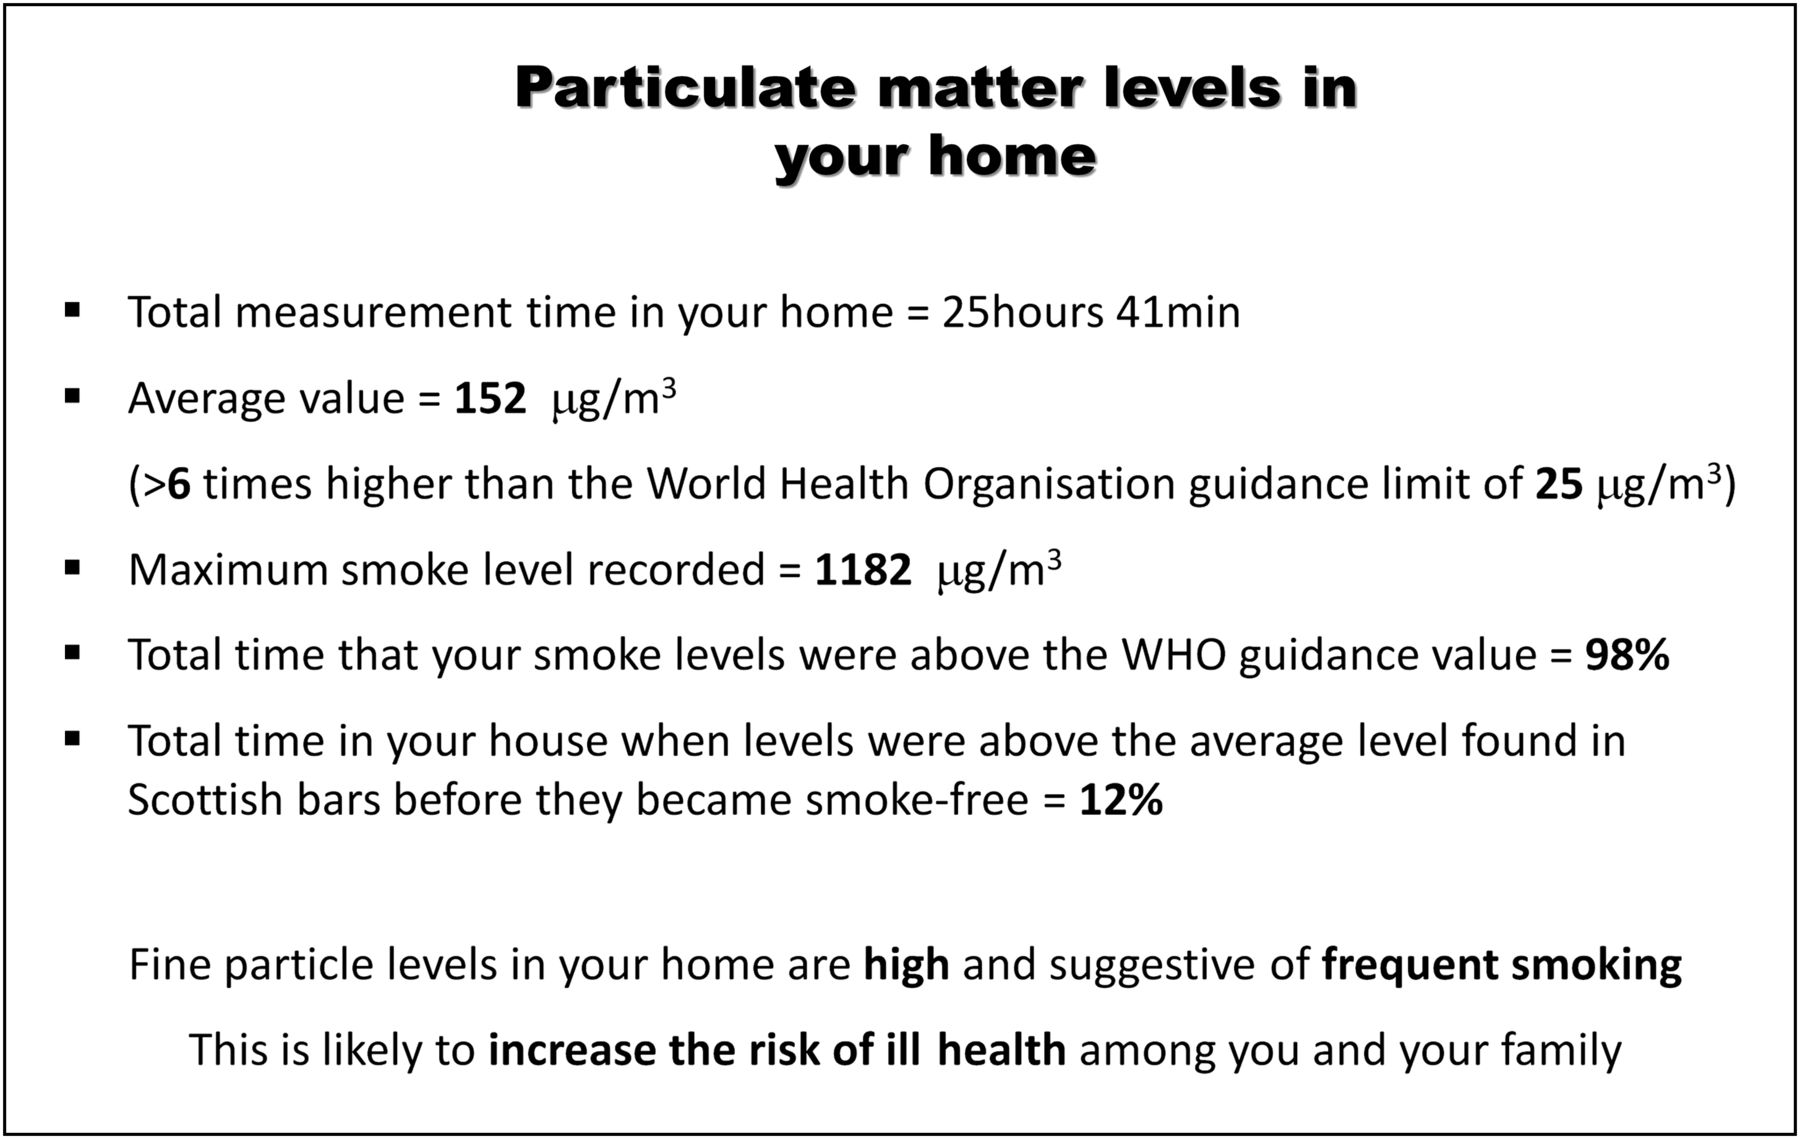
Participants who had indicated interest were contacted by telephone, and further information on what the measurement process involved was provided. Households with an open fire where wood, coal or peat was used to heat the home were excluded. We wished to have an approximately equal number of smoker and non-smoker homes, and where we recruited a smoking home we then contacted one of the non-smokers from our list from within the same four-digit postcode area (three-digit matching was only possible for three homes) in order to approximately match for socioeconomic conditions. Non-smoking homes were defined as those without a resident smoker. A researcher (AEI) visited the home and set up the two particle measuring instruments (see details below) within the main living area of the home. Devices were colocated and positioned at approximately 1 m height and, where possible, away from doors, windows and possible sources of PM such as candles. Both instruments were set to log, and participants were asked to continue with their normal daily activity. Devices were collected approximately 24 h later. Data were downloaded on return to the office and the time-concentration plot generated by the Sidepak instrument, together with summary statistics of the measurements (time-weighted average, maximum, percentage of time PM2.5 exceeded two threshold values: the WHO PM2.5 guidance, and an arbitrary value of 246 μg/m3 which was the average level measured in Scottish bars prior to smoke-free legislation)15 was sent by post to each participant household. Air sampling took place between 27th July and 28th September 2012.
Instruments
Details of the two instruments used to measure SHS levels in the homes are provided elsewhere.14 In summary, the Dylos 1700 uses a laser light-scattering technique to measure the number of particles in two particle size ranges: >0.5 μm and >2.5 μm; with the number of particles between 0.5–2.5 μm calculated by subtracting the latter from the former. The Dylos logs the number of particles every minute and data can then be downloaded using proprietary software Dylos Logger (V.1.60). Particle counts are expressed as a concentration per 0.01 cu ft of sampled air. The TSI SidePak AM510 device draws air through a size-selective PM2.5 impactor and uses a laser light scattering technique to quantify and log airborne concentrations of particulate matter every minute expressing the output in mg/m3 with a sensitivity down to 0.001 mg/m3. The Sidepak device can be internally calibrated for the characteristics of any type of aerosol and we have used a calibration factor of 0.29515 ,16 for SHS and other household PM2.5 aerosol. At the start of each sampling session the Sidepak was zero calibrated using the manufacturer supplied High-Efficiency Particulate Air (HEPA) filter and had clean grease applied to the impactor. The flow rate was set to 1.7 l/min. Logged data were downloaded using the TSI TrackPro software (V.4.4.0.5). Three Dylos and four Sidepak instruments were used over the course of the study. Two Dylos-Sidepak pairs were used for the majority of homes (n=28) with two further pairings used for three homes each.
Statistical analysis
The data from each instrument was exported from the proprietary software via Excel into SPSS and STATA V.12 for further analysis. The 1 min data pairs (n=50 403) from across all households were randomly assigned to either a calibration dataset (n=25 301) or a validation dataset (n=25 102). The Dylos particle count for particle sizes ≤2.5 μm was calculated subtracting the >2.5 µm fraction from the total count number for particles >0.5 µm. The inspection of the data suggested a non-linear, quadratic relationship and regression analysis was performed on the calibration dataset using the Sidepak PM2.5 value as the dependent variable and the Dylos particle count (>0.5 μm—2.5 µm diameter) and its square as independent variables. The resulting quadrilateral equation was applied to all Dylos data to produce an estimated mass concentration for each minute of sampling. A Bland–Altman analysis17 was then performed to examine the degree of agreement between the Sidepak PM2.5 measurements and the Dylos-generated PM2.5 mass concentration estimate in the validation dataset. A final analysis involved comparing the air quality information for each home that had been created using the Sidepak data with those that would have been generated using the Dylos results postapplication of the calibration equation generated from the study.
Results
Recruitment
From the 1000 participants invited to take part in the study, 390 (39%) completed the questionnaire on their smoking habits. From this number, a total of 131 (34%) ticked the box to express interest in having the air quality measured in their home. Contact was made with 47 of these, and a total of 34 (17 smoking and 17 non-smoking) households agreed to a visit to have the air quality meters installed.
Summary results from homes
Table 1 provides summary data, divided by smoking status, from the 34 households where measurement took place. Of the 17 smoking homes, 14 contained one smoking resident while three contained two smoking residents. The average duration of sampling was 24 h 50 m (range: 22 h 49 m–29 h 41 m) with a total of 50 403 min of paired Sidepak–Dylos data collected. Average PM2.5 levels, as measured using the Sidepak devices, were 33.3 μg/m3 and 4.40 μg/m3 in the smoking and non-smoking households, respectively.
Summary statistics for air sampling results based on Sidepak data: divided by smoking status of home
Relationship between Sidepak and Dylos measurements
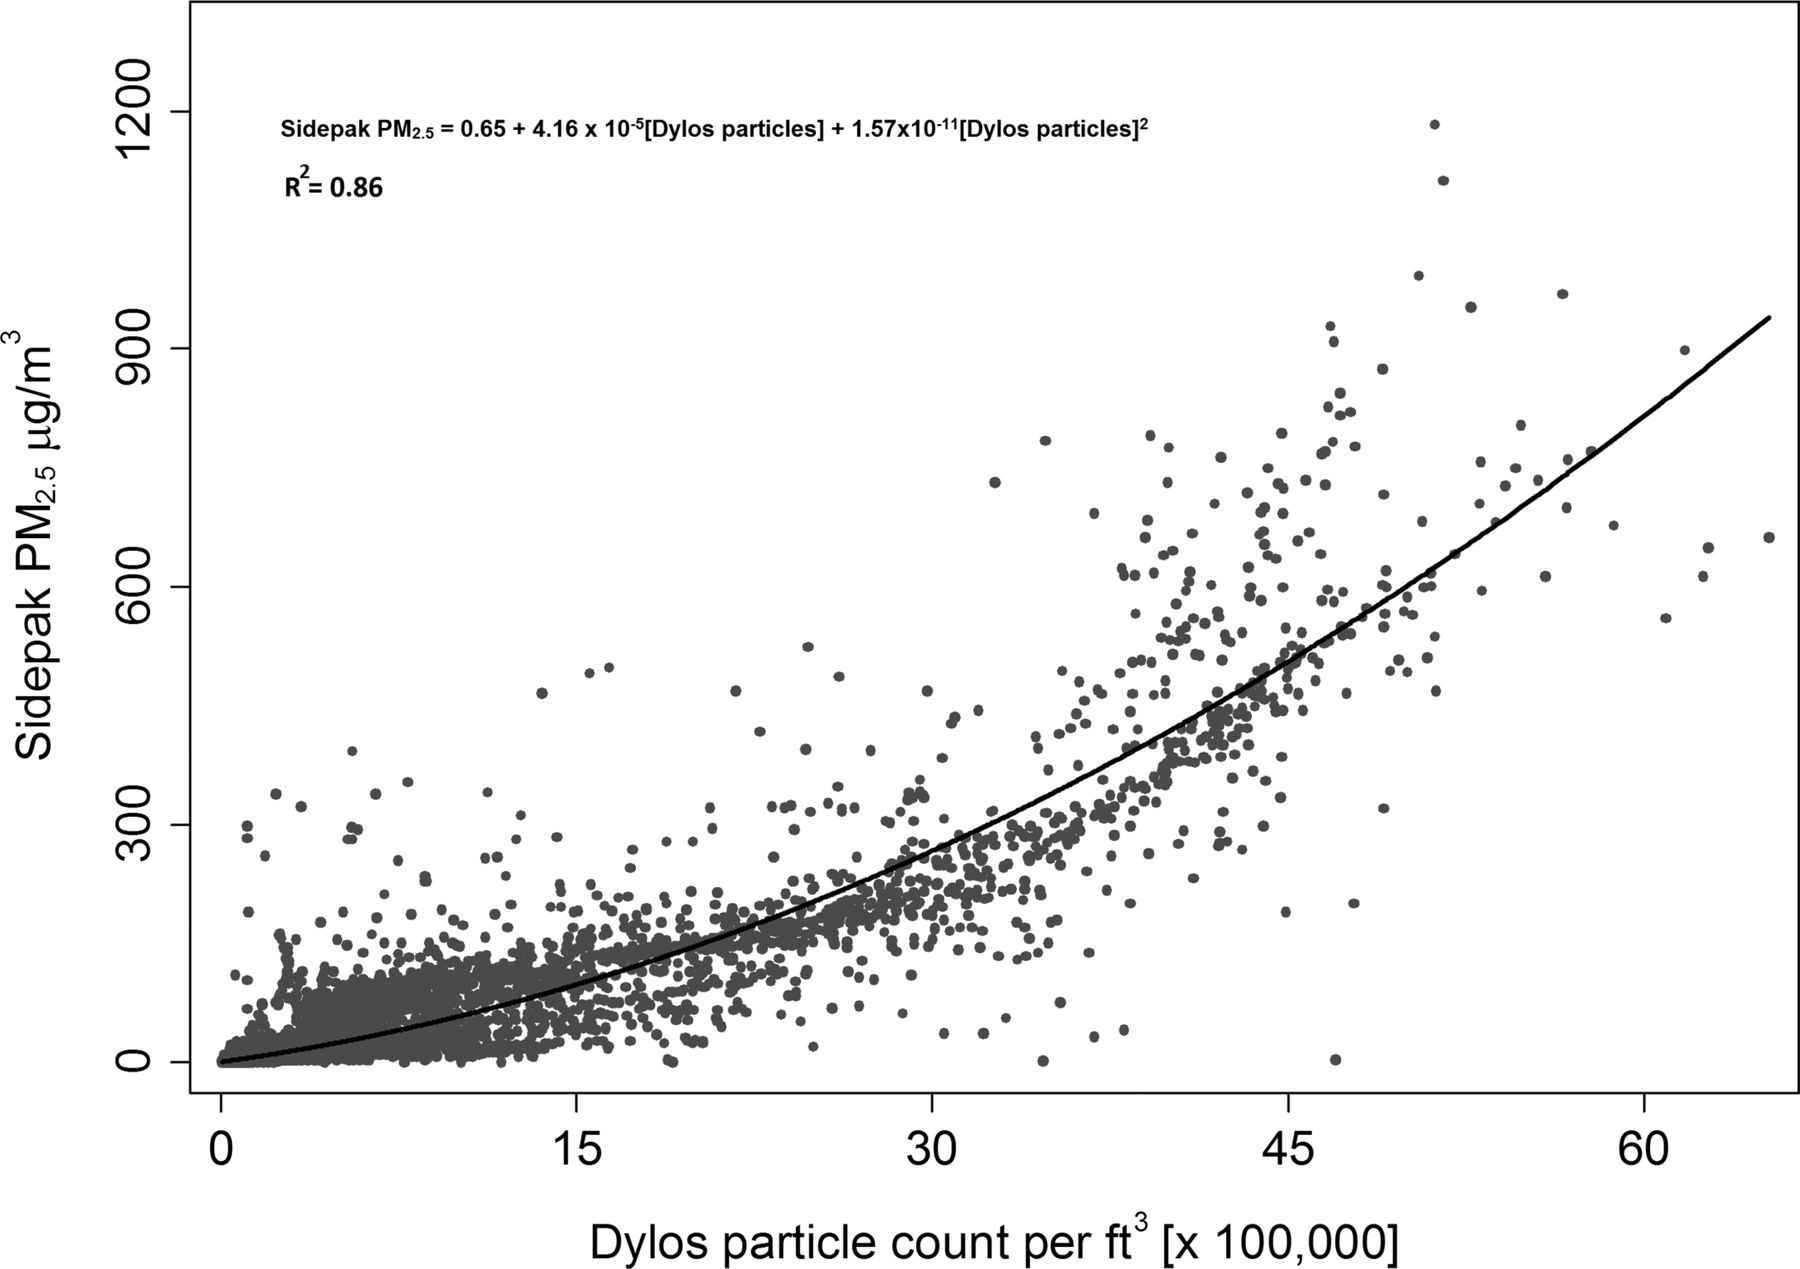
Figure 1 shows the relationship between Sidepak PM2.5 concentrations and Dylos particle numbers for each 1 min value from the calibration dataset used to generate the regression equation. These 25 301 paired 1 min Sidepak–Dylos measurements were selected randomly from all 34 homes. The best-fit quadratic equation produces an R2 value of 0.86, and the equation produced by regression is where PM is the mass concentration in μg/m3, Dylos particles is the number of particles 0.5–2.5 μm per cu ft measured by the Dylos device.

Scatter plot of the 1 min PM2.5 concentrations measured using the Sidepak device and the particle number concentration from the Dylos DC1700 from the calibration dataset (n=25 301). The line is the best-fit quadratic equation.
Figure 2 shows the Bland–Altman plot comparing the Sidepak measurements of PM2.5 with the mass concentration estimates generated using the application of equation 1 to the Dylos validation dataset (n=25 102).

Bland–Altman plot of the agreement between the Sidepak and Dylos generated PM values for the validation dataset (n=25 102). Shaded area represents the limits of agreement (−49.7 to 49.5).
The mean difference between the instruments is −0.09 with limits of agreement of −49.7–49.5 mg/m3. A total of 799 (3.2%) data points are outside the limits of agreement. Reduction of the limits of agreement to a tighter −25–25 μg/m3 (in other words±the WHO PM2.5 guidance value) produces approximately 8.3% (2089) of points out-with this range. The plot suggests that the Dylos may underestimate PM2.5 concentrations towards the higher end of the exposure range (>600 μg/m3). We note that in the 17 smoking homes, less than 1% of Sidepak 1 min values were above 500 μg/m3.
Comparison of instruments to produce air quality information for participants
While the agreement between the two instruments is important to demonstrate that the Dylos is a reliable method for measuring SHS in homes, the air quality information sheet (figure 3) is the actual intervention provided to the end user. Table 2 compares the quantitative parameters used in the air quality information sheets generated from the Sidepak and the Dylos-derived data for the complete dataset. The average value is within±10 μg/m3 for 30 of the 34 homes, with all 17 non-smoking homes producing average values within 7 μg/m3. Similarly, there is very good agreement in the values provided for the percentage of sampling time when the PM2.5 concentration exceeded 25 μg/m3 with more than three-quarters of all homes giving a value within±5%. All homes were within±6% for the percentage of time when the PM2.5 concentration exceeded the 246 μg/m3 (the average value in bars in Scotland measured before smoke-free legislation). As might be expected, the 1 min maximum value shows the greatest degree of disagreement with nearly 60% of homes being within±50 μg/m3. We also checked the agreement for values when the 25 µg/m3 threshold and the 246 µg/m3 threshold were exceeded in the calibration dataset. For values above the 25 µg/m3, a kappa of 0.7 indicated a very good agreement, and for a threshold of 246 µg/m3 the kappa showed an excellent 0.84.
Comparison of differences in quantitative air quality values that would have been produced by each instrument (generated Dylos values—Sidepak values)
Example of quantitative air quality information sheet.
Discussion
This is the first study to use the Dylos device to quantify SHS concentrations in real-life domestic settings. Building on previous work by our group where controlled chamber experiments had indicated that the device could be used to provide a mass concentration of PM2.5, 14 this study has examined the response provided by the Dylos in a sample of smoking and non-smoking homes producing more than 50 000 min of contemporaneous data. The calibration equation produced is a simple second-order polynomial equation that is broadly similar to that generated in our previous chamber experiments. The difference in the equation generated here with the one previously published14 is, in part, due to the fact that in this work we have subtracted the large particles (>2.5 μm) from the total particle count to generate a value of particle numbers between 0.5 μm and 2.5 μm. This represents a truer reflection of the SHS aerosol that the Sidepak device is measuring. The difference in the equation presented here is also likely to be due to differences in aerosol: the previous chamber work used aerosol that was purely sidestream SHS from a single brand of cigarette, while the household PM2.5 measured in this study will be a diverse mixture of mainstream and sidestream SHS with additional (small) contributions from household dust, outdoor air pollution and cooking fumes. The optical features and density of these aerosols will be different, and hence, the response of light-scattering instruments like the Sidepak and Dylos in real-life homes will vary depending on these and other factors, such as temperature and relative humidity.
The validation results from our study suggest that there is very good agreement between the two instruments when the regression equation is applied to Dylos data. Approximately 3% of measurements are outside the limits of agreement when an upper/lower bound of 1.96 SD of the difference is applied. Bland–Altman's original work17 suggests consideration of whether or not the 1.96 SD bounds are appropriate or ‘clinically significant’; in this case, we think that a difference of ±50 μg/m3 is likely to be an important measurement difference. If we reduce this to ±25 μg/m3 we still find that over 90% of the validation dataset lies within these new limits of agreement suggesting that the two devices produce broadly comparable results. This conclusion is further reinforced when we examine the actual, meaningful output of the measurement process in terms of the quantitative information sheet supplied to smokers who may take part in any future intervention programme. The differences between instruments in the average and percentage time above thresholds are generally small, and are unlikely to lead to major changes in participants’ perception of the air quality within their home.
The study suffers from some clearly identifiable weaknesses. First, we have assumed that the Sidepak is the gold standard and has measured the actual PM2.5 concentration that existed in the home for each given minute. The Sidepak is a photometric device that should be calibrated against a gravimetric gold standard. We did not have the means of gathering a gravimetric sample within these homes and so we have used a previously determined calibration factor (0.295) for Sidepak instruments measuring SHS aerosol.15 ,16 The measurement taken in any given minute in a home will be made up of PM from various sources. The ratio between tobacco PM and non-tobacco PM will vary over the course of the day in relation to the time since the last cigarette was smoked. It is thus likely that for any particular minute value, the calibration factor applied may introduce a degree of error. Second, we have assumed that the devices remained colocated for the period of sampling. We asked participants not to move the devices, but there was nothing to stop them from moving the instruments from the living room to other locations, or placing PM-producing sources directly next to one or the other device. While we have no evidence that this took place, we did identify one series of measurements, almost immediately after the researcher had left the home, where the devices produced significantly differing responses. Third, we did not use the same instruments in all homes. Two pairs were used for the majority of tests (82%). There is likely to be a degree of interinstrument variability between the Dylos and the Sidepak sets of instruments.
Measurements took place in homes across Aberdeen City and shire in the northeast of Scotland. We also acknowledge that participants were drawn from a subsample of the population and are unlikely to be representative. Participants had attended the local children's hospital, and were self-selecting in that they had first to agree to take part in a questionnaire on their attitudes towards smoking, and then express interest in having a device placed within their home. The average PM2.5 concentrations in the homes of smoking participants was 33.3 μg/m3 which is broadly similar to the value (40.7 μg/m3) measured at baseline in the REFRESH project looking at smoking mothers with children under 5 years of age.13 It is, however, markedly lower than that measured (187 μg/m3) in a sample of 11 smoking homes recruited through the IAPAH (Indoor Air Pollution and Health) study within the same geographical area.18 IAPAH sought to recruit households with any single type of open household combustion (wood, coal, peat, gas or smoking), and was not restricted to households containing children as REFRESH and this study were. This may explain the four-fold to five-fold difference in measured PM2.5 concentrations. Although perhaps atypical of all smoking homes, the homes involved in the present study are likely to be the type of smokers that any air quality-based intervention will be aimed at. Parents of children with chronic respiratory illness, such as asthma, or adults who have recently attended hospital themselves, may be particularly open to receive personalised information about the impact of their smoking on the air quality within their home.
Northcross and colleagues19 have recently tested a modified Dylos DC100 in chamber experiments and in ambient air, with a range of aerosols to measure outdoor air pollution. Their work suggests the device has a limit of detection and a resolution of less than 1 μg/m3. They argue that the device is a useful low-cost air pollution sampler, and they also indicate that it is likely to be useful for large-scale epidemiological studies and community-driven citizen science applications. The DC1700 model used in our work has many of the modifications described in Northcross’ work, and our field-test work indicates that it can be employed to provide simple air quality data within the community.
Future work should examine the Dylos instrument variability and explore the influence of temperature and relative humidity on the Dylos response to SHS. It may be possible to incorporate a simple, logging temperature and relative humidity sensor to the Dylos in order to provide the facility to adjust the particle count measurements accordingly. While the results of this work show that household air quality data in mass concentration units can be generated from the Dylos, it may be useful to consider a method where the on-board display or output presents the data in terms of some banding method similar to the US EPA air quality index. This would provide users with a more immediate framework for understanding and responding to their household air quality data.
Conclusions
A number of countries, including Scotland20 and New Zealand,21 now aspire to being tobacco-free nations in the first half of this century. Promoting smoke-free homes will be key to the process of denormalising smoking and breaking the transmission of smoking behaviour from established smokers to the next generation. The Dylos device offers a relatively low-cost, simple way of delivering households with personalised, air quality information as a motivational aid to smokers and non-smokers who are those interested in the health of their family in relation to the harms from SHS. We believe that combining the Dylos with REFRESH-style, community-based interventions provides the international tobacco control community a powerful tool to change smoking behaviour, increase cessation rates and reduce the number of children exposed to SHS at home.
What this paper adds
-
This study adds further evidence that the Dylos DC1700 can be used to quantify second-hand smoke exposure in homes.
-
Measurements made in both smoking and non-smoking homes provide a simple equation to convert particle numbers to a mass concentration that agrees closely to a PM2.5 concentration produced by the Sidepak instrument.
-
The device can be used to provide quantitative air quality data to motivate changes in household smoking behaviour.
Acknowledgments
We would like to thank all those who took part in the study. We are also grateful to the two peer reviewers who provided useful comments on the first submission of this manuscript.
References
Footnotes
-
Contributors SS and ST conceived, designed the study and obtained funding. AEI collected the data. SS and MS analysed the data. SS wrote the first draft of the manuscript and is the guarantor for this study. All authors made contributions to the final manuscript.
-
Funding The work was funded by a small grant from the Tobacco Control group of the Scottish School of Public Health Research.
-
Competing interests None.
-
Patient consent Obtained.
-
Ethics approval North of Scotland Medical Ethics Committee.
-
Provenance and peer review Not commissioned; externally peer reviewed.
-
Data sharing statement All raw data are available for data sharing by contacting the corresponding author.