Article Text

Abstract
Objective To examine the effect of varying levels of comprehensive tobacco control on smoking in a global context.
Methods Using data from WHO's Reports on the Global Tobacco Epidemic, scatter plots were produced to visualise the relationship between comprehensive tobacco control policy (2008 MPOWER composite score) and change in current tobacco smoking between 2006 and 2009. Fixed-effect regression models assessed the effect of changes in each MPOWER measure on changes in current tobacco smoking between 2006 and 2009. All analyses were stratified by sex.
Results Overall, countries with higher MPOWER composite scores experienced greater decreases in current tobacco smoking between the years 2006 and 2009. Regression analyses revealed that the M and R measures showed a negative association with current tobacco smoking over time. Current tobacco smoking decreased (1.07 percentage points for males, 1.04 percentage points for females) with each increase in score value for monitoring tobacco use (M). Also, current tobacco smoking decreased (0.95 percentage points for males, 0.41 percentage points for females) with each increase in score value for raising taxes on tobacco (R). The effect of the MPOWER measures on current tobacco smoking varied by country income status (P measure in the female analysis; p<0.05) and/or by WHO region (M, P and O measures in the male analysis; p<0.05).
Conclusions Higher levels of MPOWER combined, as well as continued and frequent monitoring of tobacco use (M) and increasing taxation (R), were associated with a decrease in current tobacco smoking over time.
- Global health
- Public policy
- Low/Middle income country
- Surveillance and monitoring
- Taxation
Statistics from Altmetric.com
Introduction
There is broad consensus about the need for comprehensive tobacco control strategies.1 Accordingly, the WHO introduced the MPOWER policy package, composed of six evidence-informed demand reduction interventions: M (monitor tobacco use), P (protect people from tobacco smoke), O (offer help to quit), W (warn about the dangers of tobacco), E (enforce bans on tobacco advertising, promotion and sponsorship) and R (raise taxes on tobacco).2 While there is evidence for each policy in isolation3 and models that estimate the combined effect4 and highest level policy effect5 on smoking and smoking-attributable deaths, little is known about how well various levels of MPOWER implementation work when applied under a range of global contexts. This study examined the effect of varying levels of comprehensive tobacco control on smoking prevalence in a global context.
Methods
This study assessed the association between country-level MPOWER scores and change in current tobacco smoking between 2006 and 2009.
Data
Age-standardised current tobacco smoking and MPOWER policy data were extracted from three WHO Reports on the Global Tobacco Epidemic (MPOWER reports);2 ,6 ,7 a baseline age-standardised current tobacco smoking estimate (2006),7 followed by 2 years of MPOWER policy measures (2007, 2008)6 ,7 and a subsequent age-standardised current tobacco smoking estimate (2009)2 were obtained for each country. All age-standardised current tobacco smoking estimates were stratified by sex. Income status and WHO region for each country were also extracted from the MPOWER reports.
Countries included in this study had a consistent survey data source to ensure reliability in survey methodology and smoking definitions within-country across time, and 2006 as well as 2009 age-standardised current tobacco smoking estimates. Of the 194 countries included in the MPOWER reports, 59 countries met the inclusion criteria for males and 56 countries met the inclusion criteria for females (see online supplementary appendices 1–9 for listing of countries).
Measures
For each MPOWER measure, a score of 1 indicated a lack of available data and a score of 4 (M) or 5 (P, O, W, E and R) indicated the strongest level of tobacco control policy.8
An MPOWER composite score was created by summing each of the six 2008 MPOWER measure scores to provide a snapshot of the level of tobacco control policy in each country. The maximum value for the MPOWER composite score was 29.
Change in current tobacco smoking was estimated by calculating the percentage-point difference between the 2009 and 2006 age-standardised current tobacco smoking estimates.
Analysis
Scatter plots were created to visualise the relationship between the 2008 MPOWER composite score and change in current tobacco smoking between 2006 and 2009.
Separate fixed-effect regression models were conducted to assess the effect of changes in each of the six MPOWER measures on changes in current tobacco smoking within country over time. Specifically, 2007 and 2008 MPOWER measures and 2006 and 2009 current tobacco smoking estimates were included in each of the regression analyses in panel data format. Interaction terms were incorporated into two separate fixed-effect regression models and post-estimation tests to assess differences by country income status and WHO region.
All analyses were stratified by sex using Stata V.12.1.
Results
The majority of the male and female smoking estimates were from high-income (41% for male and female estimates) and middle-income countries (42% and 43%, respectively). Country prevalence estimates were from five of the six WHO regions. The largest proportion of prevalence estimates was from Europe (42% male and 45% female estimates), followed by Africa (25% male and 21% female estimates), the Americas (14% male and 16% female estimates), Western Pacific (12% male and 13% female estimates) and Eastern Mediterranean (7% male and 5% female estimates). On average, current tobacco smoking dropped 2.36 percentage points among males and 0.65 percentage points among females between 2006 and 2009. Compared with the full MPOWER report, our sample included more high-income and European countries, and fewer Eastern Mediterranean and Southeast Asian countries, but had similar MPOWER composite scores. Summaries of the 2008 MPOWER composite score, the 2007 and the 2008 MPOWER measure score values are available in the online supplementary appendices 1–9.
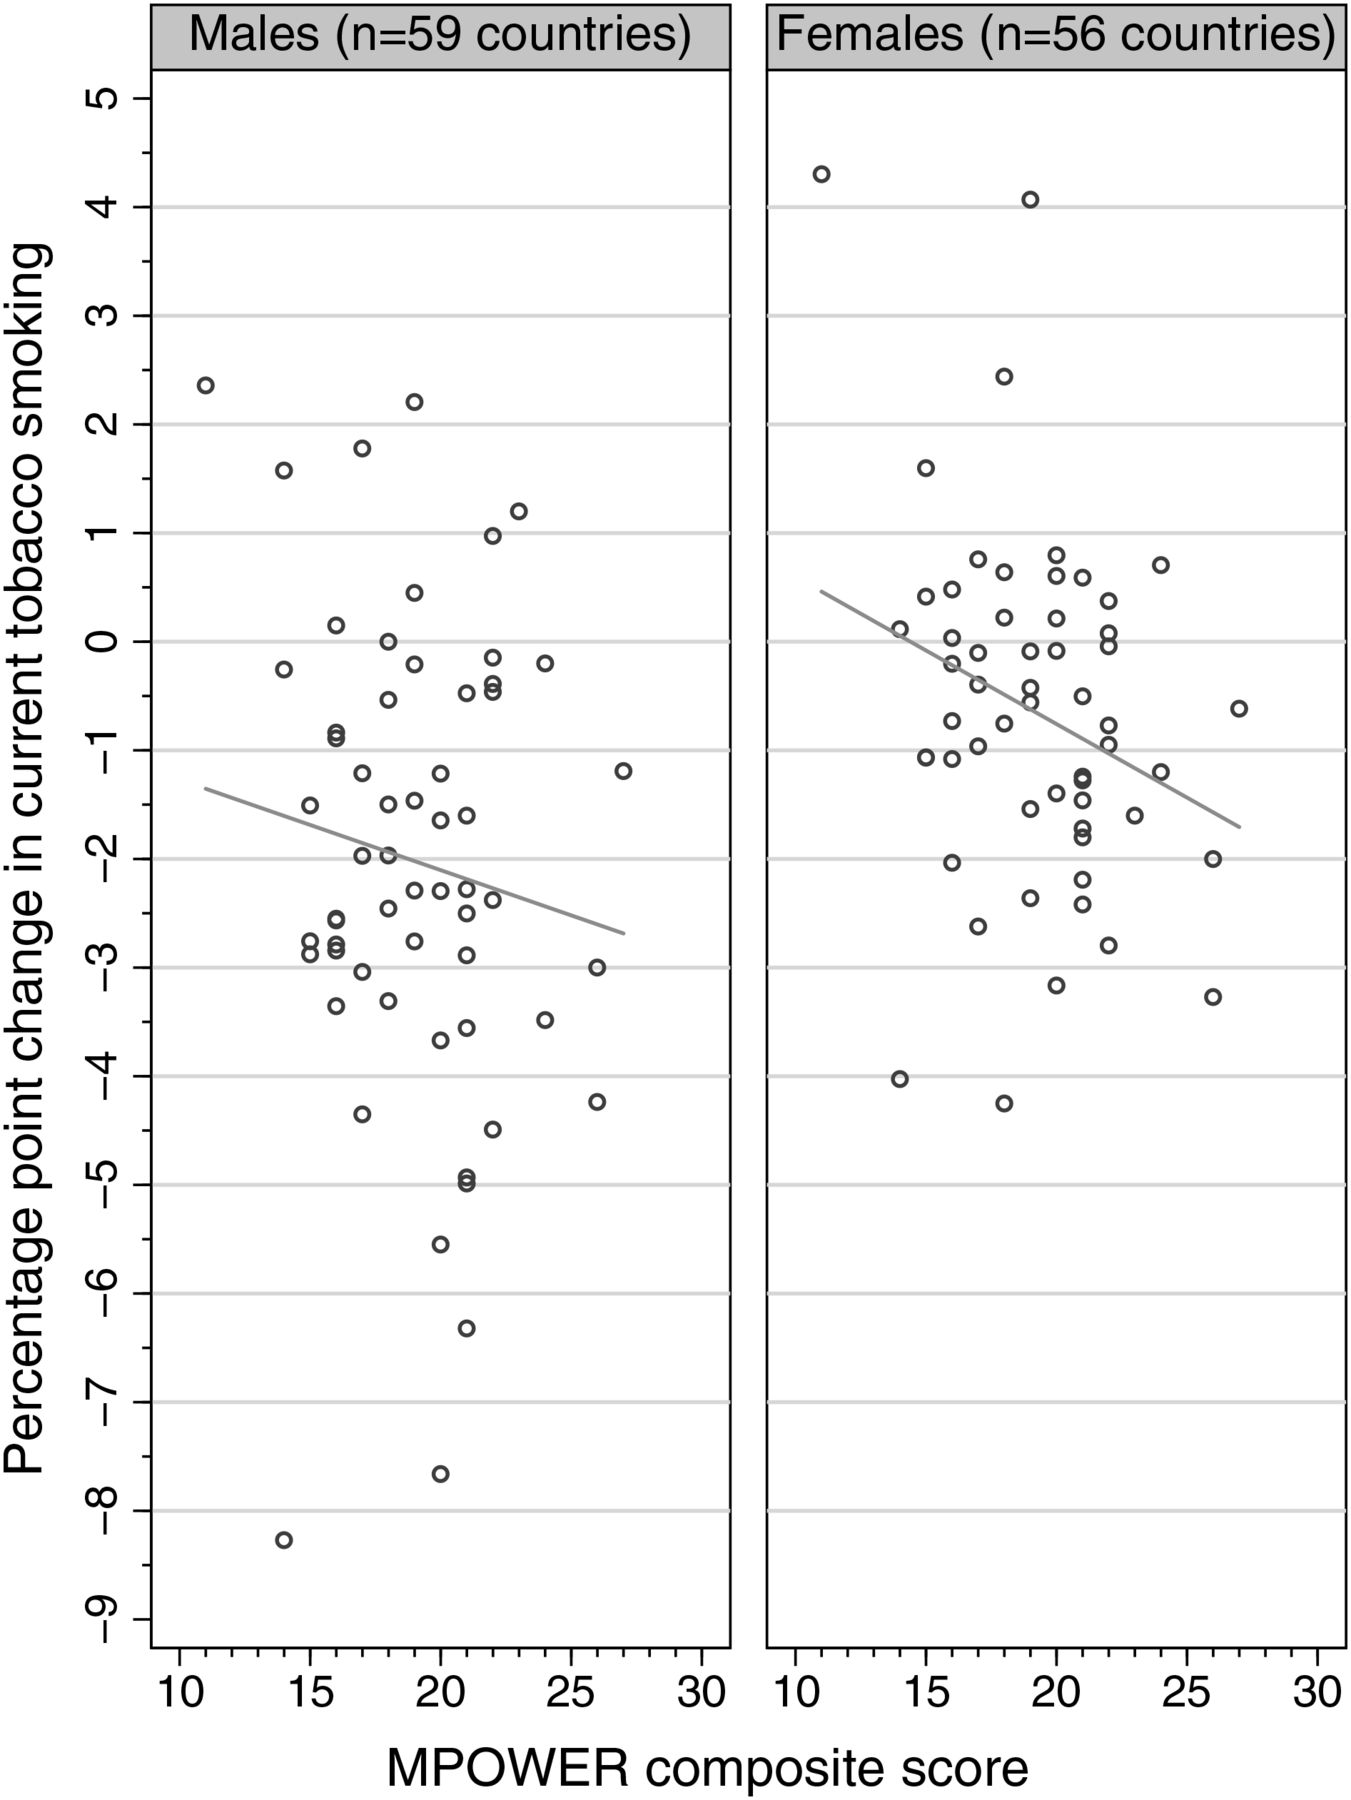
Overall, countries with higher MPOWER composite scores in 2008 experienced greater decreases in current tobacco smoking between the years 2006 and 2009 (figure 1). However, the association between MPOWER composite score and change in current tobacco smoking prevalence was not consistent for all countries. Some countries with a high MPOWER composite score experienced an increase in current tobacco smoking, while other countries with a low MPOWER composite score experienced a decrease in current tobacco smoking.

Change in current tobacco smoking by 2008 MPOWER composite score, by sex.
The fixed-effect regression models assessed the effect of changes in MPOWER scores on changes in smoking and revealed that the M and R measures showed a negative association with current tobacco smoking over time (see online supplementary appendices 1–9). With each increase in score value for monitoring tobacco use (M) between 2007 and 2008, male current tobacco smoking decreased by 1.07 percentage points (p<0.05) and female current tobacco smoking decreased by 1.04 percentage points (p<0.001) between 2006 and 2009. Similarly, male current tobacco smoking decreased by 0.95 percentage points (p<0.001) and female current tobacco smoking decreased by 0.41 percentage points (p<0.05) between 2006 and 2009 with each increase in score value for raising taxes on tobacco (R) between 2007 and 2008.
The effect of the MPOWER measures on current tobacco smoking over time varied by country income status for the P measure in the female analysis (p<0.05); such that low-income and middle-income countries showed decreases in current tobacco smoking over time compared with higher income countries that, on average, did not show a statistically significant decrease with increases in protection policies.
In the male analysis, the effect of MPOWER measures on current tobacco smoking over time varied by WHO region (M, P and O measures; p<0.05; see online supplementary appendices 1–9). Compared with other regions, relatively larger decreases in current tobacco smoking were noted over time among European, American and African countries for monitoring tobacco use (M); American and Western Pacific countries for protecting people from tobacco smoke (P); and African, European and Western Pacific countries for offering help to quit (O).
Discussion
As MPOWER is an evidence-informed tobacco control policy package, it is not surprising that this exploratory analysis revealed that, overall, the higher the MPOWER score, the greater the decrease in smoking prevalence. More intriguing were the exceptions to this rule. Several countries with low MPOWER scores appeared to achieve considerable decreases in prevalence (range −3 to −8 percentage points; Oman, Paraguay and Uganda in the male analysis, and Nauru in the female analysis). This calls for further exploration aimed at revealing what non-MPOWER factors account for success. Similarly, several countries with high MPOWER scores did not achieve decreases in prevalence (Norway and Cook Islands in the male analysis and Italy, France, Korea, Croatia, Romania, Mauritius and Eritrea in the female analysis). However, these findings may be limited due to the small non-representative sample. Further study should explore whether this has to do with particular mixes of interventions, duration, particularly high-prevalence or low-prevalence rates, or exogenous factors such as economic hardship or success, conflict or political turmoil.
Findings from the regression analyses support the need for continued and frequent monitoring of tobacco use among youth and adults. The negative association between taxation and current tobacco smoking is consistent with other research that identified taxation as having one of the largest effects on smoking3 and smoking-related deaths.3 ,5 The significant variations in the effect of MPOWER measures on current tobacco smoking suggest that other factors, currently not captured by the MPOWER measures, have contributed to the change in current tobacco smoking over time.
Recent work by Levy et al5 demonstrated the effect of implementing only the highest level policy for each MPOWER measure on reducing the number of smokers and smoking-attributable deaths. This study differs in that it modelled change in tobacco smoking among countries with the full range of score values for each MPOWER measure, thereby demonstrating how different levels of policy implementation affect smoking behaviour.
There are several limitations to this study. The MPOWER reports score tobacco control policy on the presence of legislation and not the implementation of such policy. This may result in erroneous assumptions about the status of a country's tobacco control policy at the time the MPOWER report was published. Some countries included in the sample have not reported recent country-level smoking estimates. Instead, the smoking estimates in the MPOWER reports were based on smoking estimate projections or subregional estimates, either of which may lead to skewed country-level smoking estimates. The time frame between smoking estimates and tobacco policy implementation included in this study was short, thus limiting the ability to assess the effects of policy implementation. We used prevalence data as the outcome measure; however, consumption data might be more sensitive to tobacco control policy implementation.9 Last, many lower income countries and countries of interest (eg, Australia, Bangladesh, China, India, the Russian Federation, the USA and Vietnam) did not meet our strict inclusion criteria resulting in a sample of mainly high-income countries that are better able to execute frequent and consistent surveys.
Despite these limitations, this study is one of the few that compares MPOWER effects on smoking behaviour across countries. Further research is needed that extends the follow-up time and incorporates measures of policy implementation.
What this paper adds
Single country analyses of the effects of comprehensive tobacco control indicate varying levels of effectiveness.
To date, no empirical studies have been published that compare varying levels of MPOWER effects on smoking behaviour across countries.
This analysis demonstrates that while the MPOWER package generally works to decrease smoking prevalence, there is a need to explore additional factors that contribute to either promoting or preventing successful reduction.
Acknowledgments
The authors wish to thank Jennifer Ellis and Alison Commar for their assistance in interpreting the MPOWER report data.
Supplementary materials
Supplementary Data
This web only file has been produced by the BMJ Publishing Group from an electronic file supplied by the author(s) and has not been edited for content.
Files in this Data Supplement:
- Data supplement 1 - Online supplement
Footnotes
Contributors JD, RS, MC, SO and JEC have contributed to the study design, analysis and interpretation of the results; drafted and critically revised the manuscript; approved the version of the manuscript being submitted and agree to be accountable for all aspects of the work in ensuring that questions related to the accuracy or integrity of any part of the work are appropriately investigated and resolved.
Funding This work was supported by an award from the Institute for Global Tobacco Control at the Johns Hopkins Bloomberg School of Public Health with funding from the Bloomberg Initiative to Reduce Tobacco Use.
Competing interests None.
Provenance and peer review Not commissioned; externally peer reviewed.
Data sharing statement All data included in this study's analysis is publicly available from the WHO Tobacco Free Initiative website (http://www.who.int/tobacco/global_report/en/).