Article Text

Abstract
Background In 2013, the State of Minnesota Legislature passed a tobacco tax increase that increased the combined cigarette excise and sales tax by US$1.75 (from US$1.60 to US$3.35) and increased the tax on non-cigarette tobacco products from 70% to 95% of the wholesale price. The current study explores the change in tobacco prices in retail locations and whether the tax increase was fully passed to consumers.
Methods An observational study of tobacco retail prices was performed in a sample of 61 convenience stores in Minnesota, North Dakota, South Dakota and Wisconsin. Six rounds of data were collected between May 2013 and January 2014. In each round, purchases were made at the same stores for the same four tobacco products (Camel Blue cigarettes, Marlboro Gold cigarettes, Grizzly Wintergreen moist smokeless tobacco and Copenhagen Wintergreen moist smokeless tobacco).
Results For all studied tobacco products, prices in Minnesota increased significantly after the tax increase (Round 1–Round 6). After controlling for price changes in neighbouring states, the average price difference in Minnesota for the two cigarette brands increased by US$1.89 and US$1.81, which are both more than the US$1.75 tax increase. For moist smokeless, the average price difference increased by US$0.90 and US$0.94. Significant price changes were not observed in the comparison states. After the introduction of the minimum moist smokeless tax, a significantly higher proportion of Minnesota stores offered price promotions on smokeless tobacco.
Conclusions A large tobacco tax resulted in an average retail cigarette price exceeding the tax, suggesting the industry over-shifted the cigarette tax increase to consumers in Minnesota. The findings support the known public health benefit of tobacco tax increases while highlighting the need for additional information about how, or if, tobacco companies use price promotions to blunt the impact of tax increases.
- Taxation
- Price
- Tobacco industry
- Advertising and Promotion
- Public policy
Statistics from Altmetric.com
Background
Each year, US tobacco companies spend billions of dollars marketing and promoting their products. In 2011, tobacco companies spent a combined US$8.8 billion on advertising and promotion in the USA1 ,2 More than 80% of this promotional budget was spent on price discounting, specifically, payments made to tobacco wholesalers and retailers that, ultimately, reduce the price of tobacco to consumers at the point of sale.1 ,2 Evidence from tobacco industry documents3 indicates that tobacco companies are well aware that as prices increase, tobacco use declines especially among younger smokers. Further, price promotions became increasingly common in the 1980s and 1990s in response to tobacco tax increases, which the tobacco industry knew could lead to significant reductions in tobacco use.3 While we know about these price promotions from the tobacco industry's own documents and required submissions to the US Federal Trade Commission, less is known about how much, if any, these price promotions are used to reduce the cost of tobacco products for consumers after a tax increase. This study aims to take advantage of a unique opportunity to study tobacco industry pricing strategies after a significant tobacco tax increase.
Even as the tobacco industry actively uses price discounting, there is evidence to suggest that it also intentionally increases prices on top of new tobacco taxes, also called over-shifting. By over-shifting, the industry can increase profits while effectively shifting blame for the entire price increase to ‘the government’.4 There are a relatively small number of studies that have examined tobacco industry manipulations of pricing in relation to tax increases. Several studies have found that tobacco companies do over-shift tobacco tax increases to consumers.5–8 In a recent paper, Gilmore et al9 found that, on average, tobacco taxes in the UK are over-shifted by tobacco companies, but for ultra-low-priced cigarette brands the tax may not be fully passed on to consumers. Most studies that report over-shifting are relatively recent and focus on high-income countries. Fewer studies have reported evidence that tobacco companies absorb some of the tax increase and pass it on a lower rate, also called under-shifting,10 ,11 or pass on the exact amount of tobacco tax increases, also called fully-shifting, to consumers.12
In 2013, the Minnesota Legislature passed a tobacco tax increase that more than doubled the combined cigarette excise and sales tax—from US$1.60 per pack (US$1.23 in tobacco tax and US$0.37 in sales tax) to US$3.35 per pack (US$2.83 in tobacco tax and US$0.52 in sales tax). The tax on other tobacco products increased from 70% to 95% of wholesale price. In an effort to reach tax parity, a minimum tax on moist smokeless tobacco was created that is equivalent to the cigarette excise tax (US$2.83). In Minnesota, the excise tax on all tobacco products is collected at the wholesale level. A set fee in lieu of sales tax on cigarettes is also collected at the wholesale level. Sales tax on non-cigarette tobacco products is collected at the retail level as a per cent (between 6.875% and 7.875% depending on locality) of purchase price. The tobacco tax increase took effect on 1 July 2013; the minimum moist smokeless tobacco tax took effect on 1 January 2014. This increase took Minnesota from having the 27th highest state cigarette excise tax to the seventh highest in the nation, and made the Minnesota cigarette tax the highest in the region.13
This study's comparison states of North Dakota, South Dakota and Wisconsin all have lower taxes on cigarette and non-cigarette tobacco products than Minnesota. North Dakota has a combined cigarette and sales tax of US$0.64 (US$0.44 in cigarette tax and US$0.20 in sales tax). In North Dakota, smokeless tobacco is taxed at US$0.16 per ounce; a sales tax of 5% is also applied. South Dakota has a combined cigarette and sales tax of US$1.75 (US$1.53 in cigarette tax and US$0.22 in sales tax). Smokeless tobacco is taxed at 35% of wholesale price; a sales tax of 4% is also applied. Finally, in Wisconsin, the combined cigarette and sales tax is US$2.87 (US$2.52 in cigarette tax and US$0.35 in sales tax). Smokeless tobacco is taxed at 71% of the manufacturer's price and an additional 5% in sales tax is applied.14 ,15 During the study period, there were no relevant statewide policy changes (eg, tobacco tax increases or smoke-free laws) in the comparison states.
The current study attempted to answer three primary research questions: First, what happens to the retail price of cigarettes and smokeless tobacco after a sizeable statewide excise tax increase? Specifically, is there evidence of tax shifting (over-shift, under-shift or fully-shift) to the consumer? Second, following a tax increase how much variation in price is observed among the same tobacco product and what appears to account for any variation? Finally, do tobacco price promotions increase in response to excise tax increases? Repeated tobacco purchases were conducted before and after the tax increase to answer these research questions. We believe that this is the first study to examine both the real world impact of a substantial tobacco tax increase on retail prices paid as well as incidence of retail tobacco price promotions. Tobacco tax increases are one of the most powerful policy options available to reduce tobacco use. Substantial evidence indicates that tobacco tax increases decrease smoking rates.16 ,17 Understanding how the tobacco industry responds to tobacco tax increases and how this affects the actual prices paid by consumers is an essential part of ensuring that tax increases are fully and effectively implemented.
Methods
An observational study of tobacco retail prices was conducted in a sample of 61 convenience stores in Minnesota (n=48) and the neighbouring states of North Dakota (n=2), South Dakota (n=2) and Wisconsin (n=9). Convenience stores were chosen as the focus because in the USA they represent both the largest percent of tobacco retailers by type and the channel through which the majority of tobacco sales occur.18 ,19 The sample was generated through a combination of random and purposive sampling. In Minnesota, data were collected in seven regions throughout the state. One of the seven Minnesota regions was the metropolitan area of Minneapolis and St. Paul. In this region, due to the large number of convenience stores, a random sample of eight stores was generated using city lists of tobacco licenses. In the remaining six Minnesota regions, convenience stores were purposively selected to ensure geographic coverage, representation of large chain stores and a mixture of chain versus independent stores. In the neighbouring states, stores were purposively selected to represent convenience store chains that exist on both sides of the border.
Data were collected in six rounds between May 2013 and January 2014. Rounds 1 and 2 were conducted during the weeks of 27 May 2013 and 24 June 2013, respectively. Both rounds were conducted before the Minnesota excise tax increase went into effect on 1 July 2013. Round 3 was completed 1 week after the tax increase, during the week of 8 July 2013; and Round 4 was conducted during the week of 29 July 2013 (4 weeks after the tax increase took effect). Round 5 was conducted during the week of 26 August 2013; and Round 6 was conducted during the week of 13 January 2014, which was 2 weeks after the minimum moist smokeless tobacco tax went into effect.
In each round, trained data collectors visited the same convenience stores during each predetermined week period. Collectors purchased the same four tobacco products. Two cigarette products were studied, both of which are considered premium brands: Marlboro Gold cigarettes (previously called Marlboro Lights) and Camel Blue cigarettes (previously called Camel Lights). Two moist smokeless tobacco products were studied: Copenhagen Wintergreen moist smokeless tobacco and Grizzly Wintergreen moist smokeless tobacco. Historically, Copenhagen has been seen as a premium brand and Grizzly as a value brand. These tobacco products were chosen because they hold the largest market shares in the cigarette and moist smokeless tobacco categories for the metropolitan area of Minneapolis and St. Paul, according to Nielsen Convenience Track market data.20 During each visit, collectors recorded the date and the name and address of the store visited. For each product purchased, product name, price promotions offered (if any), and final price paid (after any price promotions) were documented. For this study, only those price promotions that were automatically received by consumers during purchase were considered. These markdowns often took the form of a set amount off which was clearly marked on the packaging (figure 1). Other times, the promotion was reflected on the receipt as a set amount off. We did not consider consumer coupons. For each assessment, receipts were collected to ensure accuracy. A standardised data-collection form was used to record all information. For all analyses, we only considered the final price paid after any price promotions were applied.

Example of the type of price promotion observed and analysed.
To examine price variation among Minnesota stores, convenience stores were geocoded and linked to Census data at the census tract level. Additionally, the Minnesota stores were coded as either chain or independent, based on the Convenience Store News publication titled ‘The Top 100 Convenience Stores.’ 21
Analysis
Two-sample independent t tests were conducted to compare the final price paid for each product obtained in a Minnesota store and stores in bordering states (North and South Dakota and Wisconsin) at each round. Repeated-measure models were used in subsequent analyses to account for the correlation of measurements from the same store. An ordinal categorical variable round (which took values between Rounds 1 and 6) was included to test the statistical significance of changes in final price paid over time. A Round×State (ie, Minnesota vs bordering states) interaction term was used to examine whether changes in final price paid for each product over time differed between Minnesota and bordering states. We also performed a difference-of-differences analysis on changes in product price by state for each product. Specifically, we first estimated price changes in each product between pretax (Round 1–2) and post-tax increases (Round 3–6), and then estimated the difference in price changes in each product by state (Minnesota minus comparison states).
For the Minnesota stores, a Round×StoreType (ie, chain vs independent) interaction term was used to examine whether changes in final price paid for each product over time differed by store type, with and without adjusting for the amount discounted through price promotions. Finally, the associations were examined between socioeconomic characteristics of the census tract where the Minnesota stores were located and final price paid for each product. Separate models were used for each socioeconomic characteristic because of the high correlations between these variables. All analyses were conducted in 2014 using PC-SAS V.9.3, and repeated measure models were estimated using PROC MIXED.
Results
In Minnesota, after implementation of the tax increase (Round 3–6), the average prices paid for both of the cigarette products and both of the smokeless tobacco products were significantly higher than average prices paid before the tax increase (Round 1–2; p<0.001; table 1). In contrast, average prices paid for the cigarette and smokeless tobacco products did not change significantly during the same period of time in comparison states (p>0.05).
Average prices paid (US$), ranges (US$) and p values for tobacco products purchased before and after tax increase: Minnesota versus comparison states
After controlling for price changes in comparison states, the average pack price paid for both cigarette products increased by more than the amount of the actual tax increase. Between pre-tax (Round 1–2) and post-tax rounds (Round 3–6), the average pack price of Marlboro Gold in Minnesota increased by US$1.89 (p<0.0001), which is US$0.14 more than the combined tobacco and sales tax increase of US$1.75. Similarly, the average pack price of Camel Blue in Minnesota increased by US$1.81 beyond comparison states (p<0.001), which is US$0.06 beyond the tax increase.
In Minnesota, the average price paid for both moist smokeless tobacco products also increased significantly after the tax increase. Significant price changes were not observed in the comparison states. The average price change in Copenhagen Wintergreen smokeless in Minnesota between pretax (Round 1–2) and post-tax rounds (Round 3–6) was US$0.90 beyond the average price changes in the product in comparison status (p<0.0001). Likewise, the average price increase of Grizzly Wintergreen smokeless in Minnesota was US$0.94 beyond that of the product in comparison states (p<0.0001). Furthermore, in Round 6, after the implementation of the minimum moist smokeless tobacco tax, average prices paid for both of the moist smokeless tobacco products were significantly higher than in Round 5 (p<0.001). In Minnesota, the excise tax on non-cigarette products is an ad valorem tax based on the per cent of wholesale price. The tax amount fluctuates as the wholesale price of the product changes. Since the wholesale prices were not available to the researchers, it was not possible to determine if the tax on these products was under-shifted, over-shifted or fully-shifted to consumers.
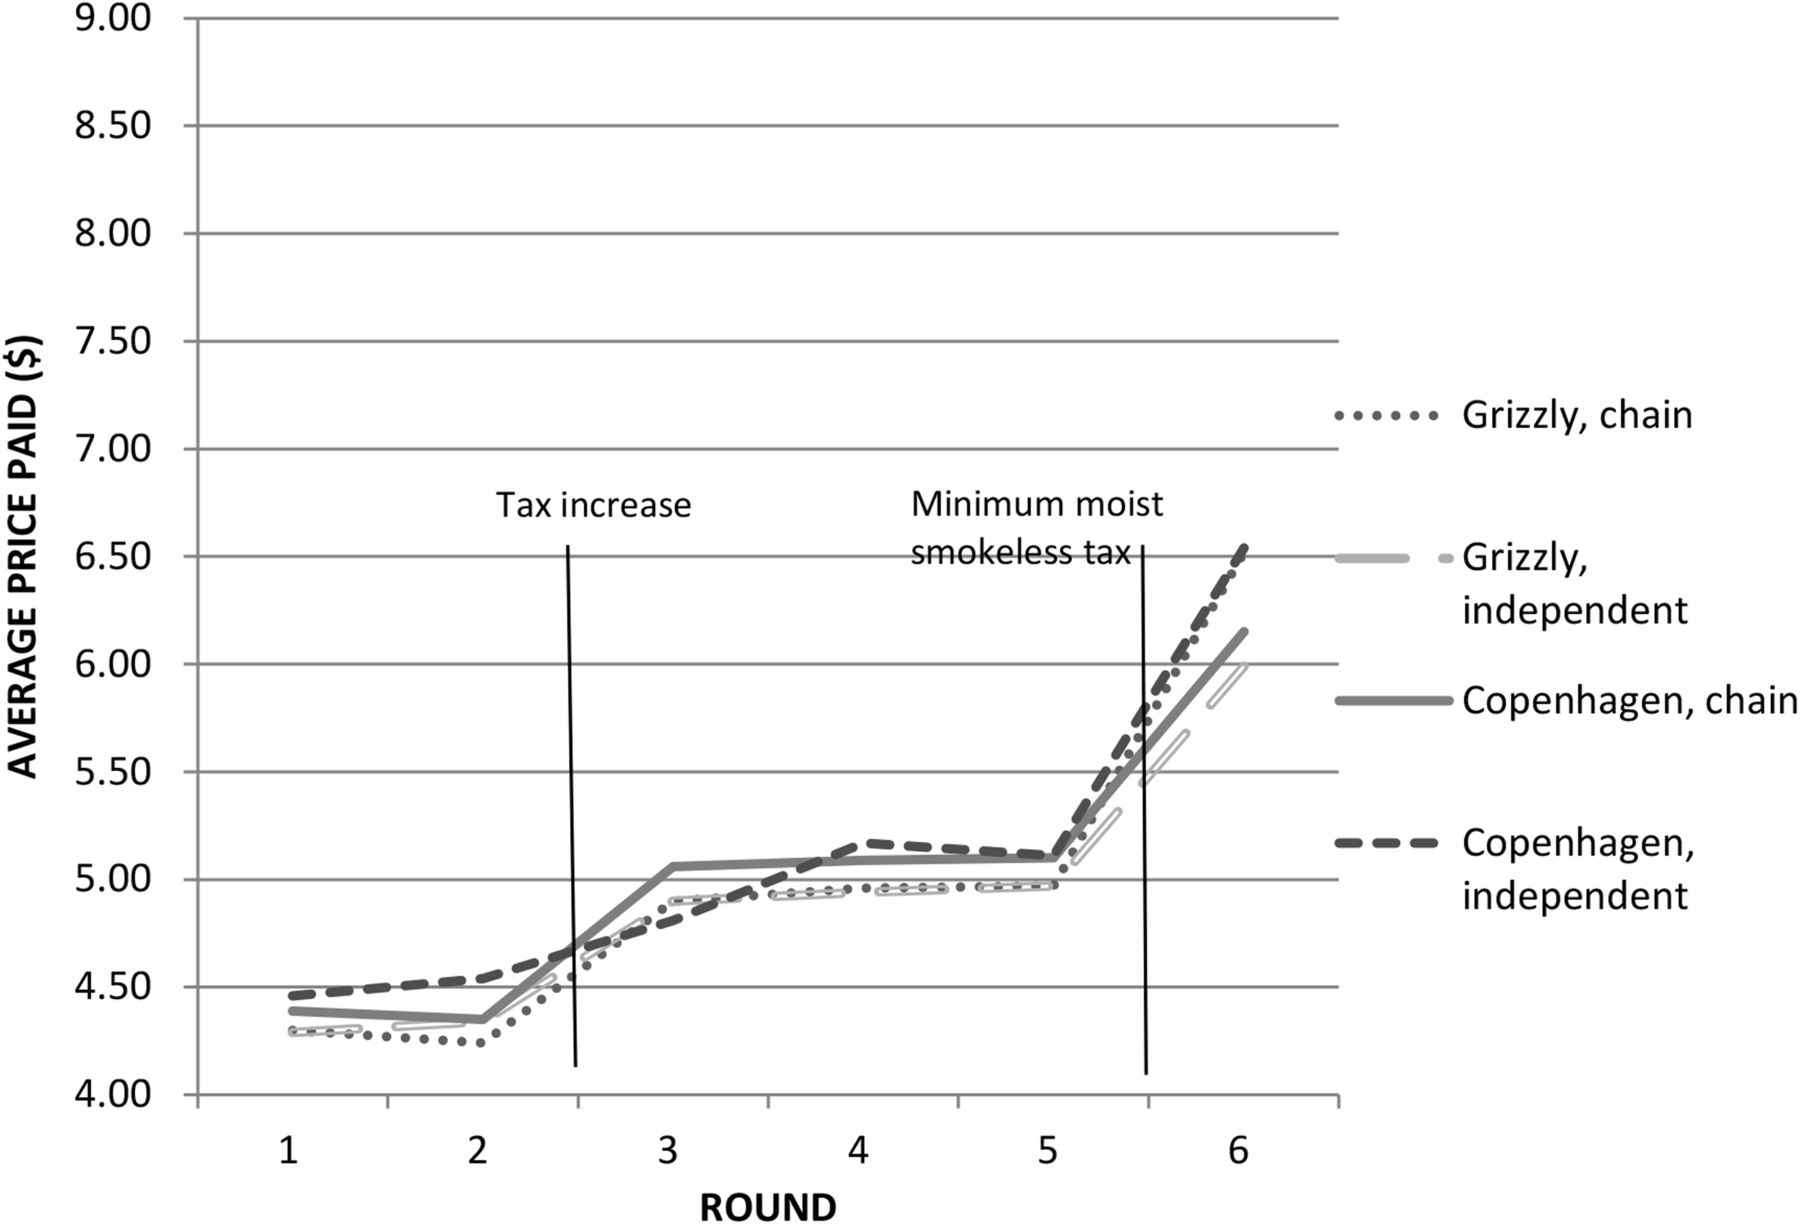
For all studied tobacco products, a great deal of variation was observed in prices paid across Minnesota stores. In Round 6, the difference between the highest and lowest price paid for a pack of Camel Blue cigarettes in Minnesota was US$2.21. For Copenhagen Wintergreen, this difference was US$3.10 and for Grizzly Wintergreen it was US$2.62. The range for Marlboro Gold cigarettes was the smallest observed at US$0.81 in Round 6. We hypothesised that this variation might be due to store type (chain vs independent). For Marlboro Gold cigarettes, there was no significant difference observed between the average prices paid at chain versus independent stores in any of the rounds and over time (Round×StoreType interaction p=0.403; figure 2). Camel Blue cigarettes were consistently less expensive in chain versus independent store (t test p<0.05 for Rounds 1–5) except in Round 6 (t test p=0.51). This price difference also seemed to be larger after the tax increase (Round×StoreType interaction p=0.001). For Copenhagen smokeless tobacco, no significant difference was observed for prices paid in chain versus independent stores for any of the rounds (Round×StoreType interaction p=0.3075; figure 3). The only significant difference observed for Grizzly was in Round 6 (p=0.006) with a higher average observed price at chain stores (Round×StoreType interaction p=0.01).

Average cigarette prices paid by round, by store type, in Minnesota.
Average smokeless tobacco prices paid by round, by store type, in Minnesota.
Another factor we hypothesised might contribute to price variation was the presence of price promotions. Price promotions were observed in all rounds of data collection and are summarised in table 2. For this study, we considered only those price promotions that were offered directly to consumers. This usually took the form of a set amount off the price, which was clearly marked on the package (figure 1) or an amount off which was reflected on the receipt. In Minnesota, of those tobacco products studied, Camel Blue cigarettes had the highest prevalence of offering price promotions, ranging between 27.1% of stores at Round 1; 43.8% of stores at Round 4; and 20.5% of stores at Round 6 of Minnesota stores offering a price promotion for this product. On average, the Camel Blue price promotions also offered the most value off. In all rounds, the average Camel Blue price promotion among those stores that offered one was at least US$0.75 off. After adjusting for the amount of price promotion offered, the difference in average price of Camel Blue cigarettes by store type diminished and became non-significant at Round 2 and 5.
Price promotions offered, by tobacco product, by round for Minnesota stores
In Round 6, after the implementation of the minimum moist smokeless tobacco tax, a significantly higher proportion of Minnesota stores offered price promotion for Copenhagen Wintergreen smokeless (26.2% of stores in Round 6 vs 0–2.3% of stores in Rounds 1 through 5; round effect p<0.0001). In Round 6, when Copenhagen price promotions were most frequently observed, the average amount off was US$0.63. Price promotions for Grizzly Wintergreen smokeless were uncommon (0–8.5% of stores over six rounds for Grizzly Wintergreen smokeless), and the only type of price promotion observed for Grizzly was US$0.50 off. Marlboro Gold cigarette price promotions were very uncommon. Only one Marlboro Gold price promotion was observed in Minnesota during the study and it was for US$0.15 off.
Socioeconomic characteristics at the census tract level were associated with the cigarette and smokeless tobacco prices paid (table 3). Marlboro Gold cigarettes cost more in census tracts with higher proportion of white (US$0.04 per every 10% increase in proportion white, p=0.030) and cost less in census tracts with higher proportion of population living under poverty (–US$0.06 per every 10% increase in proportion of population living under poverty, p=0.015). Grizzly and Copenhagen smokeless tobacco both cost more in census tracts with higher median home values (US$0.01 per US$10 000 median home value for both brands, p<0.05). Grizzly also cost more in census tracts with higher proportion of young adults (aged 18–24, US$0.05 per 10% increase in proportion of young adults, p=0.028).
Bivariate analysis on predictors of cigarette and smokeless prices (p values)
Discussion
In July 2013, a sizeable increase in Minnesota taxes on tobacco products created an opportunity to evaluate how the tobacco industry modifies product prices in response to a tax increase. The findings from this study indicate that an increase in the tobacco tax resulted in an increase in the actual tobacco prices paid by consumers, which supports the known public health benefit of tobacco tax increases.17 ,22 Specifically, this analysis of a tobacco tax increase on tobacco prices suggests that, in Minnesota, the cigarette industry over-shifted the tobacco tax to consumers. In other words, the cigarette industry used the tax increase as an opportunity to increase retail prices (and, presumably, profit). Of the two cigarette products studied, Marlboro Gold cigarettes were observed to have the biggest over-shift (of US$0.14) after the tax was implemented. However, Camel Blue cigarettes were also observed to have an over-shift (of US$0.06). Based on how smokeless tobacco products are taxed, it was impossible to determine if, or by how much, the tax was over-shifted or under-shifted for these products.
However, this study does present evidence that setting a minimum tax on moist smokeless tobacco products equivalent to the per pack tax on cigarettes along with a high ad valorem tax rate (95%) is an effective way to increase the price of these products. The observed smokeless tobacco prices increased significantly after implementation of the 1 July 2013 increased ad valorem tax on non-cigarette tobacco products and again after implementation of the minimum tax on 1 January 2014.
Our findings support previous findings5–8 but this is the first study to involve tobacco purchases. Prior studies in this area relied on the analysis of tobacco industry documents,8 Nielsen Homescan data,10 self-reported price data from tobacco users,11 surveys of tobacco retailers,7 local tax collection data6 or economic modelling and simulation.5 ,12
The evidence of tax over-shifting by the cigarette industry is inconsistent with many of the arguments made by the tobacco industry as it works against tobacco tax increases through aggressive lobbying. The industry commonly argues that tobacco tax increases are regressive, result in smuggling, and are unfair to tobacco users.23 However, evidence pointing to over-shifting suggests that the tobacco industry is not genuinely concerned about these speculated outcomes of tobacco tax increases.
In Minnesota in each round of the study, a wide variation of prices paid was observed for all four of the studied tobacco products; such variations were associated with store types (chain vs independent), presence of price promotions and neighbourhood socioeconomic characteristics. Although Camel Blue cigarettes appeared to have the largest over-shift, Camel Blue price promotions were the most common type of price promotion observed. However, price increases in Camel Blue cigarettes still revealed over-shifting after accounting for the amount of discount offered by these price promotions. This suggests that price promotions serve as a tobacco company public relations manoeuvre more than a true mechanism for price savings, supported by our previous findings that smokers who received these price promotions are more likely to think positively about the cigarette companies.24
Prices for Camel Blue cigarettes differed across chain versus independent store, and adjusting for price promotions reduced the price differences by store type, suggesting that the offering of price promotions, in part, explains these differences. Minnesota has a minimum cigarette price law that aims at levelling the playing field for tobacco retailers. However, the calculation of minimum cigarette prices under this law does not include price promotions, and therefore fails to level the playing field for retailers who do and do not offer price promotions since retailers who offer price promotions can sell cigarettes lower than the state minimum prices. Prohibiting price promotions in minimum cigarette price laws may level the playing field for all retailers and also uphold the cigarette tax increases.
This study has limitations: First, the cigarette products studied are both considered premium brands. Economy or generic cigarette brands were not studied. As a result, testing whether tax shifting varied by brand could not be accomplished. However, the selected brands represent the cigarette brands with the largest market shares in the Nielsen Convenience Track market data for the Minneapolis region, which covers a large portion of the geographic area studied. Second, the sample of convenience stores was not randomly selected. Rather, it was a sample that was strategically selected for geographic diversity and other factors. Third, the store sample is composed entirely of convenience stores and may not generalise to other types of tobacco retailers (ie, pharmacies, supermarkets, etc). Based on the way that tax is levied on non-cigarette tobacco products (a per cent of wholesale price), it is difficult to determine if prices increased by more than the tax increase. Specifically, because the wholesale prices of the studied products is unknown, we cannot compute exactly how much tax was paid before and after the tax increase. Finally, the study design did not allow us to gather information about any wholesale tobacco discounting that might have played a role in the price variations observed. Despite these limitations, we believe that this study presents useful information about the tobacco industry response to a sizeable tobacco tax increase and how this impacts the real world tobacco prices paid by consumers after the increase takes effect. Given that tobacco tax increases are one of the most effective tobacco control policies available,16 ,17 understanding how these policies are manipulated by the tobacco industry is crucial to making sure that the policies are implemented effectively.
Further research is needed to understand how, or if, the tobacco industry uses wholesale price promotions and direct mail coupons in response to tobacco tax increases. We know that the tobacco industry use price promotions extensively1 ,2 and that direct mail coupons can deliver significant savings to consumers.25 However, more information is needed about how, or if, they use these types of price promotions to specifically blunt the public health impact of tobacco tax increases.
What this paper adds
The tobacco industry spends the bulk of its marketing dollars on promotions designed to reduce the price of tobacco products to consumers. Despite this, there is evidence to suggest that the tobacco industry intentionally increases prices on top of a tobacco tax increase and, in doing so, is able to make additional profits while blaming the entirety of the increase on ‘the government’.
This study found that tobacco tax increases resulted in higher tobacco prices at the retail level, and that the average observed cigarette prices increased by more than the tax increase. This evidence of tax over-shifting by the cigarette industry is inconsistent with many of the arguments made by tobacco industry as it works against tobacco tax increases through aggressive lobbying.
References
Footnotes
Twitter Follow Raymond Boyle at @Raymond_Boyle
Acknowledgements The authors would like to recognise the following people for their work on the research that supported this paper. Data collectors included Alicia Bauman, Amy Roggenbuck, Andrea Kronbach, Bruce Christiansen, Chris Matter, Chris Turner, Erin Simmons, Gina Johnson, Jane Nyquist, Jodi Broadwell, Karen Nitzkorski, Kaylen Swanson, Keely Ihry, Kris Hayden, Lisa Guck, Maribel Marquez, Meg Feyen, Paula Bloemendaal, Renae Borkowski, Ruth Greenslade, Sara Kaebisch, Susan Brace-Adkins, T Jay Christenson, Tess Kubo and Vickie Hotchkiss. In addition, Chris Farmer-Lies created the Access database that we used and was also a data collector, and Samantha Carlson completed the data entry and conducted the preliminary analysis. The authors would also like to thank Charlotte Seidman for her time spent editing and reviewing the paper.
Contributors BB developed the study design, oversaw data collection and led the development and writing of the manuscript. KC provided input on study design, conducted data analysis and was involved in drafting and critically reviewing the manuscript. BAS provided input on study design and critically reviewed the manuscript. MM assisted with study design and data collection, and critically reviewed the manuscript. RGB provided input on study design and manuscript development. All authors have reviewed and approved the final version of the submitted manuscript. BB is responsible for the overall content.
Funding This work was supported by ClearWay MinnesotaSM contract #PA-2014-0003. Dr Choi's effort on the manuscript was supported by the National Institutes of Health, National Institute on Minority Health and Health Disparities, Division of Intramural Research. The study was designed and partly implemented while Dr Choi was at the University of Minnesota.
Competing interests None.
Provenance and peer review Not commissioned; externally peer reviewed.
Data sharing statement There is additional unpublished data around (1) advertised tobacco prices at the point-of-sale and (2) availability of electronic cigarettes. These data are housed at the Association for Nonsmokers-Minnesota and are available to the authors for additional analysis.